Given official statistics are not available, we use changes in nighttime light intensity, measured by satellites, to estimate to what extent the war has destroyed the economy, and whether any recovery can be observed since the Minsk II agreements.
Correct measurement of economic performance is difficult enough in peaceful times and in scenarios, in which reliable economic indicators are available. However, when the necessary data is missing or when its reliability is far from clear, assessing the degree of economic activity – even in the most crude of forms – becomes a significant challenge. And yet, such situations are very frequent, apply to many countries and regions and become most evident at times of military conflicts when data collection is far from a top priority. In the context of the Ukrainian conflict an example of indirectly estimating changes in economic performance can be found in Talavera & Gorodnichenko (2016) who focus on measures of the degree of price integration in the so called Luhansk and Donetsk National Republics (LNR/DNR). In addition, there are various articles using anecdotal evidence to illustrate the economic losses in the East of Ukraine. For example, BBC, 2015 mentions an estimate by the Ukrainian Ministry of Economy that by mid 2015, 50% to 80% of jobs were lost in the so called Luhansk and Donetsk National Republics, compared to the pre-war situation. Knowing the economic situation in the East is important both to assess the economic viability of the so called Luhansk and Donetsk National Republics (LNR/DNR) as well as to assess the likely humanitarian situation in the East.
An alternative indirect way to examine the intensity of economic activity is to use measures based on satellite night time light intensity images. Nighttime light intensity is closely related to electricity consumption, which often has been used as an indicator of economic activity (e.g. Arora and Lieskovsky, 2014). Nighttime light intensity has been used to assess economic activity in sub-Saharan Africa (Henderson et al., 2012), the impact of the crisis in Syria (Li and Li, 2014) or to study how elected politicians favour their own regions worldwide (Hodler and Raschky, 2014). Henderson et al. (2012) find that among low- and middle income countries, a one percent change in light roughly corresponds to a one percent change in income [1].
In this note we use nighttime light intensity to measure economic activity in Eastern Ukraine since the outbreak of the war in the East of Ukraine in April 2014 [2]. As a reference point we use the nighttime light intensity in March, 2014, prior to the outbreak of violence in the East of Ukraine, and we focus on Ukraine’s capital Kyiv and a number of big and small cities in Eastern Ukraine, which we know have been heavily affected by the conflict. In table 1, we compare the light intensity at several points in time (May, 2014; August, 2014; January, 2015; March, 2015; March, 2016) to the light intensity in March, 2014 in these selected cities [3].
Figure 1. Night time images of Kyiv (a), Donetsk (b) and Luhansk (c) in March 2014, 2015 and 2016
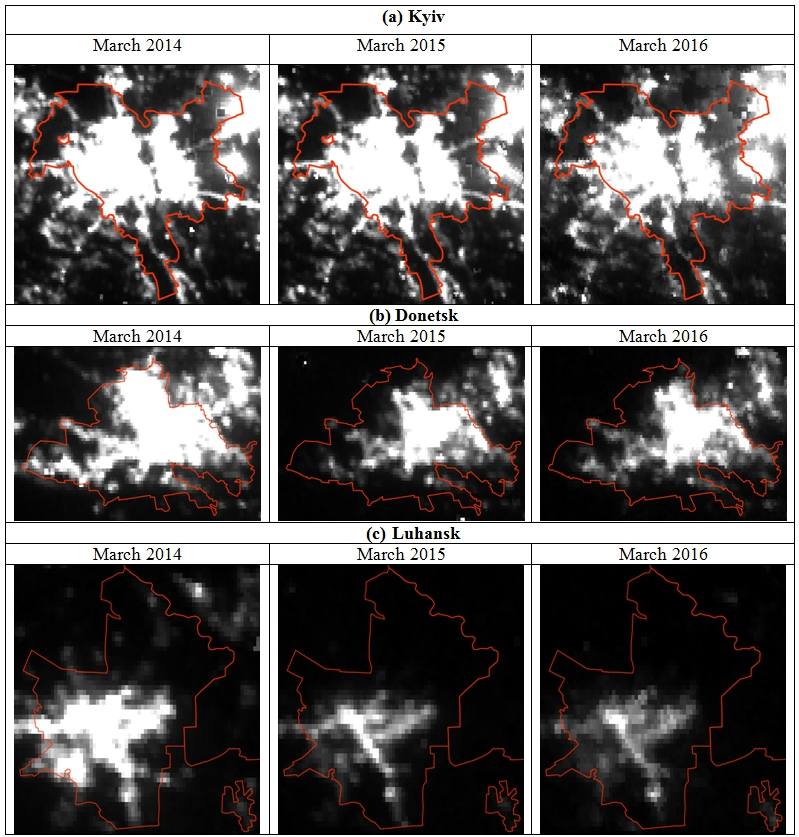
Notes: Radiance was linearly scaled from 0 to 10 nW/cm2/sr, where black pixels represent 0 and white represent 10 or more nW/cm2/sr. Administrative boundaries for cities: © OpenStreetMap contributors, CC BY-SA.
Figure 1 presents sample images of nighttime illumination for Kyiv, Donetsk and Luhansk in March, 2014, 2015 and 2016. We can see that between March 2014 and 2015, in the case of Donetsk and Luhansk, both the surface area lit as well as the measured light intensity significantly decreased, while there is very little change in the case of Kyiv. A similar picture emerges in other cities that were not directly affected by the war, such as, for example Zaporizhia, Dnipropetrovsk and Kharkiv (see Table 1). While, as in Kyiv, there are ups and downs in terms of measured nighttime light intensity, by and large, the level of economic activity remains fairly similar over time.
The situation is clearly different in Donetsk and Luhansk, the two major occupied towns. Nighttime light intensity in Donetsk is about half of the level it was before the outbreak of violence in the East of Ukraine. Luhansk fares even worse – light intensity as measured in March 2015 and 2016 is roughly a third of the initial level (Table 1).
Table 1. Change in night time light intensity across time for selected cities in Ukraine
| Date | May 2014 | August 2014 | January 2015 | March 2015 | March 2016 |
| versus March 2014 | |||||
| Kyiv | 1.04 | 0.99 | 0.77 | 1.01 | 0.80 |
| Kharkiv | 1.06 | 1.02 | 1.60 | 1.67 | 0.74 |
| Zaporizhia | 1.18 | 1.16 | 1.11 | 1.14 | 0.86 |
| Dnipropetrovsk | 1.39 | 1.39 | 1.48 | 1.52 | 1.04 |
| Sloviansk | 0.63 | 0.71 | 0.77 | 0.66 | 0.48 |
| Kramatorsk | 0.67 | 0.75 | 0.87 | 0.91 | 0.72 |
| DNR/LNR | |||||
| Luhansk | 0.93 | 0.16 | 0.33 | 0.34 | 0.29 |
| Donetsk | 1.00 | 0.60 | 0.72 | 0.45 | 0.45 |
| Ilovaisk | 1.00 | 0.54 | 0.26 | 0.36 | 0.32 |
| Debaltseve | 1.13 | 0.22 | 0.15 | 0.03 | 0.09 |
The numbers in the table are ratios of light intensity, comparing a given point in time to March 15, 2014. Hence, the number 1 suggest no change, numbers over 1 suggest improvements, numbers below 1 suggest decreases in economic activity.
Ilovaisk and Debaltseve, two cities where major battles took place and which are now under control of the so called DNR/LNR, clearly have suffered a lot and are still far from recovering. Illovaisk is at about a third of its original level of light intensity, while Debaltseve is at less than a tenth (!) of the level in 2014. It is thus clear that economic recovery in these areas takes a long time, and that this is also true for the government controlled areas. This is illustrated by the fact that cities such as Sloviansk and to a lesser extent Kramatorsk are also still far away from their pre-conflict level of light intensity.
Conclusion
The above analysis of changes in nighttime light intensity data leads to two important conclusions. First, the impact of the war in Eastern Ukraine on the level of economic activity in the area is sizeable and varies considerably across towns. Levels of nighttime light intensity are at 30 to 50% of their pre-war level in the big cities and at only a tenth of their pre-war level in some smaller cities. Using the Henderson et al. (2012) one to one ratio of changes in nighttime light intensity and economic development, this suggest the economic activity in the Donbas region has similarly dropped in economic terms to 30 to 50% of the pre-war level for the big cities and to only a tenth of the pre-war level for some smaller cities.
Second, there has been no sign of economic recovery in the region since the Minsk I and II agreements. Even though military activity in the Donbas region has decreased compared to the period April 2014-February 2015, the economy – at least as measured by the intensity of lights – has not been improving and the economic situation of the Donbas population remains very far from what it used to be before the war.
Notes
[1] The elasticity of growth of lights emanating into space with respect to income growth is close to one (p. 1025)
[2] We use version 1 nighttime monthly data from the Visible Infrared Imaging Radiometer Suite (VIIRS) Day/Night Band (DNB) generated by the Earth Observation Group at NOAA National Geophysical Data Center and made publically available for download.
[3] Given the specificity of light intensity measures, we focus on changes between periods rather than levels because light intensity is computed as the sum of radiance over a selected area, and hence the level of intensity depends on the scale of the area. For comparisons over time, we always use the same geographic area. It is important to remember that these changes are proxies only since changes in light intensity can be sensitive to weather conditions over time. Thus, to be able to make informative judgement on the basis of these data, we focus on the broad picture that emerges from the data, rather than on specific values.
References
1. Arora, Vipin and Jozef Lieskovsky (2014), “Electricity Use as an Indicator of U.S. Economic Activity”, U.S. Energy Information Administration Working Paper.
2. BBC (2015) – Ukrainian Service, ‘ One year after the referendum DNR/LNR: Economic Losses’, May122015.
3. Henderson, J.Vernon ,Adam Storeygard, and David N. Weil (2012), Measuring Economic Growth from Outer Space, American Economic Review 2012, 102: 994–1028
4. Hodler, Roland, and Paul A. Raschky (2014), Regional Favouritism. Quarterly Journal of Economics 129: 995-1033.
5. Talavera, Oleksandr and Yuriy Gorodnichenko (2016), How’s DNR Economy Doing, VoxUkraine April 7, 2016
6. Xi Li & Deren Li (2014) Can night-time light images play a role in evaluating the Syrian Crisis?, International Journal of Remote Sensing, 35: 6648-6661.
By: Tom Coupe (Kyiv School of Economics), Michał Myck (CENEA, Poland), Mateusz Najsztub (CENEA, Poland)


Застереження
The authors do not work for, consult to, own shares in or receive funding from any company or organization that would benefit from this article, and have no relevant affiliations