Using Economic Complexity Index, which is based on trade data, we explore revealed technological sophistication of Ukrainian economy. We find that the structure of Ukrainian export has remained largely the same as 20 years ago with large share of metals, minerals and agricultural products that turn out to be among least technologically advanced industries. As a result, Ukrainian economy lags behind those economies who were able to specialize in more sophisticated industries. Policy-makers must identify and remove obstacles that dampen innovation and reorientation towards more knowledge-intense industries.
Introduction
Few factors can be more important for long-term economic development than technological progress. Measuring technological sophistication or, in other words, production knowledge that can be used to assemble better and cheaper goods is a difficult task. Ricardo Hausmann and Cesar Hidalgo develop the tool for this – the Economic Complexity Index (henceforth ECI). In this piece we will explore how Ukrainian position in the ECI ranking evolved over time and in comparison to neighboring countries.
Economic complexity index
The authors of ECI start with the premise that the larger is the stock of knowledge about production processes a country has (in other words, the higher is the level of production technology), the more products can the country produce, and the more sophisticated those products will be. Thus the variety of goods produced by the country can reveal some information about the level of technology, and this idea is captured by ECI. In general, countries will have a larger ECI if their production pattern is more diversified (more goods are produced) or if they produce more sophisticated goods (those goods that are not produced by a lot of other countries). Inquisitive readers are referred to the Atlas of Economic Complexity to better understand the math behind ECI.
The ideal measure of economic complexity requires gargantuan amount of data, which is not readily available, since one needs to know production volumes of finely classified goods and services in all countries around the world. To circumvent this problem, ECI uses international trade (export and import) data. The main advantage of using trade data is that it is available at a relatively disaggregated level on the website of UN Comtrade, and is constructed using high-quality customs data of both importing and exporting countries. Using trade data, however, also has its disadvantages:
- It is not a perfect measure of production, since some of the goods and are not tradable, and country export structure can be different from production structure overall
- ECI completely ignores services, which comprise over 50% of GDP in most countries (and over ⅔ of GDP in developed countries)
- ECI uses HS 4-digit classification of goods. For example, it treats such goods as “8703: motor cars & vehicles for transporting persons” to be the same (in other words, if two countries only produce cars they will have similar scores on ECI). However, there can be a lot of heterogeneity within groups of products defined in this way: fancy Ukrainian cars versus German cars.
Thus ECI measures complexity of tradable goods sector of the economy. In what follows we will assume that this index is a good proxy for the overall level of technology in the country. This might not be a terrible assumption since, as shown in the Atlas, countries with larger ECI tend to be richer and grow faster in future, and the relationship is robust even when we control for the measures of governance, education, etc.
ECI in Ukraine
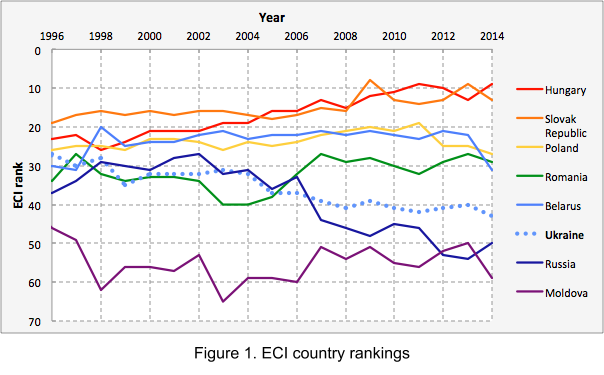
Figure 1 plots historical ECI rankings of Ukraine (dotted blue line) and its neighbors. We observe several regularities. First, over roughly last two decades Ukrainian position in the ranking was deteriorating. Second, the trends are different for EU and non-EU members. While Hungary, Slovak Republic and Poland improved their relative position in the ranking between 1996 and 2014, Ukraine, Russia, Belarus, and Moldova moved down the list.
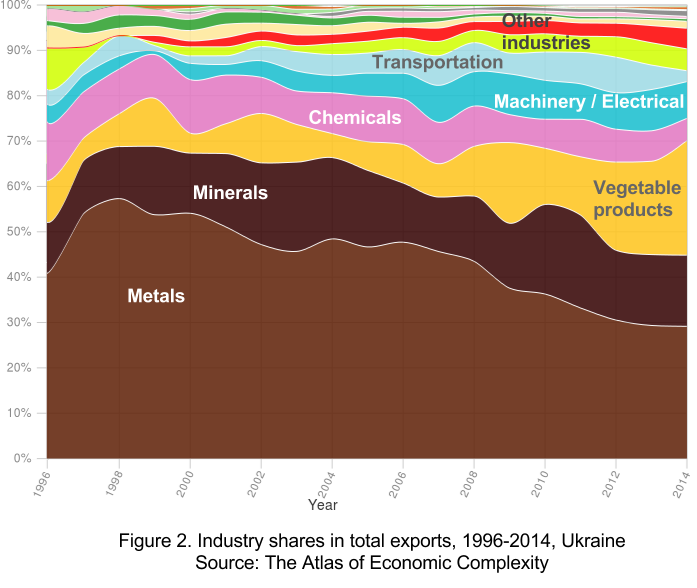
We can further decompose Ukrainian exports into industries and products to understand the reasons behind deterioration of measured complexity of Ukrainian economy. Figure 2 plots composition of Ukrainian export over 1996-2014. In 2014, three quarters of Ukrainian exports were composed of metals, mineral products, vegetable products and foodstuffs, which is even larger than the share of these industries in 1996 (around 70%). It should not come as a surprise that those industries are on average among the least complex one, as measured by ECI. The combined share of the most complex industries, such as machinery and electrical equipment, chemicals, and transportation equipment was 15% in 2014 (20 % in 1996). The takeaway is that since mid-1990s Ukrainian export hasn’t shifted to more sophisticated industries, if anything, the share of the most complex industries decreased.
One might argue that grouping industries as on Figure 2 is coarse, and there can be a lot of ‘hidden varieties’ within each industry. Over the period under study production could have shifted from less sophisticated to more sophisticated products within each industry. If we look at a finer export decomposition (as disaggregated as HS 4-digit product level) we can see that this is not the case, there hasn’t been a dramatic shift to more sophisticated products. If anything, tables 1 and 2 provide some evidence in favor of the opposite. Those tables contain shares in Ukrainian export (column 2) and 2014 values of the index of economic complexity (column 3) for some HS4 products. As for the case of countries, larger values of economic complexity index for products imply greater complexity. Note that ECI treats HS4 products to be the same across countries (e.g. Ukrainian dirigibles and German dirigibles are treated as one product and would be assigned the same ECI). To give reader some idea on how to interpret the 2014 ECI values, note that ECI value for the most complex economy, Japan, was 2.20 in 2014 (Ukrainian ECI stood at 0.42); a quarter of products have ECI of 2.24 and larger, half of the products have ECI of 1.07 and larger, and the quarter of the least complex products (such as oil and other minerals) have ECI of -0.43 and lower. Table 1 and Table 2 contain information on 12 and 10 goods with largest export shares in 1996 and 2014 respectively, with their combined shares of around 50% in each year. First, we see greater importance of cereals, which are not very complex goods, in 2014. Second, we do not see reallocation of production towards more complex goods within industries. For example, within metals, the share of less complex semifinished steel products increased relatively to the share of the more sophisticated hot rolled iron.
Table 1. Top export products and their share in 1996 (Ukraine)
| HS4 code | Export share | 2014 ECI | Industry | Description |
| 7208 | 9% | 1.59 | Metals | Hot rolled iron or non-alloy steel |
| 1701 | 6% | -2.15 | Foodstuffs | Raw sugar, cane |
| 7207 | 5% | 0.06 | Metals | Semifinished products of iron or nonalloy steel |
| 3102 | 4% | -0.90 | Chemicals | Mineral or chemical fertilizers, nitrogenous |
| 2601 | 4% | -2.80 | Minerals | Iron ores and concentrates |
| 2814 | 4% | -1.77 | Chemicals | Ammonia |
| 7202 | 4% | -0.41 | Metals | Ferroalloys |
| 7228 | 4% | 2.60 | Metals | Hollow drill bars and rods, of alloy or non-alloy steel |
| 2710 | 3% | -0.35 | Minerals | Petroleum oils, refined |
| 7213 | 3% | 1.33 | Metals | Hot rolled bar/rod grooved iron or non-alloy steel in irregular coils |
| 7305 | 3% | 0.38 | Metals | Other tubes and pipes of iron or steel having circular cross section |
| 7304 | 3% | 2.32 | Metals | Tubes, pipes and hollow profiles, seamless, of iron or steel |
| Source: The Atlas of Economic Complexity | ||||
Table 2. Top export products and their share in 2014 (Ukraine)
| HS4 code | Export share | 2014 ECI | Industry | Description |
| 7207 | 9% | 0.06 | Metals | Semifinished products of iron or nonalloy steel |
| 2601 | 8% | -2.80 | Minerals | Iron ores and concentrates |
| 1512 | 7% | -0.88 | Vegetable products | Sunflower-seed or safflower oil, crude |
| 1005 | 7% | -0.96 | Vegetable products | Maize (corn) seed |
| 1001 | 5% | 0.71 | Vegetable products | Wheat and meslin |
| 7209 | 5% | 1.59 | Metals | Hot rolled iron or non-alloy steel |
| 7215 | 3% | 0.76 | Metals | Other bars and rods of iron or nonalloy steel |
| 7202 | 2% | -0.41 | Metals | Ferroalloys |
| 2306 | 2% | -0.87 | Foodstuffs | Cotton seed oilcake |
| 8544 | 2% | -0.31 | Machinery / Electrical | Insulated wire; optical fiber cables |
| Source: The Atlas of Economic Complexity | ||||
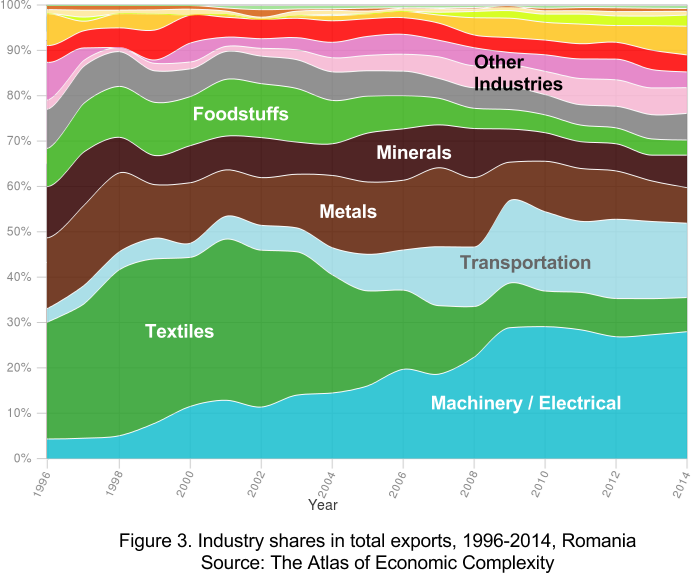
This might not have been bad news for the ECI ranking had other economies followed similar pattern. In reality, a lot of countries managed to increase the measured complexity of their economies and, most likely, improved their stock of production knowledge and technology. Take Romania, for an example, with its export structure being depicted on Figure 3. In 1996, over a quarter of Romanian exports was coming from textile industry, another quarter was comprised of metals and mineral products. Machinery/electrical and transportation products contributed around 8% combined. In 2014, the share of more sophisticated machinery and transportation soared to around 45% combined in expense of more backward industries. This helped Romania gain 10 positions in the ECI since 2004 and overtake Ukraine (see Figure 1), now it is one of the world’s top 30 most complex economies. One can tell similar stories by looking at export structure of Hungary, Slovak Republic and Poland – all these countries shifted their export structure towards more advanced industries. On the other hand, Russia, Belarus, and Moldova, still heavily rely upon export of less sophisticated goods (for example, oil and gas make up to 70% of Russian export).
Implications
In this piece we tried to look at the overall level of technology in the Ukrainian economy measured by Economic Complexity Index, which uses data on trade in goods to infer the stock of productive knowledge of the economy. From the perspective of ECI, Ukrainian economy has been gradually falling behind the economic complexity frontier countries because the export structure hasn’t shifted to more sophisticated industries and products. Even though there were still 81 countries with lower values of ECI (there are 124 countries in the ranking in total), the trend is disappointing.
We would like to be abstain from arguing that worsening ECI performance directly clamps down on the level of economic welfare in Ukraine. There are countries much richer than Ukraine that score worse on the ECI, such as New Zealand and Australia. We rather view it as an indication that some problems in the economy exist that prevented Ukraine to perform as well as some of its neighbors and change the structure of its industries. Such problems, for example, may prevent Ukrainian producers from using plentiful semifinished products of iron to make more transmission shafts and use the latter to make all kinds of sophisticated machinery. ECI alone doesn’t point to specific problems nor does it provide any solutions to those problems. High values of ECI thus should not be the main goal of policy per se as this can result in ‘manual’ regulation of some industries leading to harmful distortions. Policymakers should rather find out what prevents businesses from opening technological production facilities: is it lack of educated workforce, intermediate inputs; or is it low level of investment protection and rule of law; are there any monopolies that dampen competition and entry; is corruption overwhelming and tax system fair; and what shall be done about all of it.


Attention
The author doesn`t work for, consult to, own shares in or receive funding from any company or organization that would benefit from this article, and have no relevant affiliations