A 'KROK' Away from the Medical Education Reform. What is wrong with tests for medical students?

Krok exam results point to 'abnormal' increase of correct answers, which coincides with the 'pass/not pass' threshold for some years. So how efficient is KROK in this case? A study by VoxUkraine and KSE
Authors: Inna Sovsun, Tetyana Tyshchuk

The material was created within the framework of the project “Do not Believe Myths” with the support of the International Renaissance Foundation.

We all want to receive treatment from a highly qualified, involved doctor, who really wants us to get healthy and never need their services again. But where do you find a specialist like that, where do they come from? There is only one possible answer to this question: first of all, a good doctor in the future is a good medical student in the present.

Of course, a lot depends on the student's motivation, their talent and the ability to learn and analyze. So what should be the instruments which can be used to assess academic performance of a medical student and their future as a doctor? We are referring to the system of exams and tests. They help determine whether today's student will make a good doctor tomorrow.

VoxUkraine analysts tried to learn about the exams we have in Ukraine and, most importantly, the way they affect future qualification of doctors.

Three ‘KROKs’ to a Doctor

The system of assessment at medical schools is an extremely important factor in medical education – both in Ukraine and abroad. Ukrainian medical students have been passing KROK exam since 1998:

The exams have been developed in close international cooperation and are based on the best world practices. It was the first success story of independent assessment development in Ukraine, which was also used when External Independent Assessment was launched in early 2000s.

Yet, despite the use of best world practices, students, teachers and doctors are often critical about Krok exams.

Most complaints concern the quality of tests. In response to criticism, Testing Centre was continuously saying that the tests were prepared by university teachers so they should be the ones to answer questions. In their turn, the teachers, are complaining, and rightfully so, about lack of payment for the complicated task of developing tests. Obviously, not all quality issues have to do with the level of teacher motivation. There are questions about the syllabi that the exam questions are based on and inconsistencies of answers to the same question in different exam tasks. All things considered, it becomes apparent that the existing model of preparation for the test exam cannot guarantee quality result.

Apart from complaints about the quality of tests, students and teachers constantly express doubt as to the level of transparency and objectivity of Krok assessment. They are voicing various sums needed to `deal with this`, giving names of people that can allegedly help and retelling stories of those who allegedly `got everything handled`. At the same time, over the 20 years of Krok existence no one was able to prove any of those suspicions or allegations.

Analysis of KROK Results

In the summer of 2018, Ministry of Healthcare of Ukraine (MoH) asked Testing Centre to provide complete information on Krok exam results. In view of planned changes in the assessment of medical students, MoH wanted to do a more comprehensive analysis of the academic results. Authors of this article got the resulting depersonalized data.

All in all, it includes information about more than 197,000 exams taken between 2009 and 2018 (yet, there are years or exams for which data was not supplied).

One of the key issues that most people pay attention to when analyzing tests is how natural the distribution of points is. ‘Normal (or natural) distribution’ is one of the key concepts in statistics. Back in the 19th century mathematicians noticed that for numerous samples of observations graphic presentation of probability is bell-shaped. Such distribution is called ‘normal’ or ‘Gaussian’ after the mathematician who formulated this key concept of statistics for the first time.

What does this mean for test studies? There is a certain ‘normal distribution’ of the results: a small number of persons receive the lowest points, a slightly higher result goes to a slightly bigger number of people and as the result increases the number of people who get them increases. As it reaches a certain point, the value starts decreasing so a very small number of people gets the highest point.

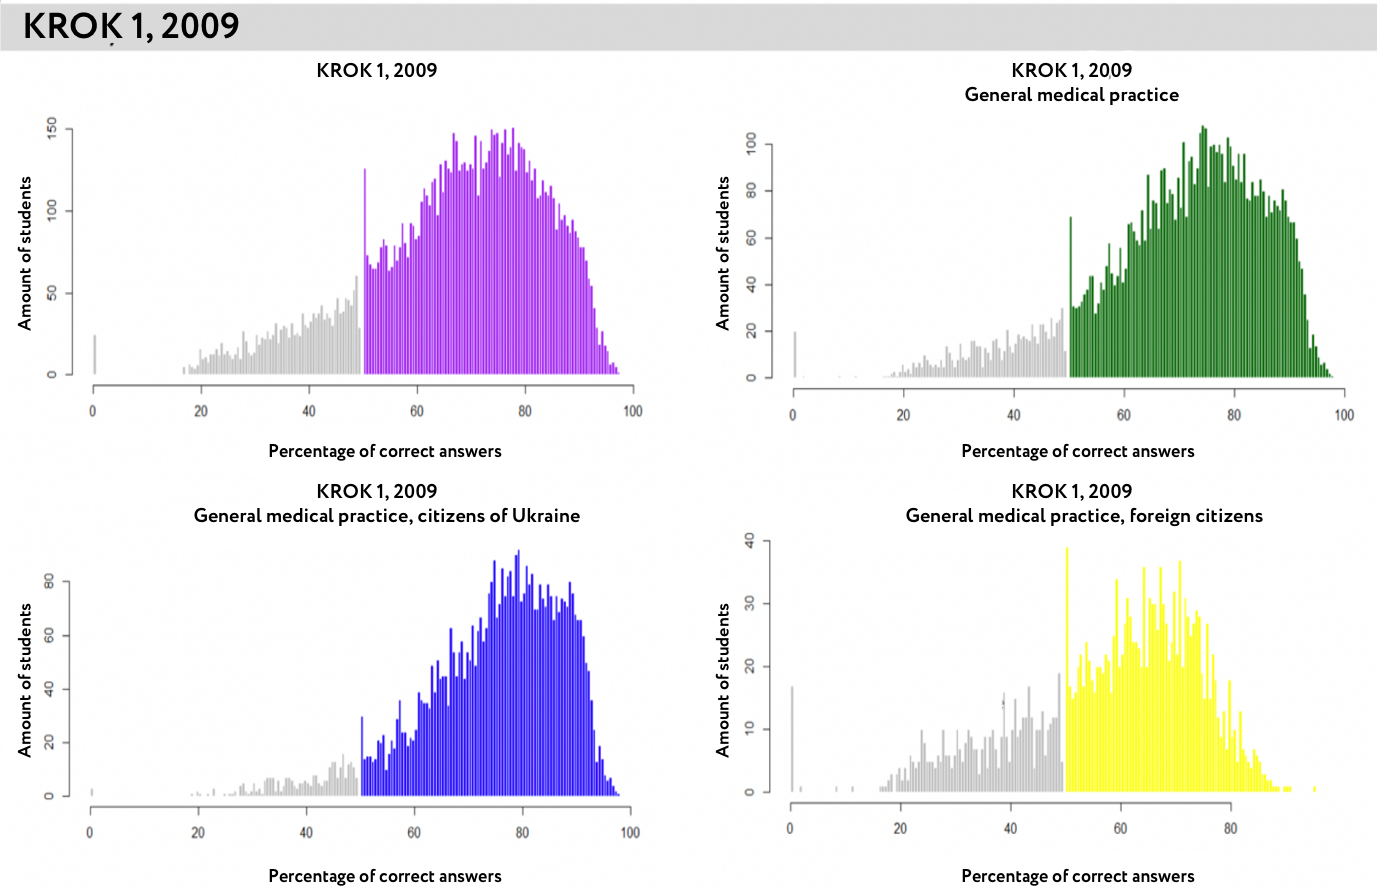
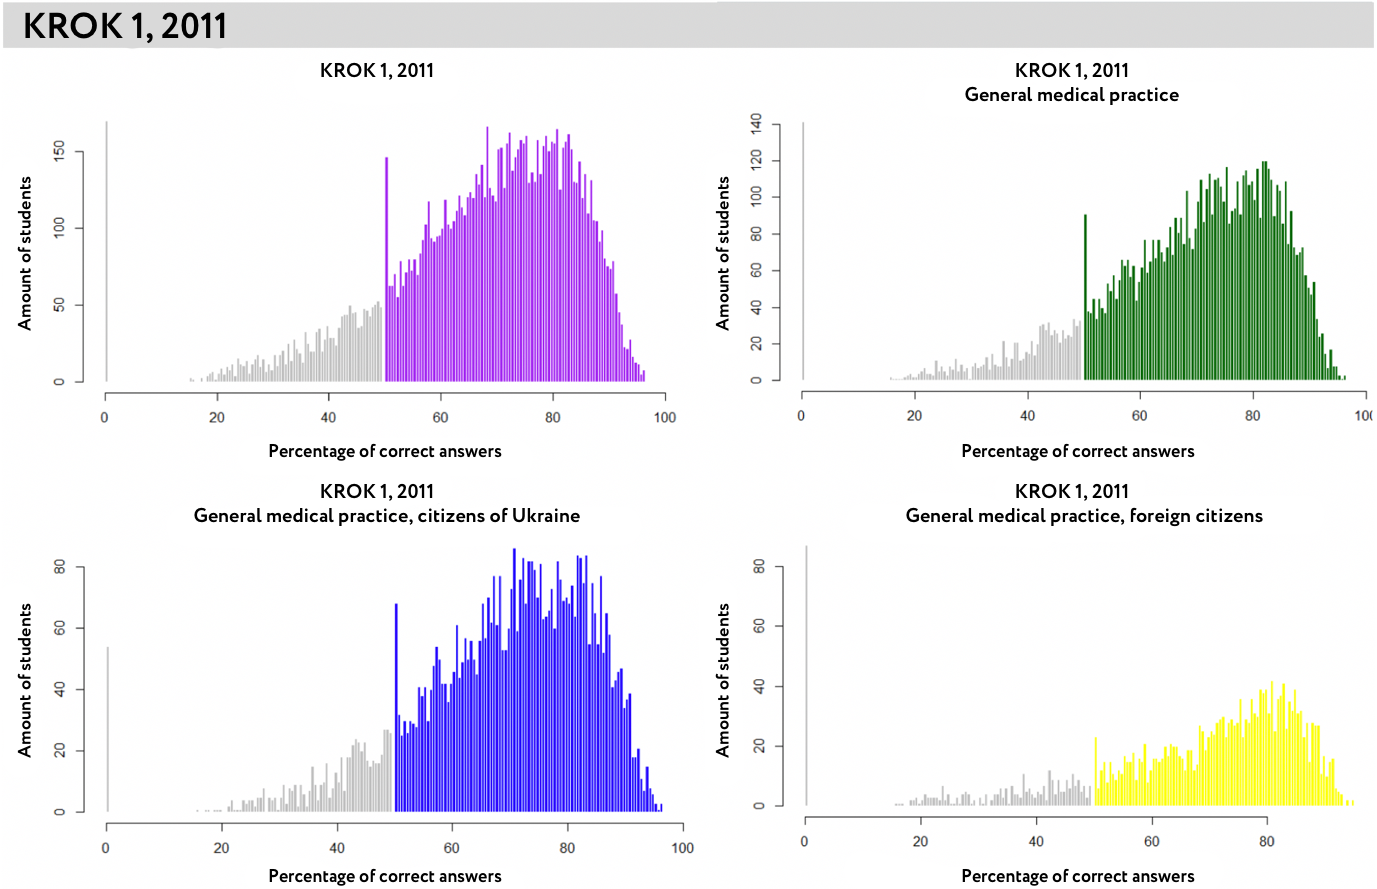
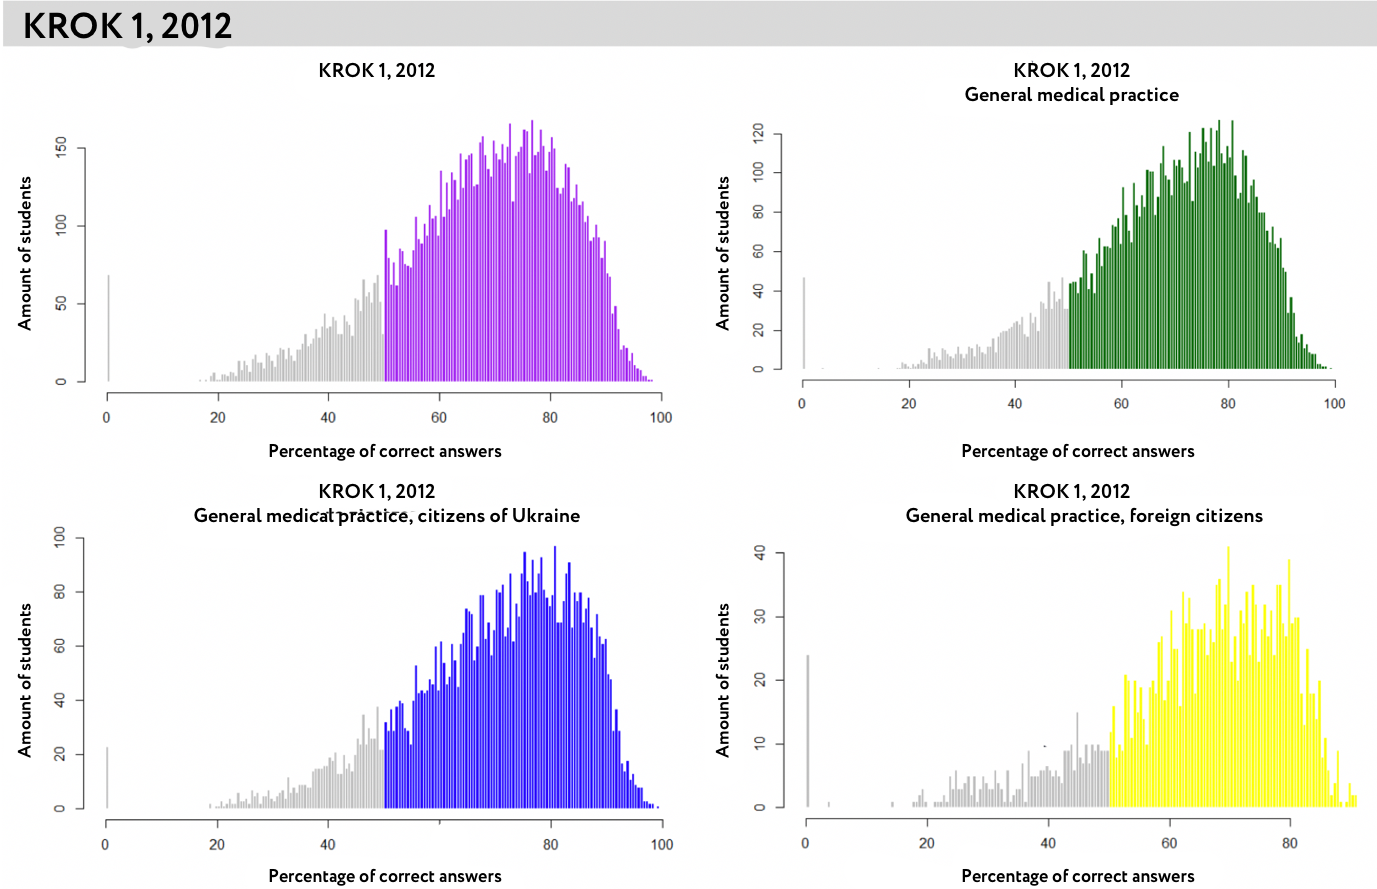
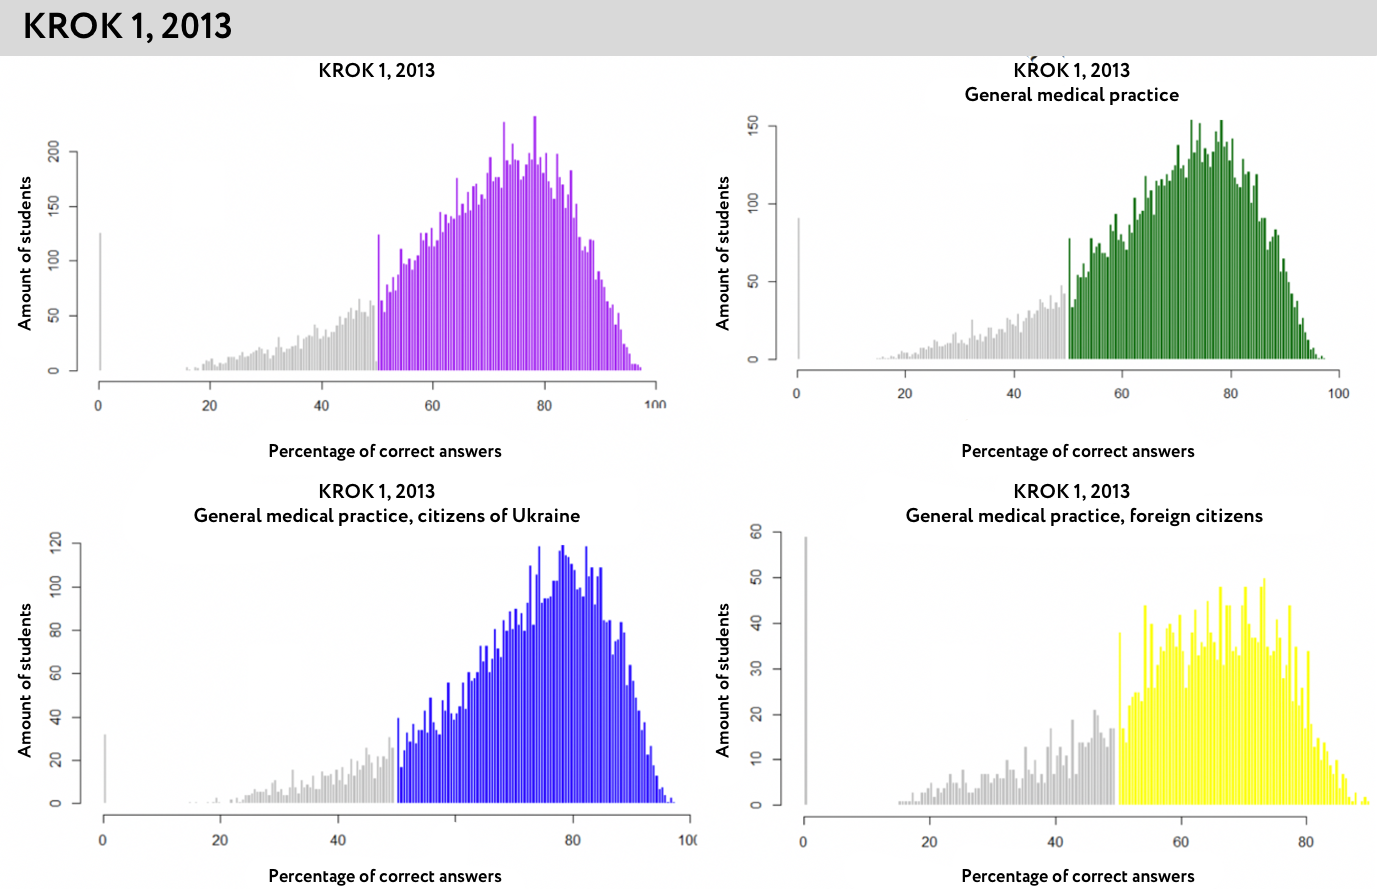
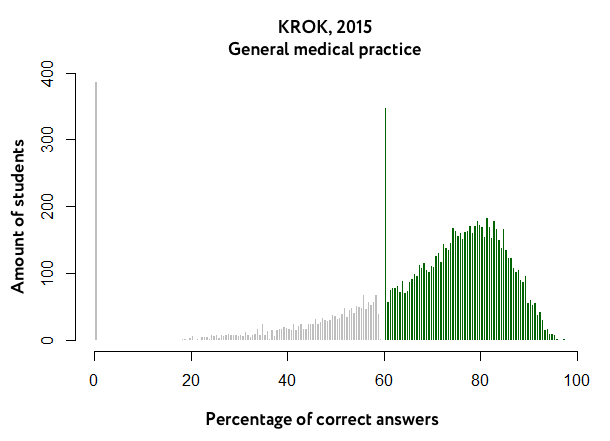
When analyzing the distribution of Krok results, a few things come to the foreground. A small number of students gets the lowest number of points which corresponds to the number of correct answers. As the number of points increases so does the number of people who get them. Then, however, the number of people who got a certain number of points rapidly drops.

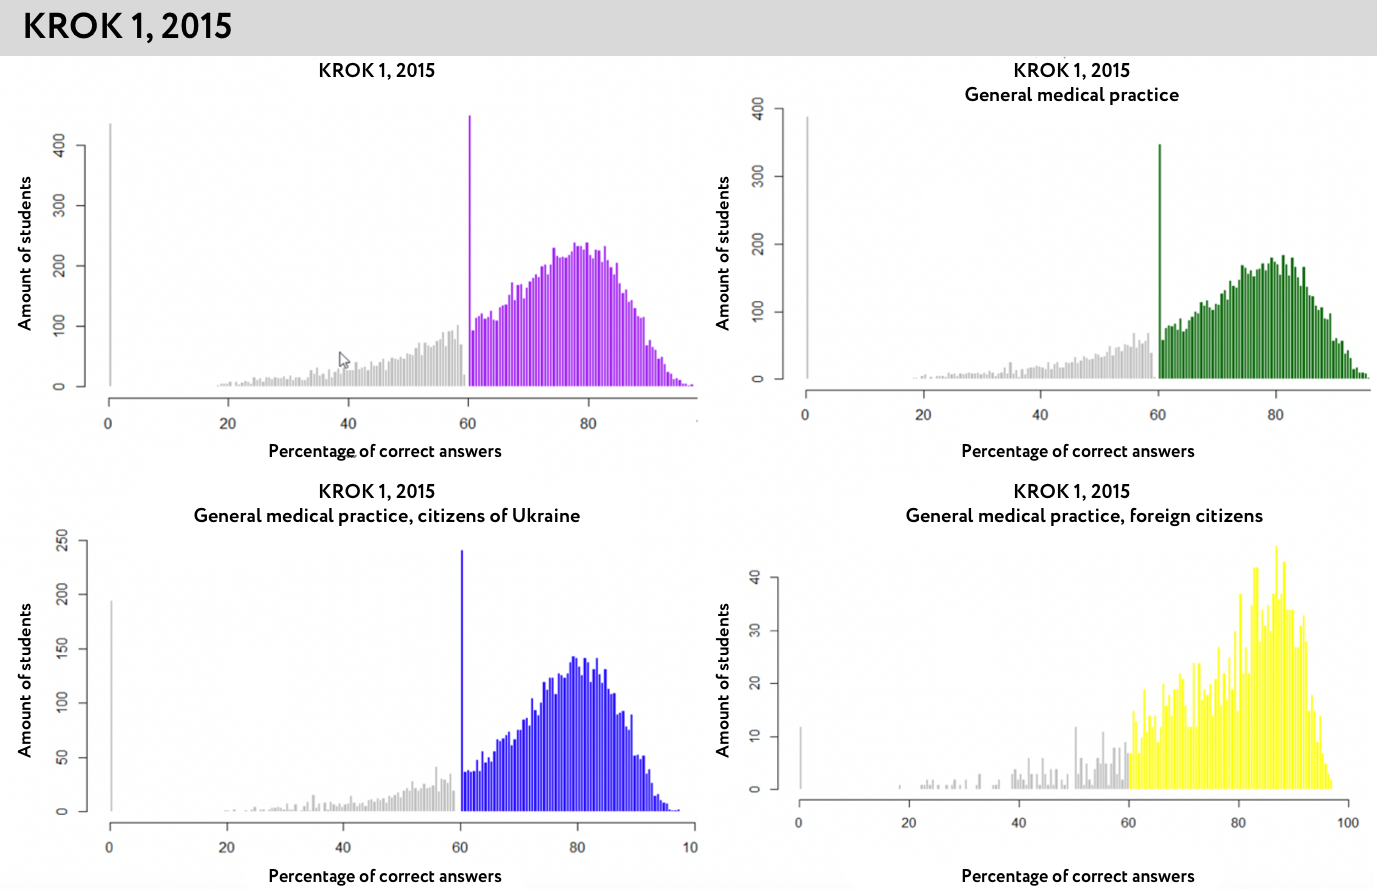
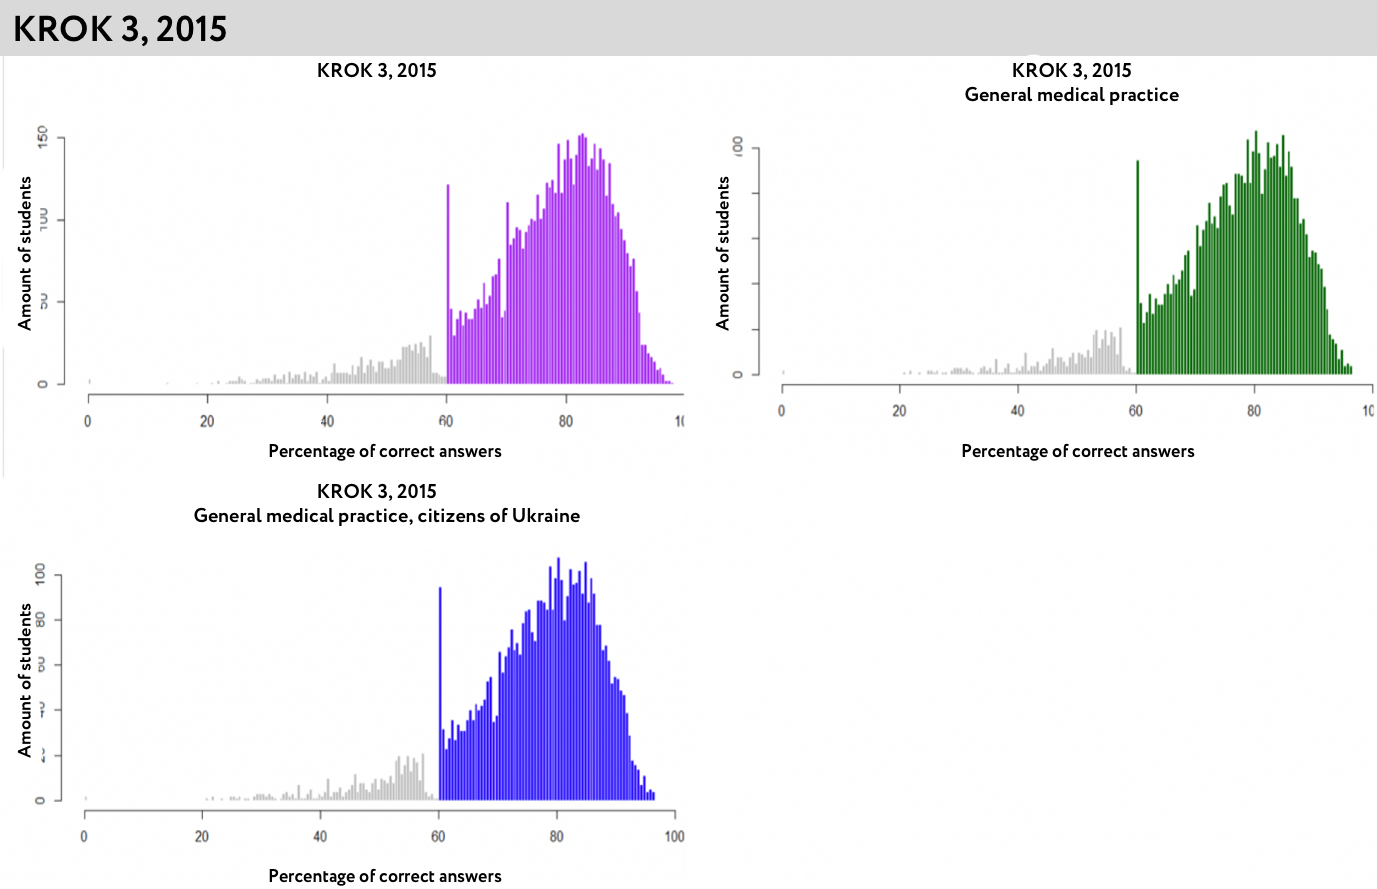
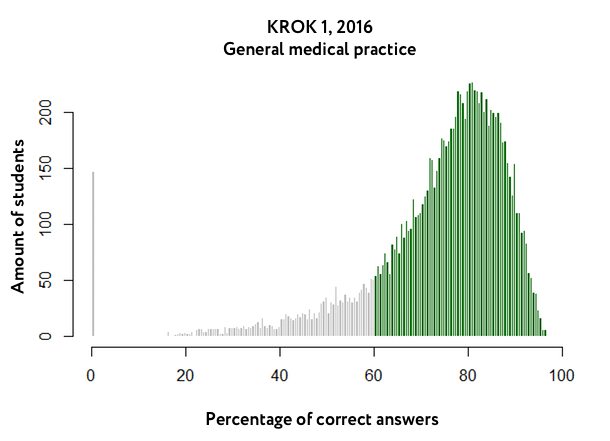
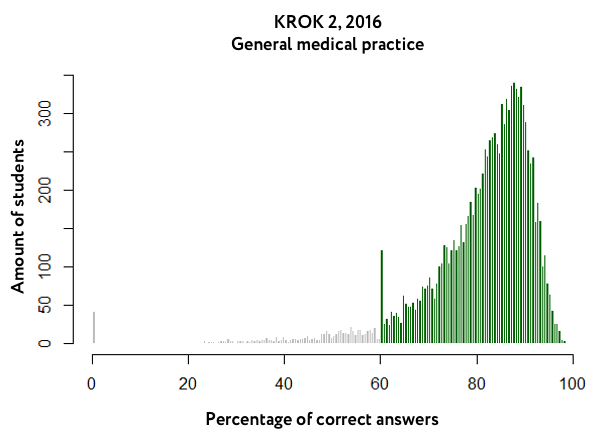
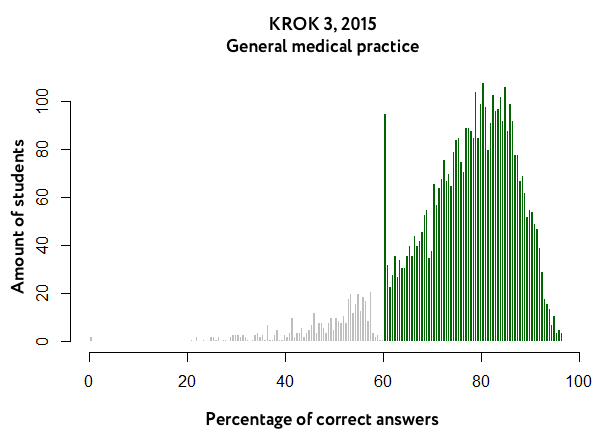
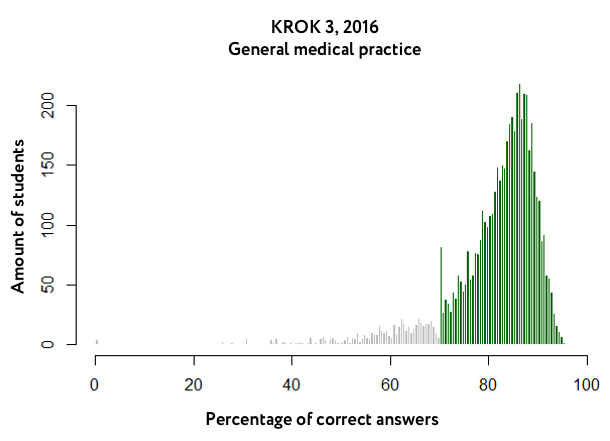
Figures for Krok 1 (Fig. 2) show a `gap` around 50% mark for the years 2009-2014. However, the number of people who got 50.5% in 2009-2014 is disproportionately high – higher than the number of people who got 51%. In 2015 (Fig. 1) the same situation may be observed but for a different part of the curve: 60% - a rapid decrease of the number of people; 60.5% - a high number of people.

Fig. 1. Krok 1 results chart for 2015
(marked grey are the results below the mark ‘pass/not pass’, violet are the results that are higher than the threshold)
Krok1-2015

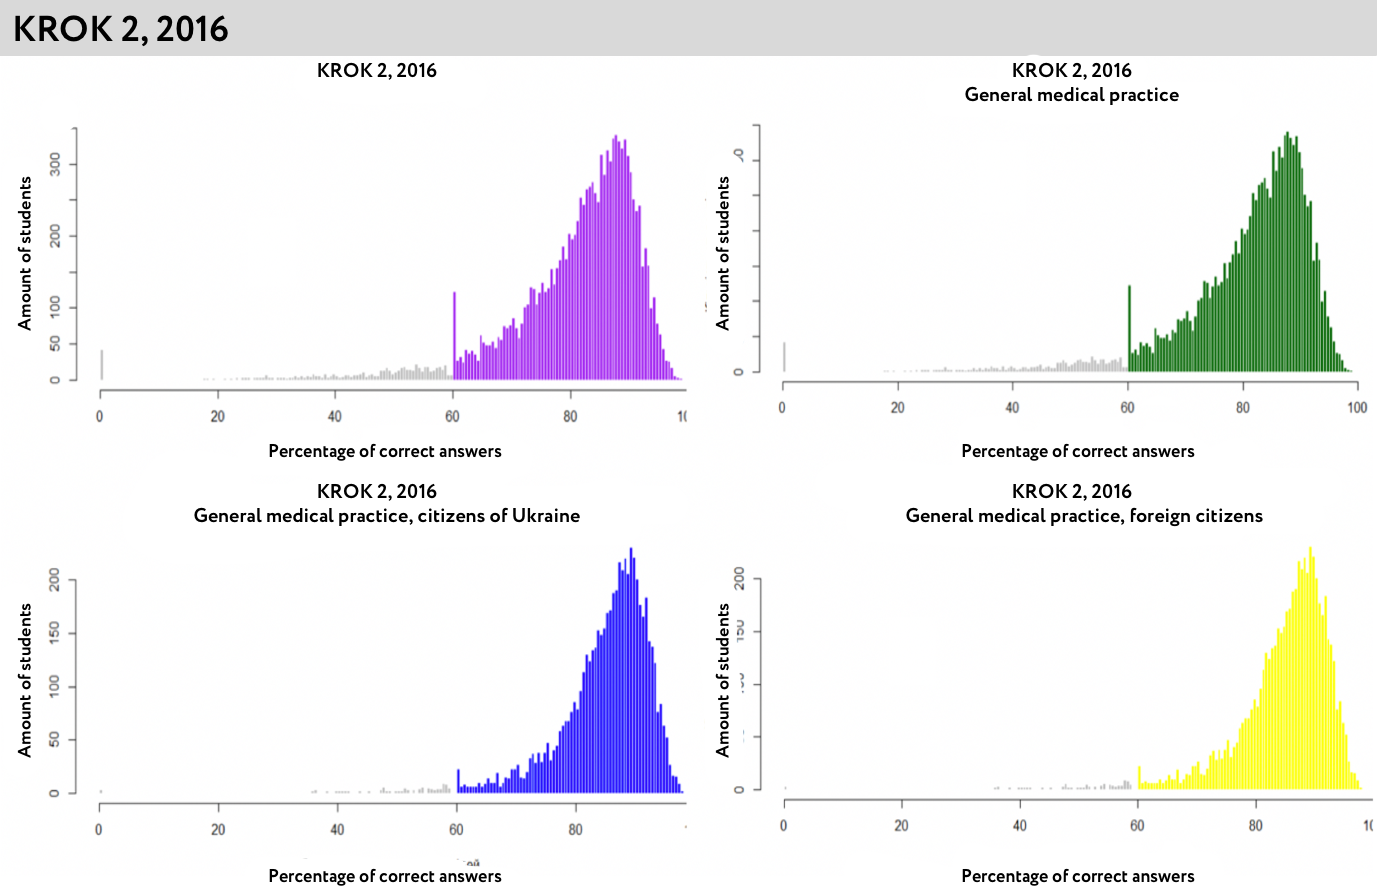
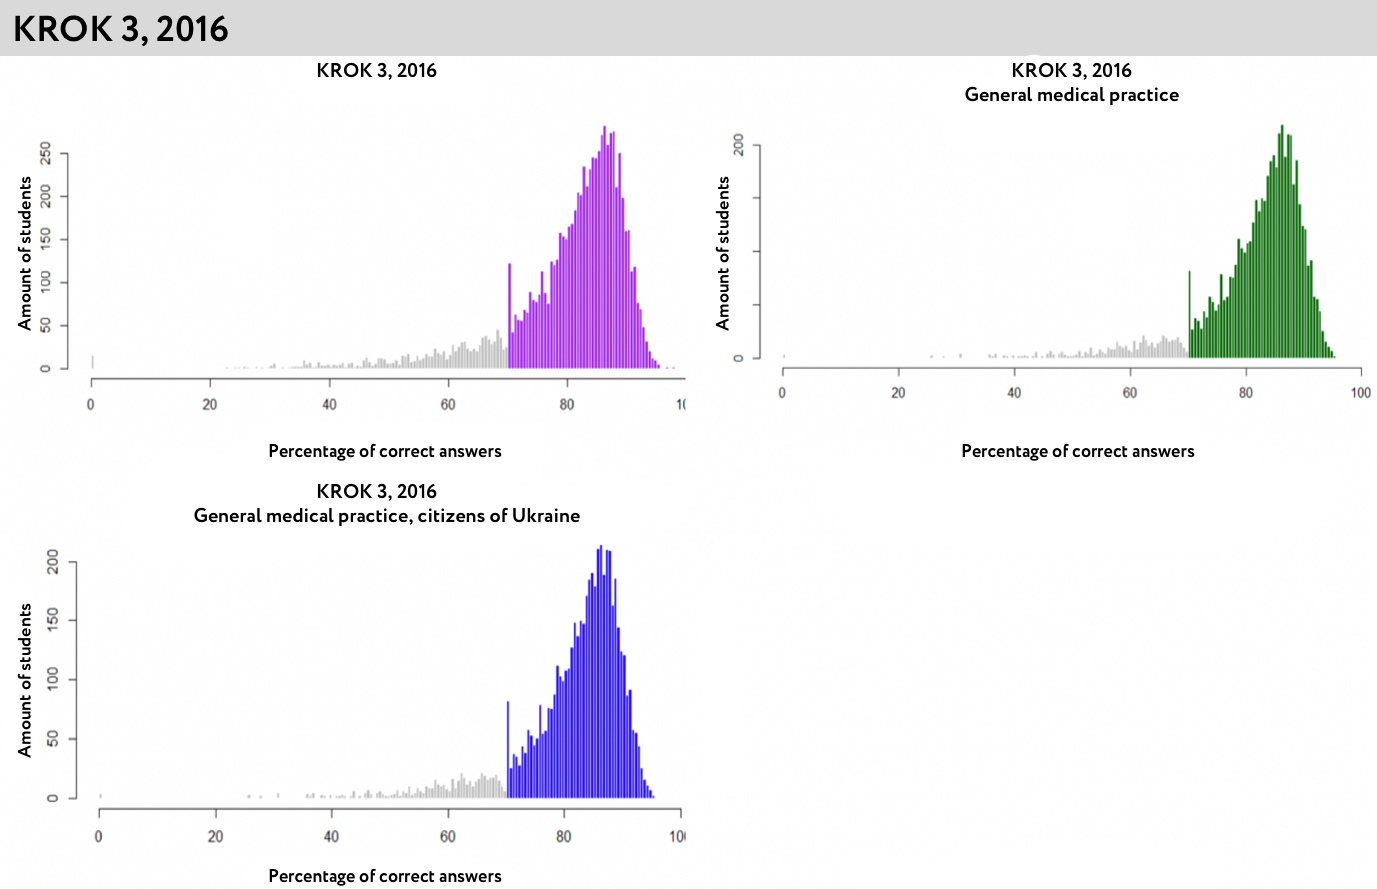
As a matter of fact, we are witnessing a disproportionately higher number of students who got a specific number of points. At the same time, the `abnormal` increase clearly coincides with the `pass/not pass` threshold every time. Thus, in 2015 the `pass/not pass` threshold increased from 50.5% to 60.5% - and the jump reached exactly the same level. A similar situation is seen with Krok 2 and Krok 3.

What we are seeing on the chart is called discontinuity distribution. Scientists have already researched this phenomenon. In particular, such research was conducted to assess the values of regulatory procedures compliance. Research shows that an inexplicably large share of companies find themselves right before the threshold value which signifies implementation of regulations. Researchers have also analyzed such distribution to see how people optimize their taxes. Many people have lower than threshold value income, where the threshold value stands for the next level of tax rate.

Fig. 2. Chart of Krok exam results for specific years, major `Medicine` (General medical practice)
KROK 1
Крок1-2009
Крок1-2011
Крок1-2012
Крок1-2013
Крок1-2015
Крок1-2016
KROK 2
Крок2-2015
Крок2-2016
KROK 3
Крок3-2015
Крок3-2016

What are we seeing here?

What are the trends that we see in analyzed data?

  1. Data for most years shows a rapid increase of the number of people who got a number of points which coincides with the threshold value of 'pass/not pass'.
  2. The height of ‘jump’ is different for different years. What we see is that for some years the height of 'jumP' actually compensates for the decrease on the previous value, which proves that the points of persons who got 0.5 less than the threshold value, were 'added up'. At the same time, in some years the rapid jump cannot be explained by the 'add ups only' During some years the jump is 2.5 times higher than the average value between two neighbouring positive values, for other years it is 8 times higher or almost the same. If the add ups were done automatically and the approach was the same in all cases, the deviation would be more or less the same.
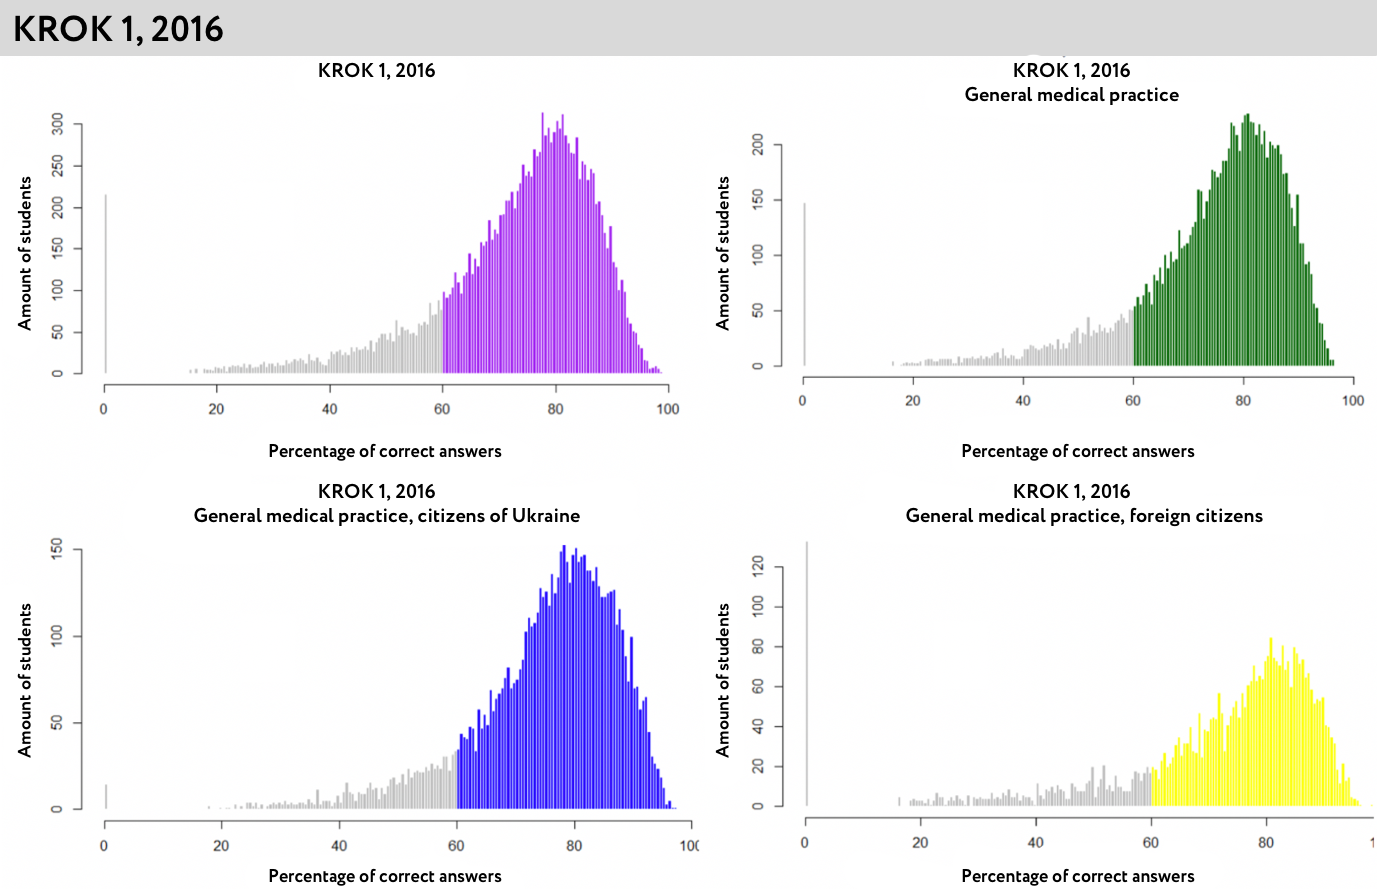
  3. Charts for different years are different, which shows change in the approach toward assessments. Thus, in some years there were no students who got 0.5% below the threshold value. Theoretically, this may attest to automatic ‘add-up’. At the same time, there are students in other years who got 0.5% under the ‘pass/not pass’ threshold, yet their number is significantly lower than what we could expect from the distribution curve. Krok 1 in 2016 does not even have the ‘jump’ in its distribution. This shows that different approaches were used to determine the final result (Table 1).
    Table 1. Share and number of correct answers in Krok 1 exam for various years
    Krok1-correct_answers
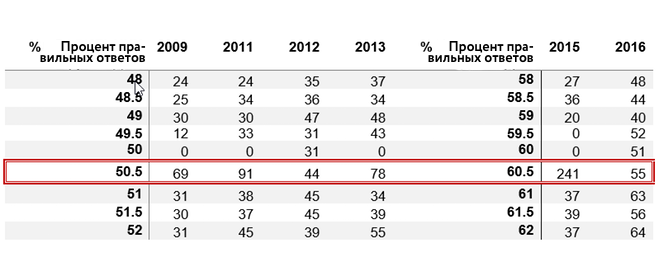
    Table 2. Share and number of correct answers in Krok 2 and Krok 3 exam for various years
    Krok2,3-correct_answers
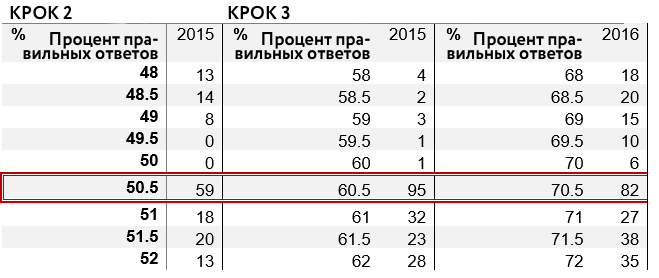
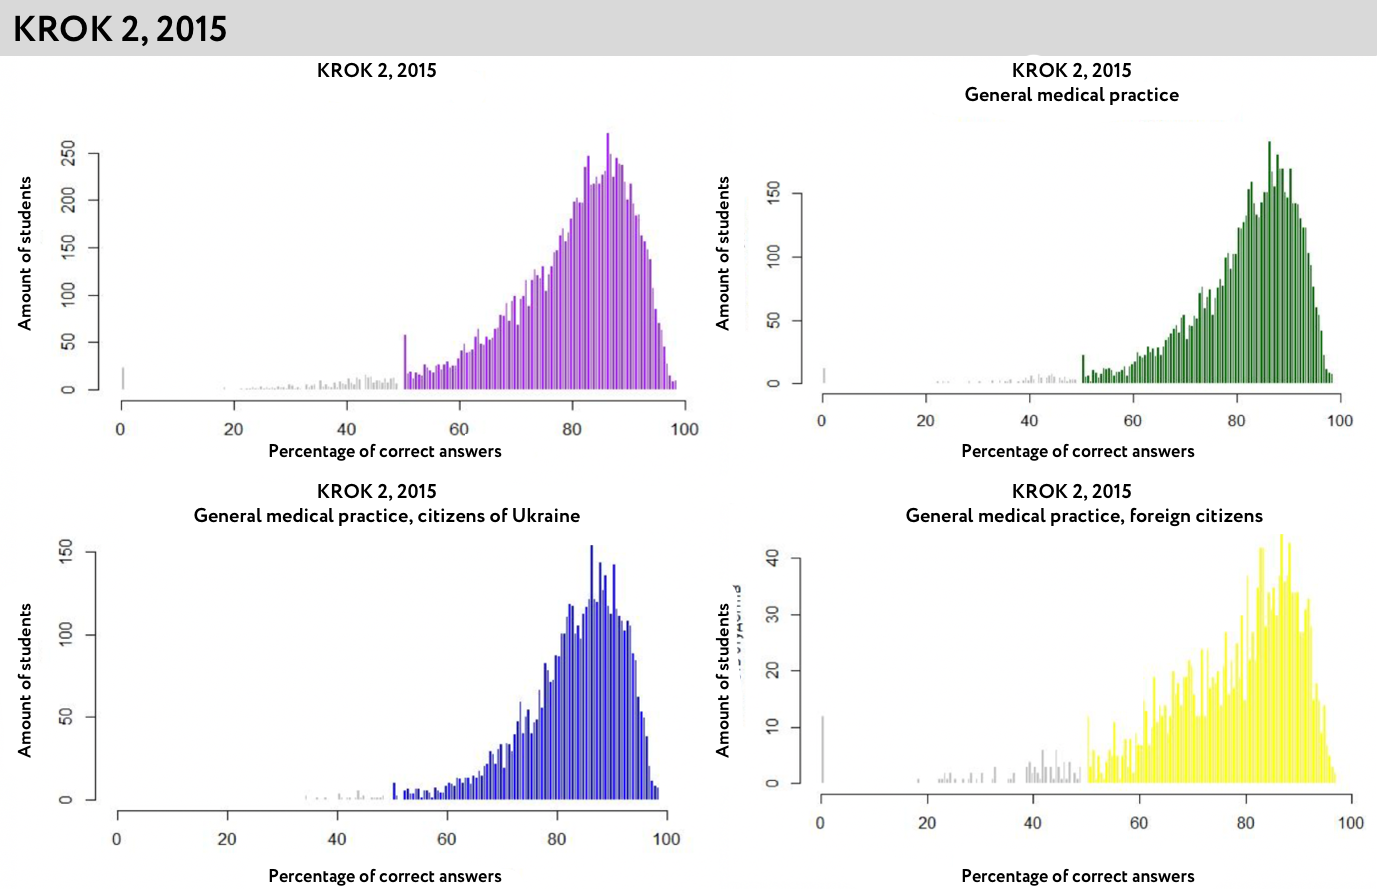
  4. Curve for Krok 2 results is significantly shifted toward the higher values, i.e. the school-leaving Krok 2 exam is notably easier than the Krok 1 exam. When comparing Krok 1, Krok 2 and Krok 3 results (Fig. 3) we can see the difference on visual inspection: a lot less students get results in the range between 50 and 75 as compared to the Krok 1 results. Simultaneously, a larger share of students got very high results.
Fig. 3. Result distribution for Krok 1, Krok 2, Krok 3 in 2015
Krok_test_2015

Such a distribution shows that the test is comparatively easier and most students reach the ‘pass/not pass’ threshold easily. In general, Krok 2 results show that a very small share of students get less points than what is required to reach the ‘pass/not pass’ threshold.

Table 3. Share of students who fail Krok exams, in % (according to the Testing Centre reports)
Year/Krok Krok 1 Krok 2 Krok 3
2012 14% 1% 8%
2013 9,9% 2,1% 3,7%
2014 13,1% 2,2% 6,1%
2015 15,01% 1% 6,87%
2016 11,7% 2% 8,2%
2017 18,4% 4,8% 32,2%
2018 19,1% н/д 27,8%

Since Krok 2 is taken during the final year of studies, the price of failure is a lot higher. A student who failed Krok 1 during the third year, continues with their studies and can retake the exam in the process. If a student fails Krok 2 during the sixth year, they cannot be awarded a diploma and need to postpone their studies in internship programme. Perhaps, the high price of failure causes formulation of such exam tasks which will not create problems for too many students.

How can such results be explained? The Testing Centre version

The results of previous analysis were sent to the Ministry of Healthcare of Ukraine to receive official explanation for such a distribution. In several letters, sent upon request of MoH, Testing Centre explained the deviation by the following:

(а) Sampling error correction
(1) After assessment of tests, an automated recalculation of the results is conducted using ‘acceptable methodology’. The results are further converted into ‘pass/not pass’ and multi-point licensed exam scale (MLE) with average grade of 200 points and standard deviation of 20.
(2) The results are ‘automatically recalculated’ to factor in ‘the sampling error’ for those persons who got a result below ‘pass/not pass’ threshold using a number below or equal to the sampling error value. This could, in theory, explain why there are no results 0.5 points below the ‘pass/not pass’ threshold.
(3) At the same time, in another part of the letter, the Testing Centre says that such a recalculation is made only for exams with ‘high stakes’, i.e. which cannot be retaken. Since only Krok 1 may be taken again, recalculation for this exam is only done ‘during force majeure circumstances’. The letter does not say who and under what circumstances decides whether ‘force majeure’ is at hand. The same information was published on the Testing Centre FB page on the day when MoH asked to provide answers to questions about Krok results. The Centre says that ‘recalculation of the result to factor in the sampling error for exams with ‘low stakes’ – exams that can be retaken or taken again, has been used by the Centre since 2018’ center
(4) Recalculation of Krok 1 results only under force majeure circumstances does not explain absence of results 0.5 points below the ‘pass/not pass’ threshold for most years before 2018.
(5) Testing Centre did not provide terms of reference for software development in 2009-2017: ‘No terms of reference were provided in 2009-2017 for STANDARD TEST software. Over that period software modification was conducted by staff employees within their job descriptions’. Thus, there is no way we can check how the result-determining software works.
(6) In response to the request to provide the methodology of results recalculation with sampling error that would explain data outliers, Testing Centre said that the effective methodology was approved by Testing Centre Order No. 13/1 dated February 06, 2017. The methodology that was used up till that moment, has not been provided.
(b) Crediting exam retake on the level of minimum threshold result
(1) Drastic increase of the number of people, whose result coincided with ‘pass/not pass’ threshold, may be explained by the fact that when students retake the exam and get a result that is higher than the threshold value, the result that is credited is the minimum threshold value. This norm is approved in the Procedure for Licensed Integrated Exams.
(2) The same Procedure stipulates that ‘Testing Centre has the right to conduct retakes of licensed exams on dates specified by the Centre, use different variants of tests, including those formed in test compilations for the previous years’. This means that when retaking the exam, the students in fact need to score the minimum number of points for a test that has already been administered and is available
(3) This norm may explain the rapid increase in the number of persons who get threshold value results but raises questions about the quality of such assessment. As a matter of fact, if students prepare for retake exams using tests that are already available, the results of such exam can hardly be taken as proof of their sufficient level of knowledge.

What does this mean?

Analysis of Krok exam for medical students showed outliers in result distribution. A rapid jump on ‘pass/not pass’ threshold is observed practically for all the years. Yet, there are differences: in some years there are no students who got 0.5 less that the threshold value, in other years the number of such students is smaller than could be expected if we look at the distribution curve. Since terms of reference for software development that calculates the results is not available, it is impossible to determine the reason for such results for sure.

Response of the Testing Centre shows that the decisions about assessment procedures were taken ad hoc, depending on the situation. Thus, the Centre could make decisions about force majeure circumstances as they saw fit and adjust the approach to the assessment. According to Testing Centre representatives, that was the procedure developed in 2015 for the displaced universities. At the same time, the very possibility of making such decisions demonstrates absence of a single established approach toward determining exam results and the possibility to change the approach toward internal decisions of the Testing Center. Additional evidence of this is absence of the terms of reference for software which is used to determine the results.

Yet, what is more important is how Krok exams can actually eliminate the less bright students. The analysis also shows that Krok 2 is easier in comparison with Krok 1, and it is failed by a very small percentage of students.

Even though Krok 1 is more complicated, when students retake it they use test compilations for the previous years so the fact that they take the test cannot guarantee proper assessment of their knowledge as medical students.

As a result, test architecture causes doubts as to their efficiency as a method of assessment. If Krok 1 can be retaken under simplified conditions and Krok 2 is intentionally made easier, does it mean that Krok exams are not efficient as preventive method to keep unqualified students away from medical profession.

What is next?

A year ago, upon initiative of the Ministry of Healthcare of Ukraine, a Decree was passed, which changes the system of student assessment completely. In addition to Krok exams, during the third year of studies, students will also pass English language test and IFOM – International Foundation of Medicine exam (basic disciplines) which is conducted by the National Board of Medical Examiners of the USA. This organization runs licensed exams for American doctors. During graduation year, in addition to Krok, the students will take IFOM (clinical disciplines) and an objective structured clinical exam that is aimed at checking the level of their practical skills.

On March 15 Ukrainian medical students will be passing International Foundations of Medicine Exam (IFOM) on the national scale for the first time. The results will not affect their grade but will give a chance to compare their knowledge with that of students from other countries.

Already a year ago, the possibility of giving up Krok exams was discussed. Finally, a decision was made to keep them but create preconditions for improvement of test quality, primarily via change of funding mechanisms. In particular, funds have been allocated to pay for the development of such tests. Apparently, approaches towards administration of exams should also be reviewed to guarantee transparency of procedures and approaches toward assessment.

APPENDIX

Chart of Krok results per specific years
(marked grey are the results below the mark ‘pass/not pass’, the other colour are the results that are higher than the threshold)

Ми віримо, що слова мають силу, а ідеї – визначний вплив. VoxUkraine об’єднує найкращих економістів та допомагає їм доносити ідеї до десятків тисяч співвітчизників. Контент VoxUkraine безкоштовний (і завжди буде безкоштовним), ми не продаємо рекламу та не займаємось лобізмом. Щоб проводити більше досліджень, створювати нові впливові проекти та публікувати багато якісних статей, нам потрібні розумні люди і гроші. Люди є! Підтримай VoxUkraine. Разом ми зробимо більше!