Proper road infrastructure (guardrails, roundabouts, traffic lights, raised pedestrian crossings, and similar measures) can significantly reduce the number of traffic accidents and associated injuries. But how can we determine where such improvements are most urgently needed? The traffic accident map presented in this article makes it possible to draw precisely such conclusions.

Every year in Ukraine, approximately 3,000 people are killed in traffic accidents, and about 30,000 are injured. From 1991 to 2024, 190,000 people lost their lives on the roads. Beyond the human tragedies, this is also a loss for the economy, since these people can no longer create added value in Ukraine. The good news is that over the past 15 years, the number of deaths in traffic accidents has declined (Figure 1). However, the number of deaths per million inhabitants remains significantly higher than in the EU—at around 100 people per year.
Figure 1. Number of traffic fatalities per year, Ukraine
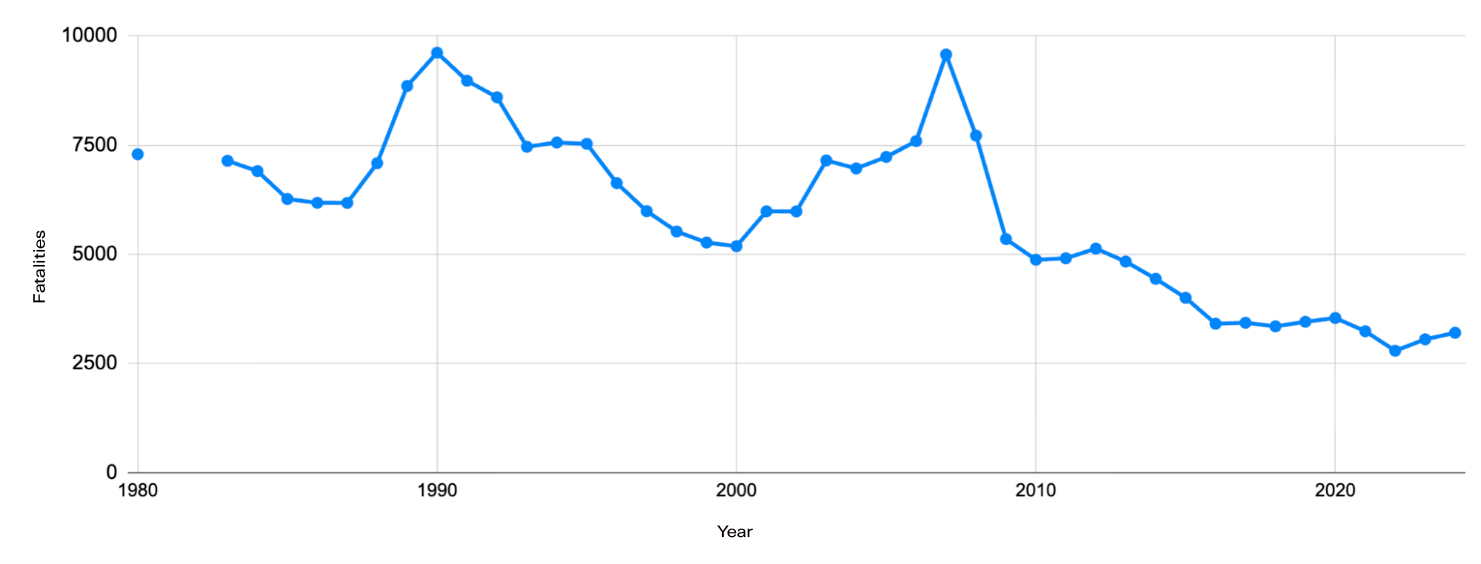
Source: State Statistics Service
In the EU, this indicator stood at a similar level in 2005, whereas by 2020 it had fallen to 42; in other words, by this metric, Ukraine trails Europe by roughly twenty years. The leader in Europe is Norway, where in 2020 there were 17 deaths from traffic accidents per million inhabitants (Figure 2).
Figure 2. Number of traffic deaths per million inhabitants in the EU, 2020
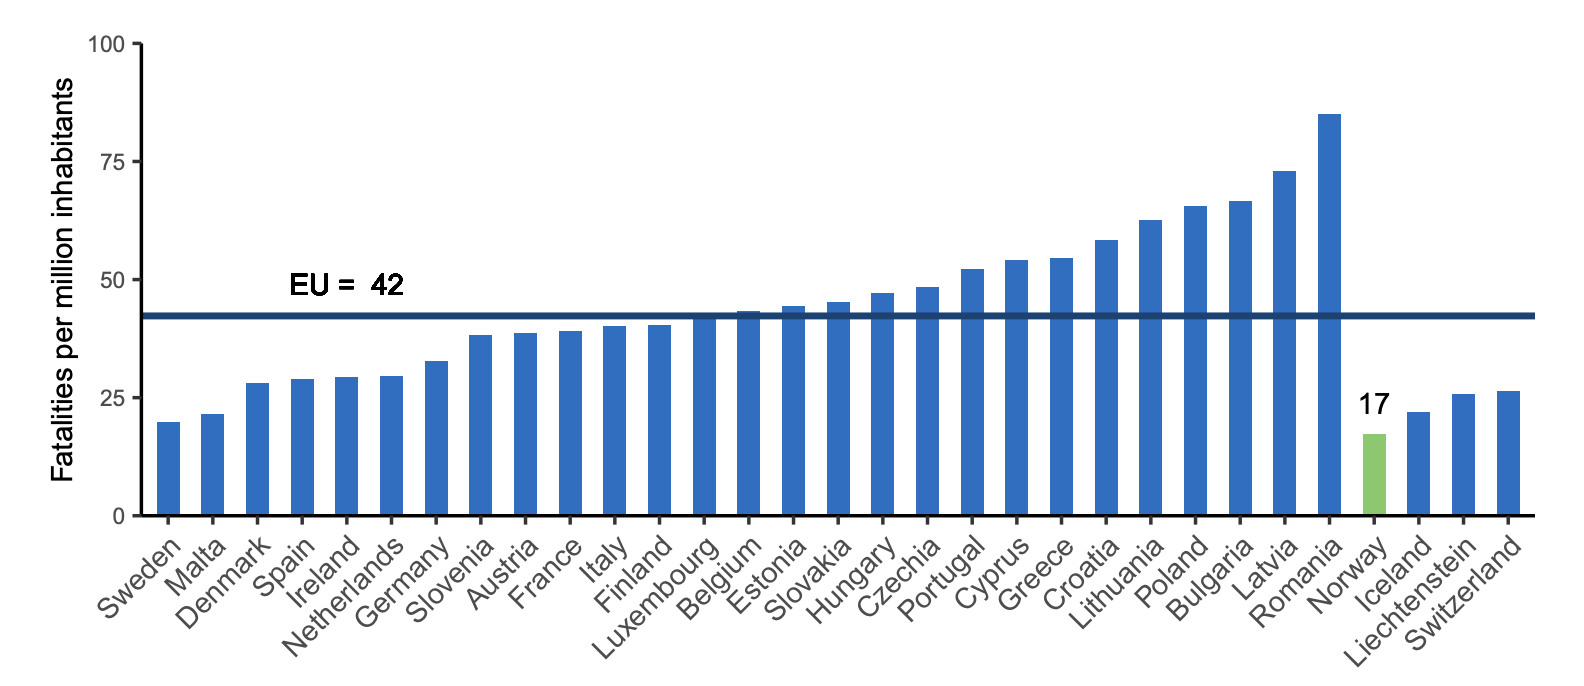
Figure 3. Number of road traffic deaths per million population, Norway, the EU, and Ukraine, 2000–2020
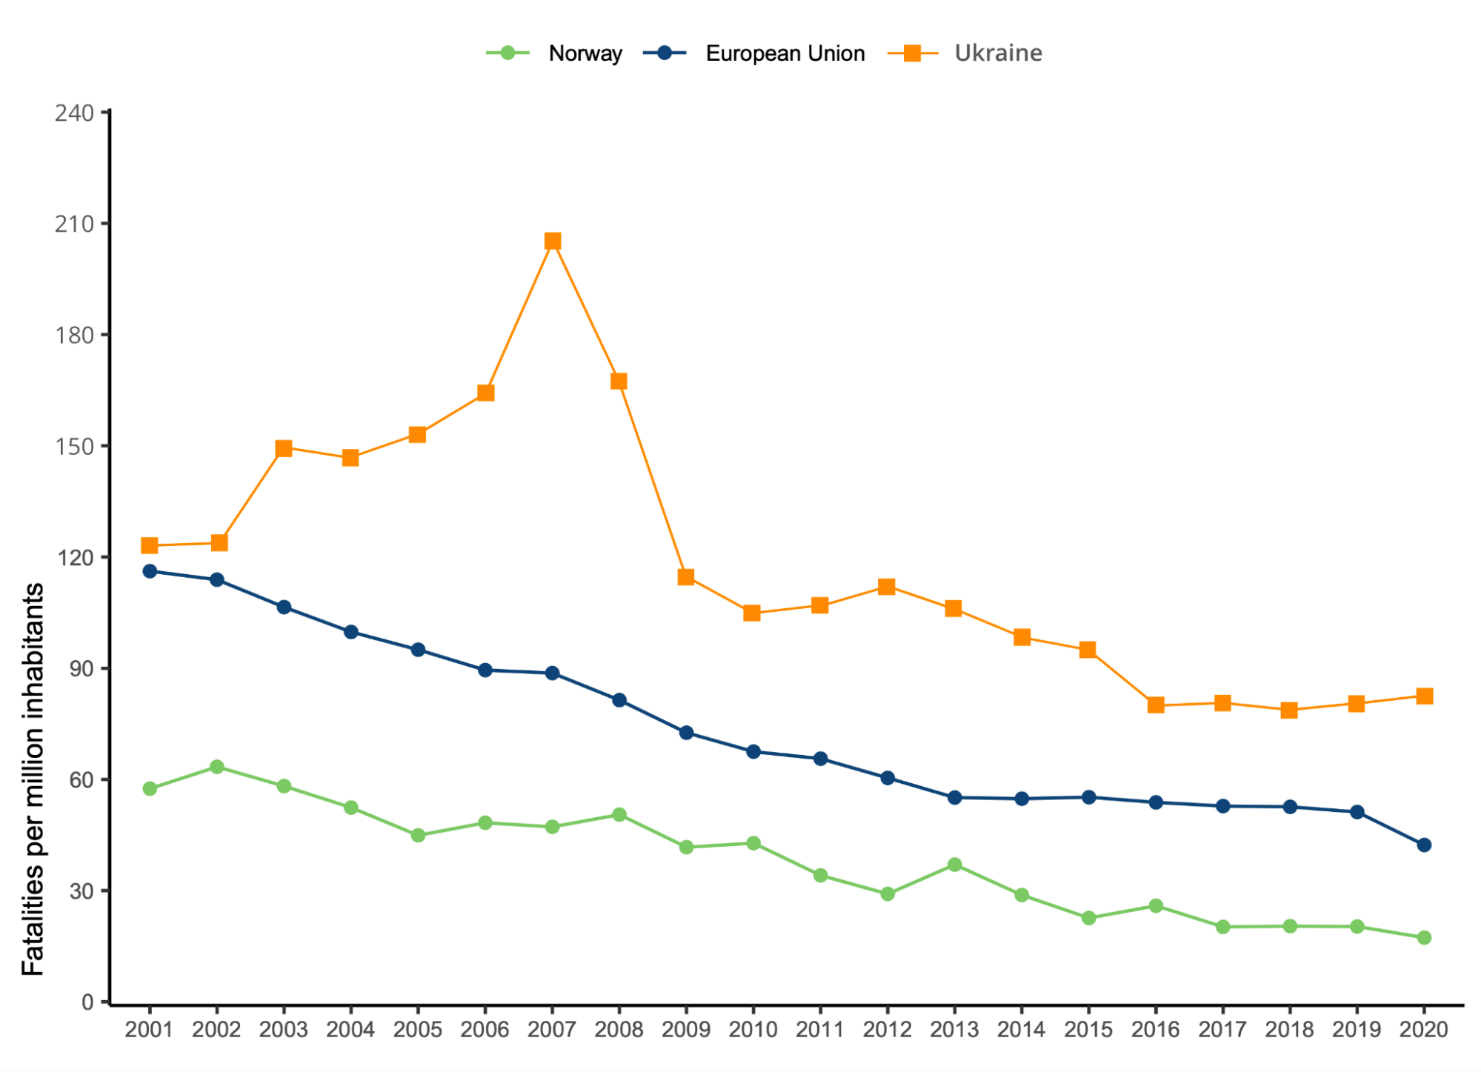
Source: Road Safety, State Statistics Service, author’s calculations
It is worth noting that since 2014, the State Statistics Service of Ukraine has reported population figures excluding Crimea but including the Donetsk and Luhansk regions. This means that the actual mortality rates in the government-controlled territory may in fact be higher.
Research shows that proper road infrastructure can significantly reduce traffic accidents. However, which types of infrastructure should be built first—and where? To answer this question, high-quality data are needed on where traffic accidents occur and what kinds of accidents they are. Unfortunately, such data are not available for the entire country; however, data for Lviv have been available since 2017.
Based on these data, I have created an interactive traffic accident map that makes it possible to identify the most dangerous locations. I urge other cities to publish similar data as well—or, better yet, to do so at the national level.
The interactive traffic accident map is a tool that makes it possible to see each crash at the exact location where it occurred. The data can be filtered by injury severity and accident type. It also allows users to view the distribution of traffic accidents by hour, week, year, and cause. The map helps identify which streets are safe, which require particular caution, and—most importantly—which streets should be prioritized for changes to road infrastructure in order to prevent deaths and injuries on the roads. The map will be useful both to city authorities and as an additional argument for residents who submit petitions to the authorities calling for improvements in road infrastructure. Below are several examples of data and visualizations that can be obtained using the map. I invite everyone to analyze these data independently.
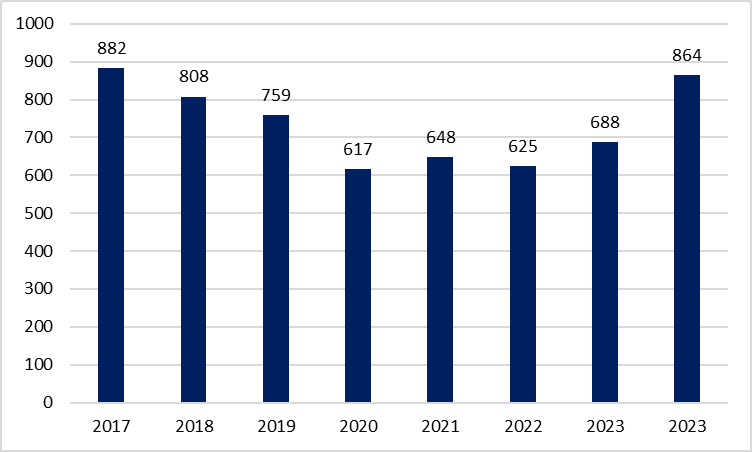
For example, Figure 4 shows that until 2020 the number of traffic accidents was declining, but then began to rise in 2023.
Figure 4. Number of all types of traffic accidents in Lviv by year
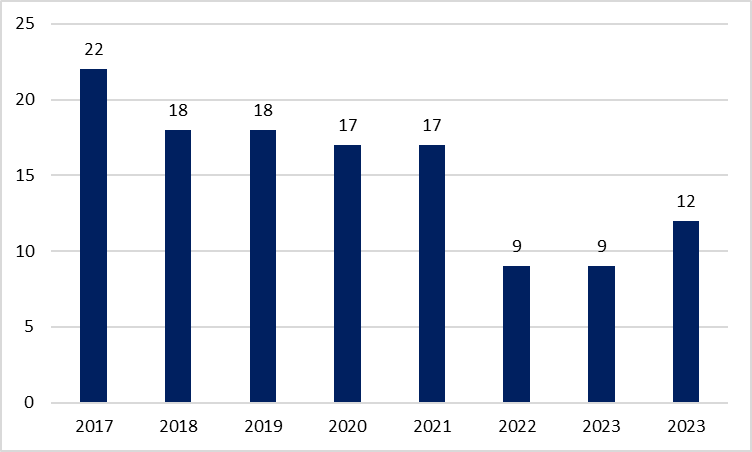
At the same time, the number of severe traffic accidents has declined significantly since 2017, despite a spike in 2022 (Figure 5). The number of fatal traffic accidents has also declined (Figure 6).
Figure 5. Number of severe traffic accidents in Lviv by year
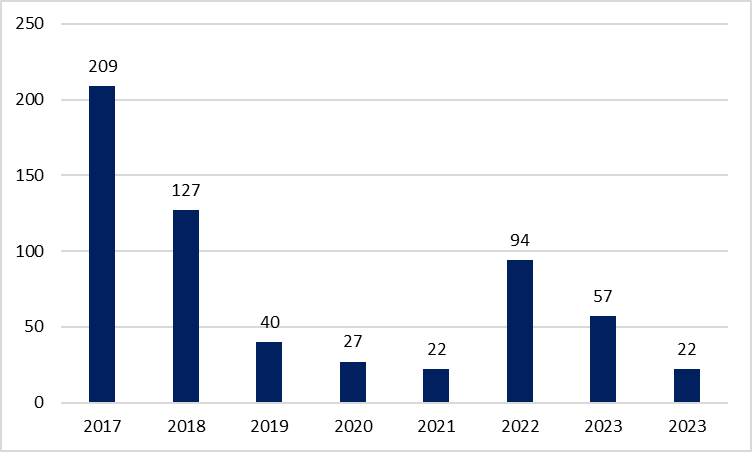
Figure 6. Number of fatal traffic accidents in Lviv by year
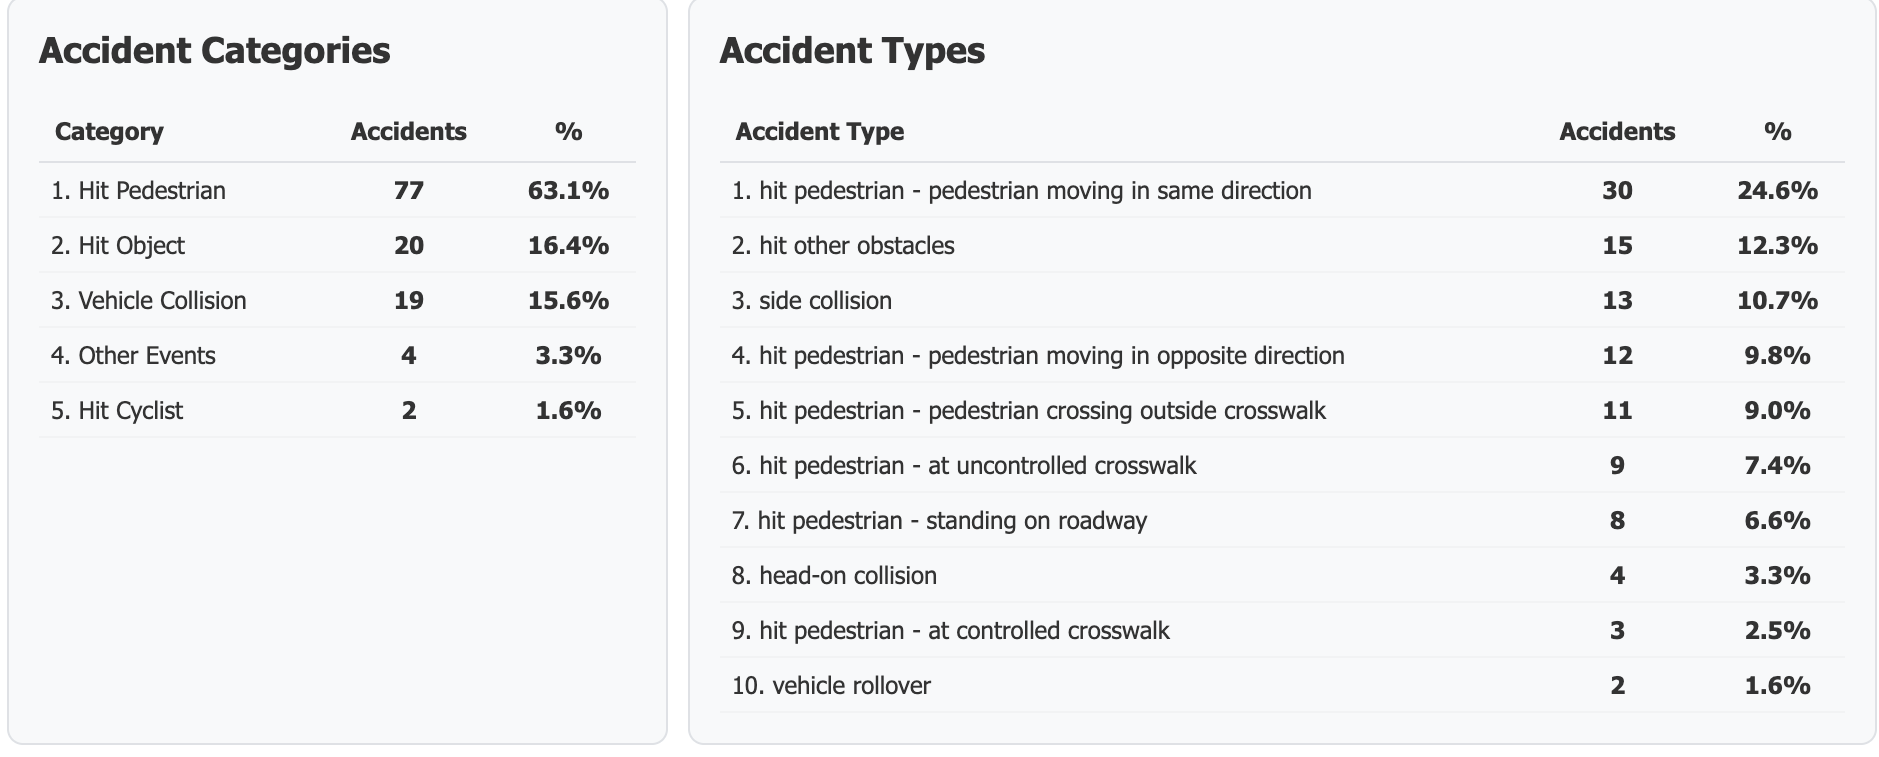
Over eight years, 122 people were killed on the roads of Lviv. Most fatal traffic accidents in Lviv (63%) involve collisions with pedestrians. Of these, in 24.6% of cases the pedestrian was moving in the same direction as traffic, and in 9.8% in the opposite direction. At first glance, walking in the opposite direction appears safer, as taught in school. However, we do not know how many people walk in each direction.
Figure 7. Types of fatal traffic accidents in Lviv, 2017–2024
The top 10 causes of fatal traffic accidents can be divided into those in which the driver could have prevented the crash and those in which the pedestrian could have done so. In 85% (96/113) of cases, the accident was attributable to driver actions (Figure 9), but all road users should remain attentive.
In addition to the behavior of road users, it is also important how safely streets are designed and equipped—how well they reduce both the likelihood and the consequences of errors by drivers and pedestrians. For example, a narrowed section of a street where it is difficult to accelerate reduces the risk of a fatal traffic accident. Well-designed pedestrian crossings in convenient locations reduce the frequency of road crossings in unauthorized places. The presence of a sidewalk eliminates the need to walk along the roadway. Clear road markings reduce the likelihood of “improper maneuvering.” These are examples of approaches and infrastructure that can make a city safer.
Figure 8. Causes of fatal traffic accidents in Lviv, 2017–2024

For example, in 2019, dedicated public transport lanes, bicycle lanes, and safety islands at pedestrian crossings were added on Viacheslav Chornovil Avenue in Lviv. As a result, the number of fatal and severe traffic accidents fell from 9 in 2018 to 3 in 2019 (Figure 9).
Figure 9. Chornovil Avenue in Lviv

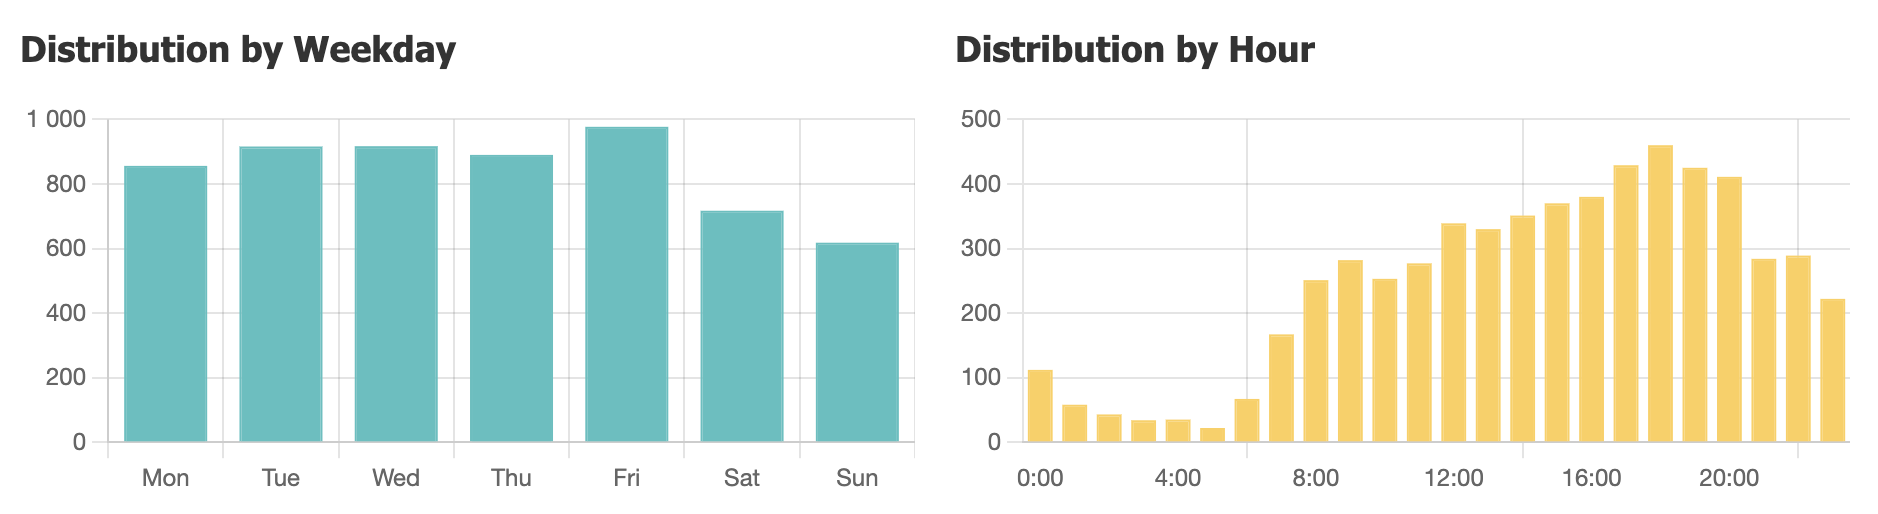
The map shows that fewer accidents occur on weekends, and that the most “dangerous” time is 6 p.m. (Figure 10). Clearly, the more traffic there is on the streets, the greater the likelihood of crashes. However, the data also show that more accidents occur during the evening rush hour than in the morning—likely due to lower visibility in the fall–winter period and driver fatigue.
Figure 10. Distribution of traffic accidents in Lviv by day of week and hour (2017–2024)
Summary
Openness is the first step toward safety. As long as data are hidden away in reports, we cannot see the full picture. But when that picture is right in front of us, both awareness and behavior change. This map will not, by itself, solve the problem of traffic accidents. But perhaps it will help us notice what we have grown used to overlooking. And if someone, after viewing it, becomes more cautious—then it has served its purpose.
The interactive map is another step toward improving road safety. The data it brings together make it possible to identify appropriate solutions. We call on communities to publish relevant data, and on individual enthusiasts and institutions to analyze them and develop solutions for road infrastructure. Together, we can prevent many deaths on the roads.
The author will help anyone interested in creating a similar interactive map for their city. Please contact [email protected].

Attention
The author doesn`t work for, consult to, own shares in or receive funding from any company or organization that would benefit from this article, and have no relevant affiliations