Rankings and comparisons based on international composite indicators have become extremely popular. However, if poorly constructed or misinterpreted, they can send misleading policy messages. This post examines methodological pitfalls in three renowned composite indicators of labour market regulations, and in rankings based on them. It argues that justifying reforms with the aim of improving Ukraine’s position in aggregate rankings should be done with great caution, and best simply avoided.
Why do we care about rankings?
It has become a big fashion, if not a must, to refer to various indices and international rankings when assessing how Ukraine compares to other countries. How does Ukraine fare according to the World Bank Doing Business Indicators? Or Global Competitiveness Index of the World Economic Forum? Or Heritage Foundation Index of Economic Freedom?
Rankings are so attractive because they give a quick and easy recipe for reforms, and a promise for success. In a world of unlimited information and limited patience to dig through it, various indicators became a major tool for summarizing complex reality and describing it by means of few, sometimes just one, number. They are often easier to interpret and compare across countries and over time than a battery of separate indicators. Businesses rank countries in order to assess their investment attractiveness. Academic researchers love cross-country time-series parsimonious data. Governments wish to benchmark best practices and justify the need for reforms.
Recently, a group of renowned Ukrainian analysts and politicians seriously discussed Ukraine’s rankings according to different indices in a workshop organized by Vox Ukraine and Ukraine Crisis Media Centre. At this workshop, a representative of the Ministry of Economic Development and Trade of Ukraine explained that the Ministry works at improving the rating of Ukraine in Doing Business Indicators, and even created a “deregulatory office” which elaborated a road-map for the Cabinet of Ministers and the Parliament as to which reforms need to be undertaken. Recent VOX Ukraine posts also discussed the necessity and urgency of some reforms. For example, using Heritage Foundation index, Nataliia Ostapenko suggested that
One thing is clear– labour market regulation should be considerably liberalized.
Using Global Competitiveness Index, Nataliia Shapoval and Olena Nizalova also stressed that
To get closer to the successful economies – like Hong Kong, Singapore, United Kingdom, or United States – Ukraine has to speed up its work on the Labor Code.
While the goal of this post is not to question the proposed reforms, some of which may be perfectly legitimate, its goal is to show that, if poorly constructed or misinterpreted, composite indicators can send misleading policy messages and lead to simplistic – if not altogether wrong – conclusions.
Do different indicators measuring similar phenomenon provide similar picture?
In order to assess how well rankings do their job, in a recent paper, my co-author Sandrine Cazes and I decided to put to scrutiny three major composite labour market indicators and rankings based on them – the World Economic Forum (WEF) Labor Market Efficiency composite indicator, the Fraser Institute Labor Market Regulations index, and the IMD labour regulations components. These indicators are used to rank countries on efficiency and freedom of labour regulations. We chose these indicators both because these indicators have been widely used in research and policy debate, and because they measure a relatively similar phenomenon – i.e., labour regulations. These indicators also constitute parts of broader indices produced by these think-tanks – World Economic Forum (WEF) Global Competitiveness Index, Fraser Institute Economic Freedom of the World Index, and IMD World Competitiveness Index, each of which ranks countries on the degree of competitiveness and economic freedom that they have. The Heritage Foundation index in the area of labor regulations, which we did not formally examine, is comparable to Fraser and WEF. Some former sub-indicators of the World Bank Doing Business Indicators are used as part of the three indices that we consider.
We first looked at the degree of correlation between Fraser, IMD, and WEF labour market regulation composite sub-indices and their various ingredients, only to find that they can be as low as 0,01; and at best as high as 0,7. We then assessed whether these indices provide similar country rankings within the same sample of countries. We found that IMD and WEF give the same rank only to one country. Nine of the IMD “top 20” countries are not among “top 20” Fraser countries at all; five are out of the “top 20” WEF ranking. As to Ukraine, in 2009, it occupied place 33 according to the IMD ranking, 58 according to Fraser, and 84 according to WEF. Lastly, we looked at the correlations between these indicators and the phenomena they are supposed to influence, such as the “health” of the labour markets. We found that any direction of correlation is possible between these indicators and total unemployment or long-term unemployment (Figures 1-2), depending on the indicator you choose.
Figure 1. Correlations between labour market regulation sub-indices and total unemployment rate, 2009
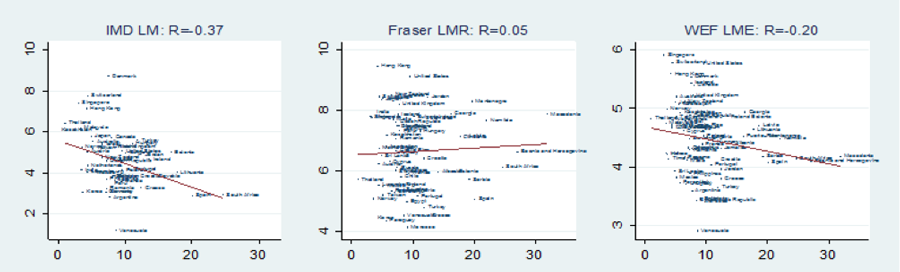
Source: Aleksynska, M., and Cazes, S., 2016. Composite indicators of labour market regulations in a comparative perspective. IZA Journal of Labor Economics, Vol. 5(3). DOI: 10.1186/s40172-016-0043-y.
Figure 2. Correlations between labour market regulation sub-indices and long-term unemployment rate, 2009
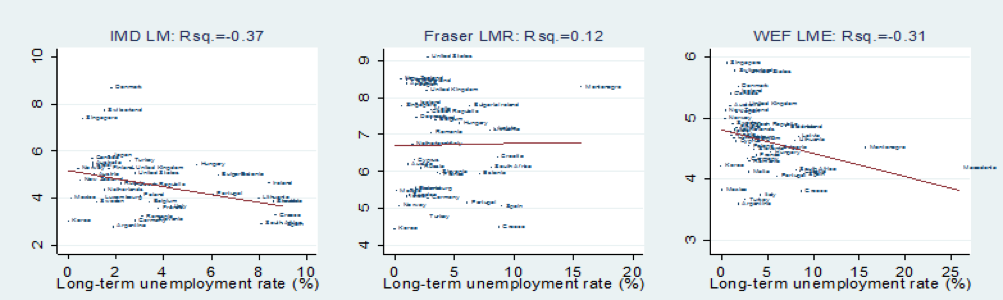
Source: Aleksynska, M., and Cazes, S., 2016. Composite indicators of labour market regulations in a comparative perspective. IZA Journal of Labor Economics, Vol. 5(3). DOI: 10.1186/s40172-016-0043-y.
Very clearly, each composite indicator supposedly measuring the same, or similar, phenomena, provides a different outlook of labour market regulations. Thus, the policy advice you are going to give depends – and can be manipulated by – the choice of the indicator on which this advice will be based.
What are the problems with indicators and rankings?
There are several reasons why three composite indicators that we compared give such a different outlook of labour regulations.
To start with, despite intending to measure seemingly the same labour market regulatory environment, these indicators include different baseline components. The data on some of these components are collected by the think-tanks producing each index, and the data on some others come from external sources, sometimes with important time lags. Nevertheless, there is a significant overlap between baseline components of the three composite indicators. They all use, partly or fully, World Bank Employing Workers sub- indicators that used to be part of the World Bank Doing Business indicators. The problem, however, is that Fraser, WEF, and IMD use those World Bank Employing Workers sub- indicators that they like, without justification of the choice, and in addition, from one year to another, they change the components they pick. The lack of the theoretical background or sound analytical approach for the choice of specific components compromises the indicators’ comprehensiveness.
All three composite indicators contain subcomponents based on opinion surveys. Such questions can only be valuable when they are properly phrased, but this is not always the case. For example, the IMD Labor relations question asks: “Labor regulations (hiring and firing practices, minimum wages etc.) … 1 = are not flexible enough, 6 = are flexible enough”. The questions seems to cover too many issues which may be contradictory: some countries may have flexible firing and hiring practices but inflexible minimum wages, either in their level, setting, or degree of formality. It is thus not clear what aspect of labour regulations the response actually reflects. In addition, the opinion surveys are conducted only among businesses, but not workers, labour lawyers, labour researchers, or civil society, thus potentially biasing the responses towards one group of the society. Moreover, even within surveyed firms, there are important doubts that the firms and the personnel that answered the questions are representative. For example, IMD surveys are conducted mainly among international companies, and among IMD alumni. However, firms with an international exposure usually have labour practices different from the rest of the economy; they cover mostly formal sector; and the business executives of such companies – especially non-nationals – may have their own priors as to the functioning of labour markets. Thus, there are doubts that rankings based on opinion surveys are complete and representative.
Interestingly, there is also a significant variation of components not only across, but also within the indicators, both in terms of their number, type, or changing definition of the same component over time. Since 2001, Fraser indicator underwent four changes in the number and type of included components, and also numerous additional changes in the definitions and data sources of these components. Since 2004, the WEF indicator underwent six changes in the number and types of included components. Each year, WEF tracks changes in the country rankings, showing the “progress” of countries towards competitiveness, or away from it. It does, so, however, without taking into account changes in the components. To see why this may be problematic, consider France, which, between 2011 and 2012, experienced an upward change in the aggregate LME index (Table 1, column 1). However, it experienced a downward change in seven out of ten individual components constituting this index (columns 2-8). The change in the eighth component (column 9) is too small to imply significant changes in the aggregate indicator. The ninth component (column 10) was dropped between the two years, which means that this methodological change should have driven the aggregate index further down, and not up. The tenth component – Redundancy Cost (column 11) – is the only component that significantly drives the change in the aggregate index upwards, outweighing and offsetting the opposite-direction change of seven sub-components. However, as we show in our paper, this change happened exclusively because of the change in this component’s definition, while no actual change or reform of the redundancy cost in France took place in that year. By the way, this specific component was borrowed from the World Bank Doing Business database.
Table 1. Evolution of the aggregate LME indicator and of its underlying components. Example of France
| LME | Co-operation | Flexi-bility | Hiring and Firing | Tax | Pay and Productivity | Management | Brain Drain | Female LFP | Rigidity of employ-ment | Redundancy | |
| (1) | (2) | (3) | (4) | (5) | (6) | (7) | (8) | (9) | (10) | (11) | |
| 2012 | 4.41 | 3.3 | 5.1 | 2.5 | 2.8 | 3.9 | 5.0 | 3.7 | 0.88 | . | 12 |
| 2011 | 4.38 | 3.4 | 5.2 | 2.7 | 2.8 | 4.1 | 5.1 | 4 | 0.87 | 52 | 32 |
Note:
- For rigidity of employment, only hard data are reported by WEF. To calculate the aggregate index, these data are converted (though not reported) by WEF using min-max formula. According to our computation, the min-max converted score is 5.5 in 2011. Higher values of this sub-component translate in lower values of the aggregate indicator.
Source: WEF Reports, 2011, 2012.
This and other regular changes in components compromise the use of the aggregate data, and also of some individual sub-components, for time-series analysis. They also mean that comparing aggregate rankings over time – and how a country such as Ukraine moves along the ranking from one year to another – is meaningless. It is simply impossible to judge whether countries move in the rankings because of the genuine changes in the underlying components or because of the changes of the components.
The last problematic issue is the aggregation schemes, in other words, how baseline components are assembled together to form a composite indicator. WEF and Fraser simply average the data, while IMD implements weighted average, giving higher weights to hard data as compared to survey data. The problem with such aggregations is three-fold.
First, WEF, IMD, and Fraser average the “de facto” data, such as survey questions on the flexibility of regulations, with “de jure” information, such as weeks of advance notice and severance pay, also adding in some instances “hard” statistical data, such as female-to-male employment rates. Simple averaging does not allow to account for possible interrelationships between these types of information, and neither for the fact that some of the variables reflect outcomes (outputs) of the underlying processes measured by other variables (inputs) with which they are averaged.
Second, within some composite indicators, there is a significant repetitiveness of baseline components measuring the same phenomenon. For example, in Fraser composite labour market indicator, hiring and firing regulations are measured in various ways by three out of six underlying components. At the same time, arguably other important aspects of labour regulation, such as, for example, the existence of unemployment insurance, are not measured at all. Repetitiveness of questions means that simple averaging biases the aggregated indicator in the direction of these over-represented concepts.
Third, Fraser composite indicator is computed as a simple ad hoc average of components according to data availability. So for example, if for one country, data are missing on one underlying component, but not on the remaining five, Fraser will report the average of five components for that country. It will report the average of six components for any other country with non-missing information. Even more problematic, data on one of the six sub-components are simply missing for all countries prior to 2002. That is, the composite index for 2002 and onwards is based on six components, while the composite index for 2001 and earlier is based on five components. Clearly, some of the overall ranking results are thus driven by data availability and by the values of available components, not by the genuine reforms that countries undertook.
Given deficiencies in aggregation schemes, one has to be very careful with rankings based on composite indicators. Comparing changes in rankings over time are best to be avoided. But even within the same year, it is most preferable to work with individual sub-components, however numerous they are, rather than with aggregate indicators.
From labour market to aggregate country rankings
The comparative exercise that we performed concerned only labour market regulation composite indicators. These indicators, however, feed the aggregate freedom and competitiveness indices, meaning that the identified problems are carried over to the global aggregate indices, too. Moreover, most probably, other sub-indicators forming global aggregate indices feature some similar problems, especially in what concerns aggregation schemes. Given this, one has to be very careful with global aggregate rankings, and know perfectly what data and methodology are behind them. In other words, using these data at own risk and always with a grain of salt, but not to justify reforms.

Attention
The author doesn`t work for, consult to, own shares in or receive funding from any company or organization that would benefit from this article, and have no relevant affiliations