Most of these owners live in rural areas and are of old age. Discussions about lifting the moratorium and its future design are still ongoing and there is a growing political support to remove the moratorium. Indeed the new President of Ukraine ordered the Government and the Parliament to approve land reform this year by the 1st of December and the Prime Minister of Ukraine Oleksiy Honcharuk announced that the land market will be opened as of October 1st, 2020.
Per se the moratorium on land sales is one of the extreme examples of tradability restrictions, and unlike other types of restrictions, empirical evidence on the impact of moratorium is virtually non-existent in the empirical literature (see Nivievskyi et al 2016). In Ukraine one also may come across of plenty qualitative discussions and opinions about moratorium, but empirical evidence is clearly lacking. To the best of our knowledge, there are only two studies that produced empirical estimates of the expected effect of lifting the moratorium.
The UIF (2017) report “Moratorium on land: the extent of losses for the Ukrainian economy” forecasts average annual nominal GDP growth of 6-7% upon lifting the moratorium. The study evaluates two scenarios. In both scenarios land ownership per beneficiary is limited to 500 ha, whereas in the Scenario 1 foreigners are excluded from the market, while in the Scenario 2 they are allowed to buy land along with Ukraine’s citizens. Unfortunately, the details of the calculations are not publicly disclosed so it is difficult to assess the overall quality and validity of the study.
Easybusiness (2019) report “Life After: Key aspects of land market opening” expects that lifting the moratorium on land sale in Ukraine will generate additional 14 to 85 bn USD of GDP over the next 10 years under different scenarios compared to the status-quo or continued moratorium scenario. The scenarios differ by degree of land market regulation and access of foreigners. Under the most liberal scenario without regulations and with the access of foreigners, average farmland sales price is expected at USD 5 640/ha and the effect on GDP will be additional USD 85 bn over the next 10 years, – almost 70% increase compared to 124 bn GDP in 2018. This in turn implies additional annual GDP growth of 5.4 p.p., – result very similar to the UIF (2017) report mentioned above. But like with the UIF report, the Easybusiness did not disclose the details of the model and resulting calculations so it is difficult to judge on the quality and validity of the resulting numbers.
In this paper we provide the ex-ante estimates of the moratorium impact using a classical partial equilibrium analysis. Specifically, we look at various scenarios of the future farmland market design and estimate how the incomes of various stakeholders (i.e. agricultural producers and farmland owners) would change.
Economic Analysis and Approach
Quantification of Welfare Effects – changes in agricultural value added
Lifting the moratorium is expected to trigger structural changes on the farmland lease and sales markets that will result in income gains and losses to different stakeholder groups. First of all, through the sales and lease transactions, farmland market sorts out more efficient from less efficient farms thus increasing the overall sector value added. There are other important farmland sales market functions, including increasing agricultural productivity through making farmland available as a collateral. Below, however, we will be modelling income gains and losses resulting from reallocating the land from less to more efficient landowner/producer.
Moratorium or Base Scenario
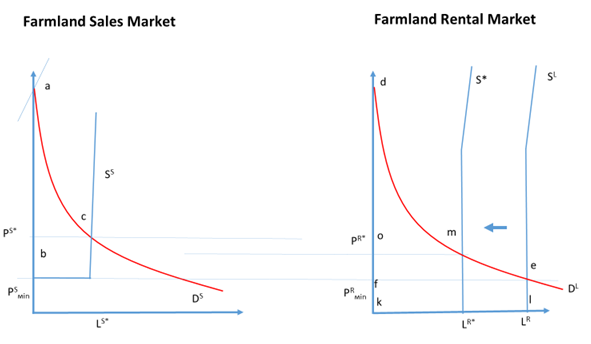
Under the moratorium scenario, transactions on the land sales market are essentially zero and corresponding deadweight losses are equal to the area abc in Figure 1. PS* – equilibrium price that would exist on a land sales market and the assumed land supply is very inelastic at equilibrium. We assume that the land will not be sold for less than the capitalized rental price which is essentially an opportunity cost for the land owners. That is why in our modelling exercise we assume the land sales supply curve having a right angle shape, i.e. it is perfectly elastic in the beginning and gets very inelastic as we reach equilibrium. Transition from elastic to inelastic parts of the farmland supply curve could be more smooth, but for simplicity of modelling we assume an abrupt change in the land owners’ behavior. This is also implicitly shown in the surveys whereby a large group of landowners report they would be willing to sell their land plots immediately after lifting moratorium.
On the land lease market PRміn is the equilibrium price under the moratorium. Rental land supply LR is inelastic due to lack of alternatives for landowners (and a corresponding rental price is PRміn). Producers surplus is equal to the area dfe, while landowners’ surplus is felk. The entire area under the rental land demand curve is nothing else than the short-run value added generated in agriculture on the rental farmland, for the demand curve is constructed from the farms’ gross margins. The same applies to the farmland sales market. The entire area under the demand curve makes up the long-term value added generated in agriculture on the sales farmland, for the sales market takes into account expectations towards long-term profitability of agriculture.
Figure 1 Welfare Effect of Lifting Land Sales Moratorium
Lifting the Moratorium and modelling various restrictions on farmland sales market
Farmland sales restrictions could be broadly grouped into the two main groups, i.e. (1) limits on tradability of land and (2) ownership ceilings. Such a grouping is common from international point of view (Deininger and Feder, 1998). Tradability restrictions might include a moratorium on land sales (extreme example of restriction), restrictions on the purchase of land by foreigners, restrictions on land sales to ensure continued agricultural use, pre-emptive rights to purchase land parcels, taxes on early land sales, transfer taxes, State Land Fund/Authorization of Land Sales Transactions. Land ceilings include mainly maximum and minimum landholding and ownership size restrictions.
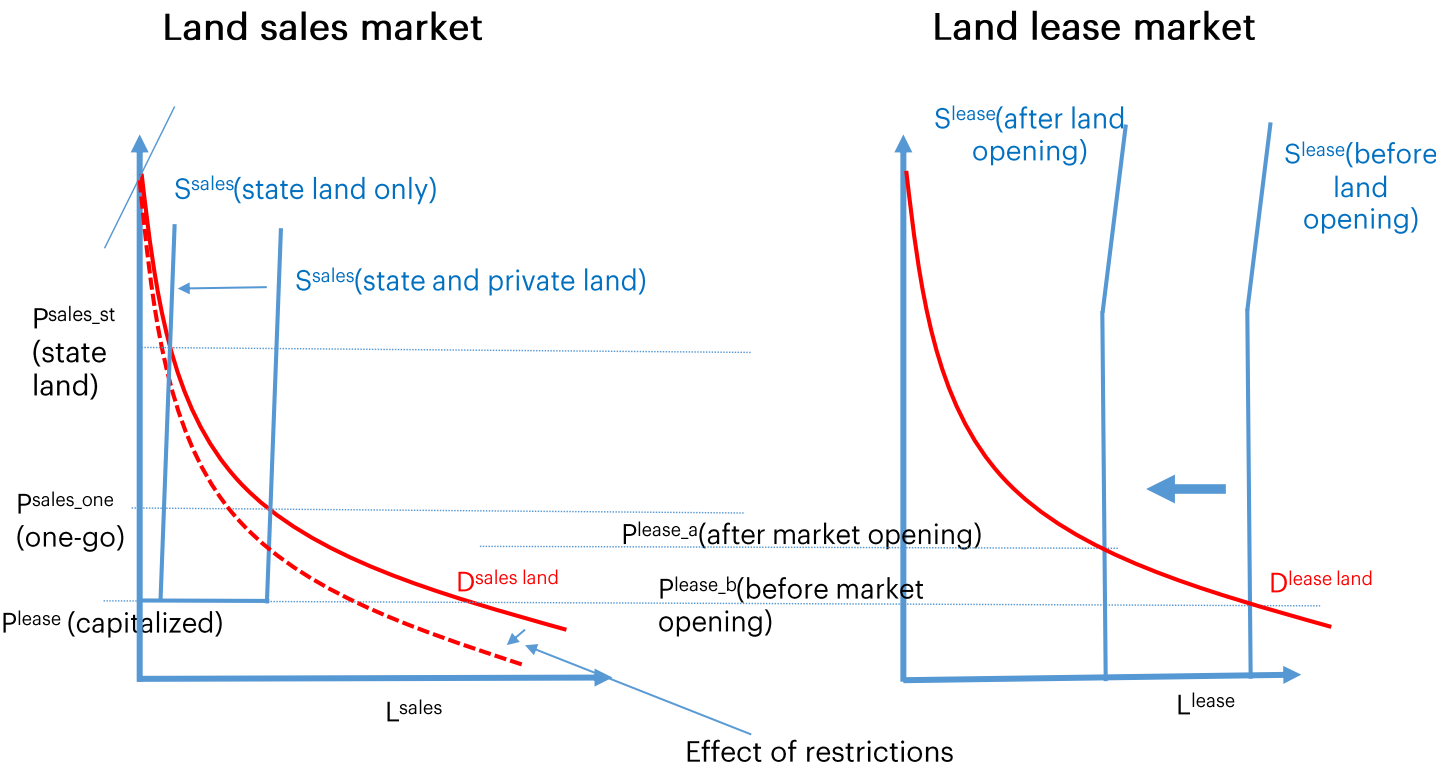
While this modelling framework can be used to simulate any number of scenarios, so far we are focusing on the following set of restrictions. Generally speaking more stringent restrictions (less access to foreigners, lower land ceilings etc) or limited access of small-farmers to credits imply reduced demand for farmland which is reflected in a downward shift of the land sales demand in Figure 2.
One or two-step market opening
There were suggestions to precede opening of markets for private land with a first phase where only state land would be sold to help with price discovery. Based on official data regarding state land availability, we assume 2 mn ha of state land to be available for potential sale in the first phase of land market opening, Ssales (state only) supply schedule on Figure 2. A corresponding price will be substantially higher, for a limited amount of farmland has to be matched with relatively high demand for the state land.
An alternative is the land market opening in one go, whereby 0.3 mln ha of state land will be on top of the private land supply. The expected supply of private land is 2.3 mln ha of farmland. This estimate is based on the survey of land owners commissioned by the USAID Project Agroinvest in 2015, whereby about 8% of land owners would like to sell their land within the first two years of market opening. Another 3% of the owners would consider selling their land over a longer period of time (see the details in Deininger et al, 2017).
Land ceilings
Limits on the amount of land that can be acquired by physical persons or legal entities (including a possible total ban on agricultural land ownership) to prevent undesirable land accumulation. In the analysis we assume that individual farms (mainly small farms up to 100 ha) will be able to buy the land also as physical persons, should only physical persons be allowed to buy the land. In this case the effective land ceiling for the legal entities is zero. In any case, more stringent land ceilings onto the physical and/or legal entities implies reduced demand which is reflected in a downward shift of the land sales demand curve in Figure 2, i.e. less farmland will be demanded.
Allowing participation of foreigners
A restriction on land ownership by foreign individuals or companies has been part of most legislative proposals for lifting the moratorium. In this modelling framework, we allow only legal entities to buy the land. We assume that foreigners currently own 20%, 10%, and 5% of the farms above 10,000, 2,000, and 500 ha and that restrictions on foreign market participation can be enforced. Similar to the land ceilings restriction above, restricting foreigners from owning the farmland implies reduced demand for farmland which is reflected in a downward shift of the land sales demand schedule in Figure 2.
Focus on small farmers’ support – simulating their access to finance
Economic literature shows that smallholders have hard times using farmland sales markets to access land, and their situation does not improve as the farmland sales market develops. This is also the case for Ukraine with its imperfect credit market. Characteristics of the agricultural sector lead to information problems (lack of bank-friendly financial reporting originated in the simplified system of taxation and reporting for agricultural sector, lack of credit history) that make access to credit difficult, especially for small farmers. While the use of land as collateral for loans is common to overcome these, the land sales moratorium made this impossible, so that small producers could not access credit for working capital or investment putting them on a strategic disadvantage compared to larger ones. Even if land can be used as collateral, a large part of the transaction costs of providing credit is fixed. Thus, even if they have credit-worthy projects, small farmers may have difficulty accessing credit. And hence support to level the playing field for them may have positive impact on productivity.
As mentioned above, we assume that land will be purchased by those who can afford it (i.e. can finance it through the credit) and we also assume that credit is available only to those cultivating more than 500 ha. Government could establish a credit guarantee facility (e.g. Partial or Full Guarantee Fund) to facilitate access to finance for farms under 500 ha. In the modelling exercise we assume that this facility would be available for all farms under 500 ha.
Focus on small farmers’ support – simulating improvement of their productivity by means of targeted state support
Over the last two decades, agricultural support in the form of substantial tax benefits and direct budget outlays in Ukraine has always been favoring large producers thus creating unequal conditions for developing the small ones. This partially distorted the farm structures towards the large and mega-large agriholdings in Ukraine and left less space for improving productivity and diversification of the small ones. Figure 6 demonstrates productivity gap between various farm size groups. To help small farmers improve their productivity we assume that state subsidies to agriculture that are currently often ill-targeted and fail to lead to productivity increases would be rationalized and redirected to support investments for very small farms under 100 ha. We also assume that this support would double small farms productivity by a factor of two.
Figure 2 Welfare Effects of Various Land Market Opening scenarios
Discussion of the modelling results
Table 1 below summarizes key outcomes of the selected scenarios in terms of additional agricultural GDP, calculated price, additional average annual GDP growth; agricultural value added per ha; and total agricultural value added from different farm size groups. The list of options above can produce multiple combinations of restrictions or scenarios that trigger changes on both farmland sales and lease markets. Depending on the new equilibrium prices, we calculate the changes of agricultural value added on both farmland markets and aggregate them into the change in the overall agricultural GDP. The change in our set up occurs over the medium term horizon, which is 3 to 5 years.
As the Table 1 below demonstrates the highest agricultural GDP increase (USD 10.6 bn) is possible in the scenario of liberal market design (with access of foreigners, no land ceilings cap) and financial support of small farmers to access the capital and increase their productivity. Additional USD 10.6 bn of agricultural GDP or roughly USD 2 to 3.5 bn of annual increase (over 3 to 5 year horizon) is quite conceivable outcome taking into account historical agricultural growth in Ukraine. As Figure 10 shows, Ukraine’s agriculture experienced quite a few episodes of close to and higher than USD 2 bn of annual growth since 2000.
USD 10.6 bn of additional agricultural GDP translates into 1.86% or 3.1% (depending on the appropriate time horizon) annual Ukraine’s GDP growth. Figure 3 shows how the initial supply of farmland will be distributed among various farm size groups; medium size farms (2 to 10 thousand ha) will buy out relatively more land.
Scenarios with more stringent restrictions in general produce lower GDP growth rates. The lowest growth occurs in the scenarios were legal entities have no access to the farmland sales market. The scenarios whereby only state land is sold on the market (scenarios 5 and 6), produce some growth but it fades pale compared to growth opportunities contained in the one-go land market opening scenarios. Expected farmland in this case is relatively high, though, i.e. more than USD 6000 per ha, which is because of the high demand and very limited supply available (see Figure 2).
Table 1. Effect of selected scenarios of lifting the land sales moratorium
| Scenario # | Foreigners | State Only | Land ceilings | Financial support to farms < 500 ha | State support to farms < 100 ha | Calculated price, $/ha | Av. GDP incr. over 3-5 years period, $ bln | Annual GDP incr. (%) | |
| Individuals/Legal Entities | |||||||||
| over 5 years | over 3 years | ||||||||
| 1 | yes | no | No Restrictions | yes | yes | 2968 | 10.57 | 1.86% | 3.12% |
| 2 | no | no | No Restrictions | yes | yes | 2019 | 9.04 | 1.60% | 2.68% |
| 3 | yes | no | 500ha/5000ha | yes | yes | 2305 | 8.85 | 1.57% | 2.62% |
| 4 | no | no | 500 ha /5000 ha | yes | yes | 2019 | 7.50 | 1.33% | 2.23% |
| 5 | yes | no | No Restrictions | no | no | 2425 | 5.93 | 1.06% | 1.77% |
| 6 | yes | no | 200 ha /1000 ha | yes | yes | 2019 | 5.37 | 0.96% | 1.61% |
| 7 | no | no | 200 ha /1000 ha | yes | yes | 1668 | 5.08 | 0.91% | 1.52% |
| 8 | yes | yes | 200 ha /1000 ha | yes | yes | 6554 | 2.02 | 0.38% | 0.64% |
| 9 | no | yes | 200 ha /1000 ha | yes | yes | 6507 | 2.00 | 0.37% | 0.61% |
| 10 | yes | no | 200 ha /0 ha | yes | yes | 1190 | 2.13 | 0.39% | 0.64% |
| 11 | yes | no | 200 ha /0 ha | no | no | 1062 | 0.02 | 0.00% | 0.00% |
Figure 3 Distribution of land purchases (2,6 mln ha) among various farm size groups
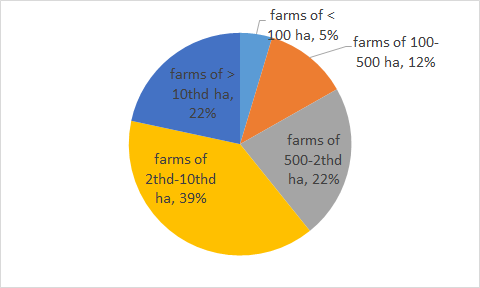
Source: own calculations
Table 2 below summarizes redistributive effects of lifting the moratorium for various scenarios that were estimated above. Figures on the average value added per ha for various scenarios compared to the baseline scenario demonstrate the main mechanism of generating additional value added in the sector. In particular, ‘moving the land’ from less to more efficient farmers increases average and thus overall productivity in the sector.
Table 2. Redistributive effects of various scenarios of farmland market opening
| Sce-nario # | Fore-igners | State Only | Size limits | Financial support to farms < 500 ha | State support to farms < 100 ha | average value added per ha in $ | % of the sector value added | ||||||||
| Individuals/
Legal Entities |
farm size, ha | farm size, ha | |||||||||||||
| <100 | (100-500) | (500-2000) | (2000-10000) | >10000 | <100 | (100-500) | (500-2000) | (2000-10000) | >10000 | ||||||
| 1 | yes | no | No Restrictions | yes | yes | 379 | 318 | 270 | 282 | 381 | 1.7 | 4.6 | 29.1 | 45.9 | 21.7 |
| 2 | no | no | No Restrictions | yes | yes | 410 | 330 | 269 | 281 | 378 | 1.6 | 4.5 | 29.6 | 46.0 | 21.3 |
| 3 | yes | no | 500ha/5000ha | yes | yes | 366 | 309 | 268 | 280 | 382 | 1.8 | 4.9 | 29.6 | 47.0 | 19.7 |
| 4 | no | no | 500 ha /5000 ha | yes | yes | 410 | 330 | 269 | 281 | 382 | 1.7 | 4.6 | 30.1 | 46.8 | 20.0 |
| 5 | yes | no | No Restrictions | no | no | 279 | 281 | 267 | 280 | 378 | 0.9 | 3.9 | 29.4 | 46.8 | 22.1 |
| 6 | yes | no | 200 ha /1000 ha | yes | yes | 357 | 305 | 267 | 282 | 382 | 1.9 | 5.2 | 31.5 | 44.0 | 20.4 |
| 7 | no | no | 200 ha /1000 ha | yes | yes | 387 | 314 | 257 | 272 | 376 | 1.7 | 4.9 | 31.7 | 44.5 | 20.4 |
| 8 | yes | yes | 200 ha /1000 ha | yes | yes | 328 | 273 | 249 | 263 | 367 | 1.4 | 4.2 | 30.8 | 46.0 | 20.9 |
| 9 | no | yes | 200 ha /1000 ha | yes | yes | 328 | 274 | 248 | 263 | 367 | 1.4 | 4.2 | 30.8 | 46.0 | 20.9 |
| 10 | yes | no | 200 ha /0 ha | yes | yes | 366 | 254 | 243 | 262 | 367 | 1.8 | 4.0 | 29.8 | 46.7 | 21.2 |
| 11 | yes | no | 200 ha /0 ha | no | no | 179 | 227 | 242 | 259 | 367 | 0.6 | 3.6 | 30.3 | 47.5 | 21.5 |
| Baseline | 179 | 226 | 242 | 259 | 367 | 0.6 | 3.6 | 26.8 | 47.5 | 21.5 | |||||
Moreover, the scenarios presented in the table demonstrate that small farmers will at least not lose as a result of land redistribution. On the contrary, if there is support available, small farmers even gain in terms of the share of sector value added.
Recommendations
Based on the results of the above modelling scenarios and taking into account global experience we summarize below key recommendations
Open markets in one go: Starting to allow transfer of state land first, to be followed by private land later is not recommended for several reasons. Total Sstate land supply at the moment is limited at only about 2 mn ha of the estimated 9 mn ha of registered state land suitable for agriculture, most of which is leased and thus cannot be sold. Markets relying on state land only would thus be very thin, resulting in high prices and outcomes biased towards wealthy individuals/agricultural companies. As state land is expected to be transferred to amalgamated communities (OTGs) who may want to decide for themselves whether to lease or sell, using state land as the motor for land market opening would also conflict with the decentralization agenda. Given state land market low liquidity, banks would not be interested in getting involved so that small farmers already owning land will not be able to access credit for working capital or investment, diversification and job creation. Finally, lifting the moratorium on state land will not allow Ukraine’s 7 mn landowners to exercise their constitutional rights while tarnishing the country’s reputation as it fails to act on the ruling of the European Court of Human Rights that found the moratorium on agricultural land sales indeed violating human rights and required changes to eliminate this. Most importantly, the growth benefits one could expect from lifting the moratorium on state agricultural land are very only would be limited to at most 0.74% increment in annual GDP growth compared to 3.1% in a comparable scenario where private agricultural land markets are opened as well.
Strictly enforce anti-monopoly legislation: Regulation to ensure competition in the land market is essential to avoid exercise of market power. Strict enforcement of anti-monopoly regulation that limits the share of land owned by one entity to 35% of agricultural area of an amalgamated community (OTG) is necessary to avoid undesirable outcomes. Lower size limits can be defined in local land use plans and enforced at OTG level. Higher level thresholds currently discussed (i.e., ow8ned or operated by one entity to 158% of agricultural area the territory of an oblast, and 0.5% for the nation) is necessary to avoid undesirable outcomes. can exist for political reasons. Lower size limits can be defined in local land use plans and enforced at OTG level. Speculative land holding should also be discouraged by increasing land tax rates to realistic levels that can be varied within certain bands at local level and by improving enforcement via electronic link between the Land Cadastre and the State Fiscal Service.
Beyond these, nationally uniform limits on land holding size (e.g. 200 ha for individuals and 1000 ha for legal entities) that neglect the country’s regional diversity and the potential of variation and changes in optimum farm size over space and time and that are difficult to enforce and easy to circumvent are not recommended. International experience shows that such restrictions hardly ever worked as intended anywhere but instead created distortions, corruption, and a shadow economy. Moreover, simulations suggest that the costs in terms of foregone growth would be high: in a plausible scenario, annual GDP growth would be significantly higher without restrictions as compared to a scenario limiting ownership to 200 and 1,000 ha for individuals and legal entities, respectively.
Allow legal entities to buy land: Restricting land market participants to individuals only will limit demand for land, keep prices low, and limit benefits to landowners as well as economic impact. Commercial banks will not be interested in extending/developing land financing instruments for individuals only, so credit and financial market benefits are unlikely to materialize and the scope for reallocation of land to better producers will be scant. To allow effective implementation of anti-monopoly and anti-money laundering legislation, only Ukrainian legal entities beneficially owned by natural persons who are registered in Ukraine should be allowed.
Provide financial support to small producers: As tradable land is an ideal collateral, functioning land markets can unlock large amounts of mortgage lending. This would benefit small producers who mainly operate own land and who could access credit to invest in intensification and high value-added crops if the moratorium were lifted. Lack of familiarity with and perceived high risk of the SME sector may, however, prevent banks from providing credit in the initial period after market opening, potentially undermining SMEs’ competitiveness, market participation, and growth. A partial credit guarantee (PCG) can reduce this risk and allow SME access to finance. The mechanism is establishment and initial capitalization of a commercial agency that, for a fee, assumes part of the risk of default by targeted groups on the credits they get. Preliminary calculations that we performed suggest that to capitalize an agency that would cater to initial demand for investment and land purchase about USD 650 to 100 million would be needed. If a commercially run private entity with majority private participation were set up, donor, IFI, and private sector support could cover all or part of this, potentially supplemented by part of the agricultural subsidy budget.
Support SME investments through redirecting agricultural subsidies: Most Ukrainian farmers currently produce low margin field crops rather than orchards or horticulture because they lack market links and access to capital for investments, e.g. in irrigation, that could easily double their output per hectare. With developed financial markets and agricultural value chains, credit for such investments would be available. Yet, even after moratorium lifting, these developments will take time. Bridging this gap by providing investment grants to SMEs, possibly administered by banks together with PCG resources, would be a more appropriate use of state subsidies of USD 250 mn per annum which currently mostly go to waste. A more realistic tax regime for the agricultural sector, which will be needed in any case, could then recoup some of this investment in the future. Calculations suggest that such a measure which could be operationalized quickly and could significantly add to GDP growth. A comprehensive farmer registry to verify farmers’ land data to establish eligibility and also reduce banks’ lending cost would need to be established, and this process has started.
Do not completely forbid foreign ownership: Land purchases by foreigners imply a host of risks, most importantly money laundering, use of land acquisition for political motives and the fact that foreigners may cause irreversible damage and then just leave the country. Yet few of the key agricultural exporters ban foreign land ownership. Instead, they opt to carefully regulate and scrutinize such investment. The reason is that foreign land ownership provides important benefits that, in the case of Ukraine, would include (i) the ability to tap capital, technological know-how, and access to value chains especially in horticulture and fruits, that are not available locally; (ii) the scope for such investment from the EU to help improve EU market access in return; (iii) the improved transparency associated with FDI from developed countries which are often subject to strict transparency rules; and (iv) higher benefits to landowners in the form of higher land value. The fact that problems caused by foreigners are due to gaps in regulations or enforcement that are also exploited by country nationals further reinforces this.
Instead of banning foreign land ownership altogether, it could thus be prudent to set clear standards in terms of transparency (e.g. no shell companies) or national co-ownership and make foreign land acquisition contingent on criteria, e.g. minimum levels of investment, job creation, or exports of what it produces, to be achieved. As long as these are centrally monitored and enforced, communities could decide if (or under what conditions) foreign land acquisition is allowed in their local development plans.
Take active measures to minimize risks: Measures to ensure regulations are enforced and the risk of abuse is minimized are greatly facilitated by institutional reforms and technological links. They include:
- To enforce anti-monopoly laws, registration software should automatically block transactions if restrictions are violated; transaction records and cadastral data should be publicly available; and free messages could be sent to all parties (including local Government) potentially affected by a registered transaction to protect against fraud and allowing to raise objections.
- Recording and publication, subject to privacy restrictions, of sales price data; using rules to check for transaction prices in force for other real estate and exploring additional seller protections (e.g. a mandatory sign-off on any transactions apparently below-market value) to protect against fraud.
- Reliance on the free legal aid system already established by the Ministry of Justice with monitoring of outcomes throughout the system to preclude coercion or involuntary dispossession of ill-educated land owners.
- The scope for negative environmental impacts should be reduced by routinely monitoring land use and compliance with local land use plans using remote sensing data rather than ad hoc mechanisms.
- To provide funding for SME support, current subsidy programs should be restructured and targeted more effectively and linked to farmers’ registry & local land use plans, land tax/fee collection be streamlined and the agricultural tax regime be reviewed to ensure the sector pays its fair share to the state budget. An independently commercially run partial credit guarantee agency involving private & IFI seed capital should be established.
Annex
Approach Undertaken
In the study we employ a classical partial equilibrium analysis built on the existing statistical data on the farmland market in Ukraine and farm-level data provided by the State Statistics Service of Ukraine, survey of landowners, farmers and overall population of Ukraine that allows to make some inferences on expectations with regards to lifting the moratorium.
We consider farmland lease and sales markets to be inter-linked via sales and rental prices. Moreover, we assume that purchase is preferred to renting the farmland for it provides more security for farms. Demand schedules on both markets are derived empirically from observed individual farms’ gross and net margins. Land price varies according to a number of factors, wherein land rent is the major factor determining land price (Just and Miranowski, 1993). Land rent, or farming income accruing to the farmland, determines farmers’ willingness to pay for the use of additional hectare of land. Land rent is a margin that is left over when all relevant costs of farming have been subtracted from the revenue that is generated from the sales of the crops produced on the land. Moreover, in the analysis follows the income-capitalization approach which assumes that a rational farmer will be willing to pay no more than the net present value of the residual incomes or net margins stream that can be derived from a hectare of land.
Gross margins are taken to approximate empirically the farmland lease demand schedule, for they make up a maximum price that farmers would be willing to pay for land services in the short run. Net present value of net margins (or capitalized net margins), on the contrary, are taken to derive a productive demand schedule on the farmland sales market, which is more a long term concept whereby fixed costs have to be taken into account. Income capitalization model is directly related to the price to earnings ratio (P/E) or cash rent multiple for farmland, or the ratio of the farmland sales price to the rental price, which is the inverse of the discount rate. Cash rent multiple for farmland could be approximated by 20 in Ukraine (see Nivievskyi and Strubenhoff, 2017, for details).
Based on the 2013-2015 farm-level accounting data for population of agricultural producers, for each farm we calculated the 3-year average crop gross and net margins to smooth inter-temporal environment fluctuations. In total we analyzed 29,847 unique agricultural enterprises (including individual farms and corporate agricultural enterprises) over the period considered in the analysis. Distributions of 2013-2015 gross and net margins are contained in the Figure 4 and Figure 5. Figure 6 demonstrates how gross margins change across the farms of various sizes. The figure shows that on average small farms (up to 500 ha and especially up to 100 ha) generate substantially less profits from a hectare of agricultural land. Figure 9 demonstrates empirical demand functions for the farmland sales and lease markets.
Additional requirement to farmers to be selected into the farmland sales demand curve is that they have to have high enough productivity to be able to service a 7-year loan (at a real interest rate of 10%) for acquisition of such land and make a down payment of 20% of the purchase price and the price for land purchase and lease is determined endogenously (see further discussion). In other words, land will be purchased by those who can afford it (i.e. can finance it through the credit) and move to those with higher levels of productivity in the lease and sales market to result in a new equilibrium in a national market. To finance the down-payment, farms are assumed to have a ‘cash reserve’ of one year’s net income and we assume that credit on these terms is available only to those cultivating more than 500 ha.
Figure 4 Distribution of gross margins
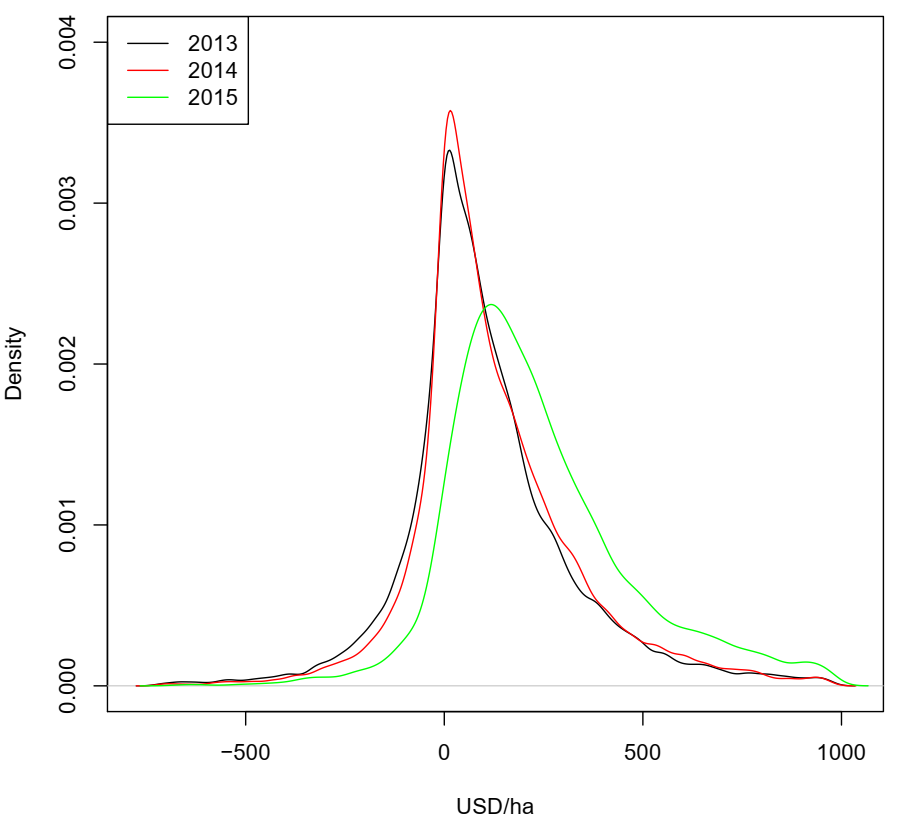
Figure 5 Distribution of net margins
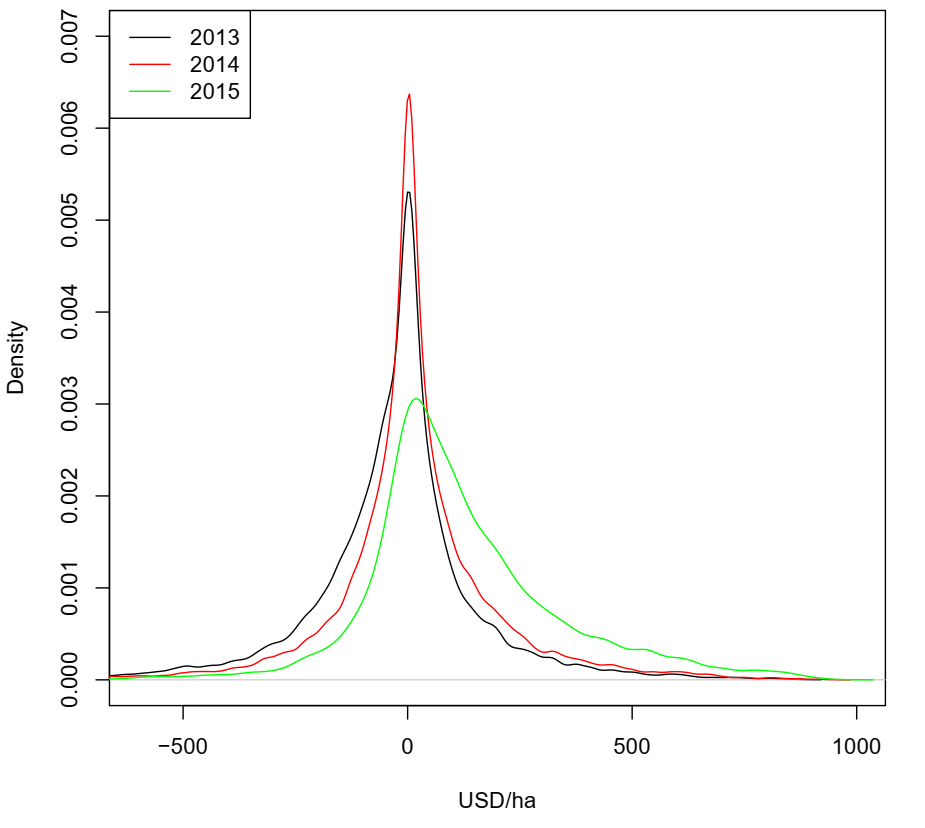
Figure 6 Gross margins across farm sizes; dotted line – confidence intervals.
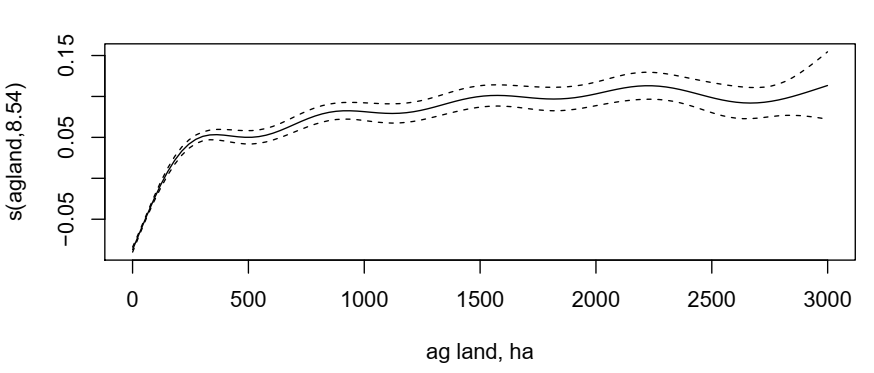
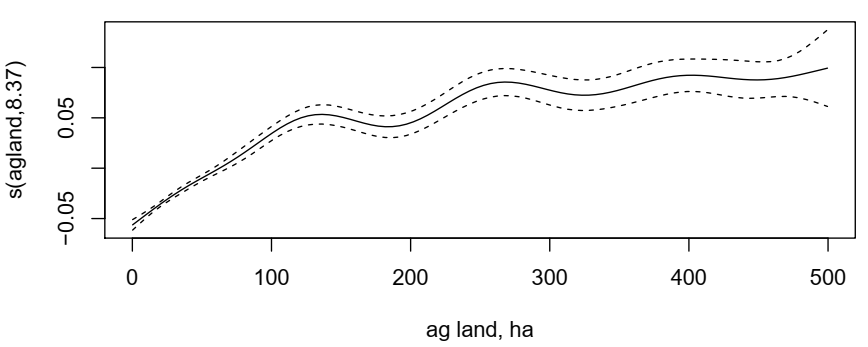
Figure 7 Distribution of gross margins (positive)
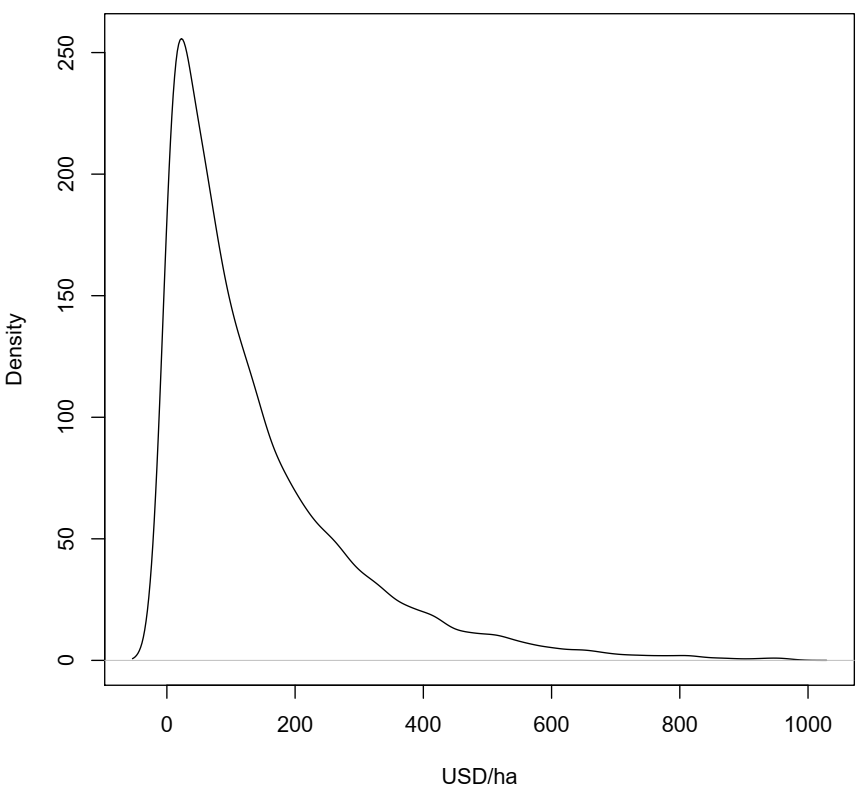
Figure 8 Distribution of net margins (positive)
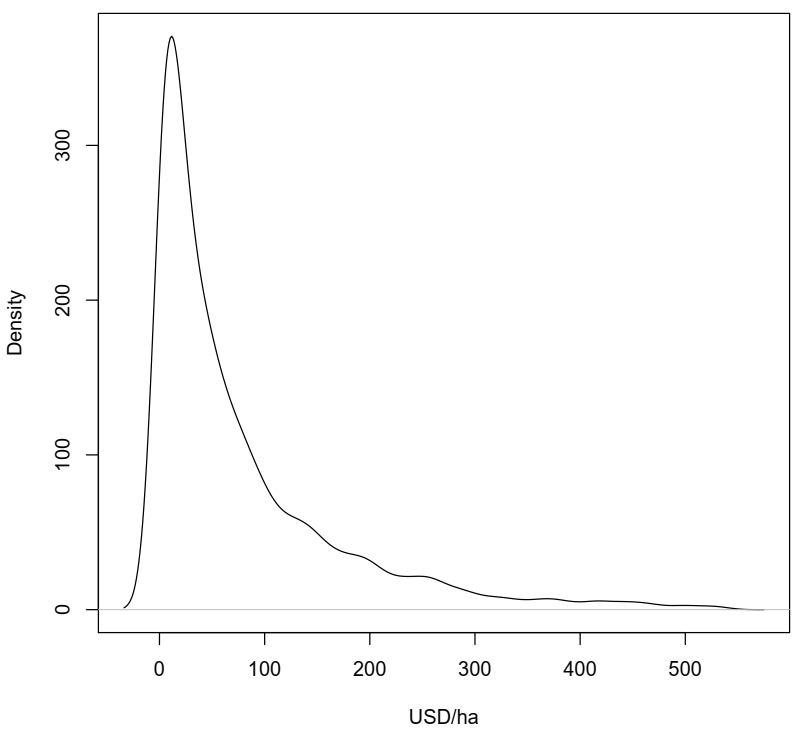
Figure 9 Empirical Demand Schedules for Farmland Rental and Sales Markets.
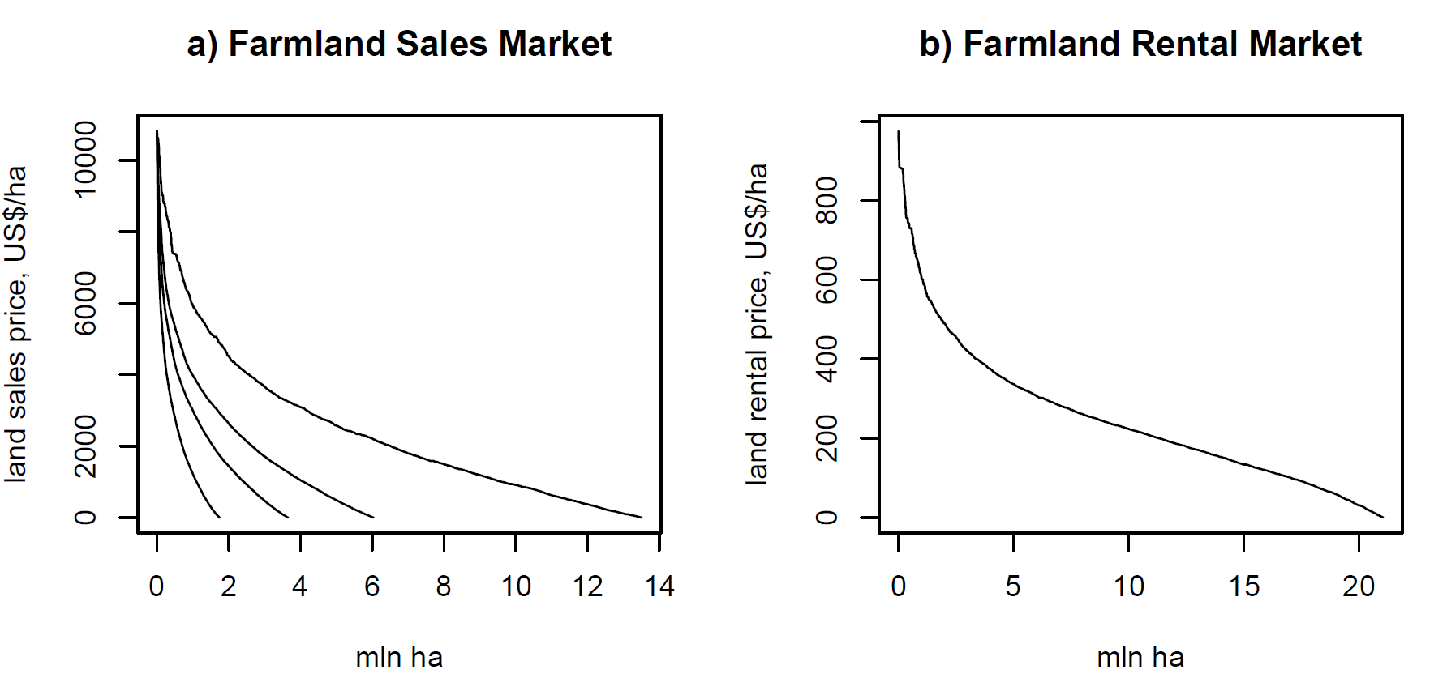
Source: Own presentation using ukrstat data. Demand on the Farmland Sales market contains unrestricted demand functions, as well as under the assumption of 200 ha, 500 ha, and 1000 ha ownership restrictions
Figure 10 Ukraine’s Agricultural GDP since 2000
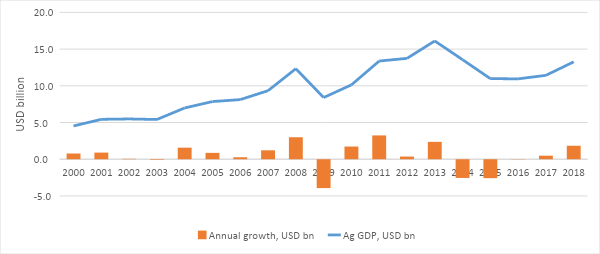
Source: Own presentation using World Bank WDI data
Literature
Easybusiness (2019): “Life After: Key aspects of land market opening”. shorturl.at/sCJR8
Just E, r and J. Miranowski (1993) “Understanding Farmland Price Changes”. American Journal of Agricultural Economics, vol 75, p.165-168
Nivievskyi O. and H. Strubenhoff (2017). Where Will the Demand for Land Come From? Evidence from Farm Models, contributed paper, 2017 World Bank Conference on Land and Poverty, Washington DC, March 2017 (https://www.conftool.com/landandpoverty2017/index.php?page=browseSessions&form_session=33&presentations=show)
Nivievskyi O, D. Nizalov and S. Kubakh. ‘Restrictions on farmland sales markets: a survey of international experience and lessons for Ukraine’. Analytical paper, Project «Capacity Development for Evidence-Based Land & Agricultural Policy Making in Ukraine» at Kyiv School of Economics; www.land.kse.org.ua; Short version is available at https://voxukraine.org//2016/02/18/restrictions-on-farmland-sales-markets-international-experience-en/
Deininger, K., & Feder, G. (2001). Land institutions and land markets. In B. L. Gardner & G. C. Rausser (Eds.), Handbook of agricultural economics (pp. 288–331). Amsterdam: Elsever/North-Holland.