At the Ukraine Recovery Conference (URC) in Rome, key decision makers, stakeholders, experts, and business leaders met to exchange views and coordinate efforts aimed at supporting Ukraine’s economic recovery and reconstruction.
As with last year’s conference held in Berlin, the agenda encompassed four thematic dimensions, one of which was the business one. Policy makers continue emphasising the critical role of foreign direct investment (FDI) in Ukraine’s economic recovery. So, we have undertaken an assessment of the current trends, and key drivers influencing inward FDI flows to Ukraine. According to national data, inward FDI flows have amounted to USD 8.3 bn since 2022. From a microeconomic perspective, each investment made by a foreign enterprise in a country at war represents a courageous commitment. However, from a macroeconomic perspective, the current level of FDI is insufficient to address the scale of the recovery challenges.
Background
On 10-11 of July, Ukraine and Italy hosted the fourth Ukraine Recovery Conference (URC) since the start of Russia’s full-scale war. While Ukraine’s economy has returned to growth, following a sharp contraction in 2022, restoring economic output to pre-war trend levels remains a long-term challenge. To accelerate the country’s growth trajectory, policymakers consistently highlight the need for targeted measures to attract FDI. In this context, we have assessed the current development of FDI inflows to Ukraine and examined its key driving forces.
Figure 1. Development of FDI inward flows
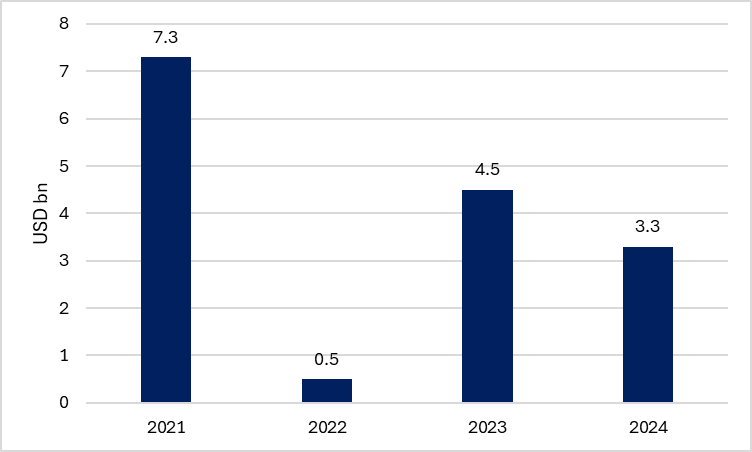
Source: Own display based on National Bank of Ukraine
According to data from the NBU, inward FDI flows totalled USD 8.3 bn between 2022 and 2024 (figure 1). From a microeconomic perspective, this number reflects a degree of confidence among international investors in Ukraine’s future economic potential and illustrates courageous decisions by certain companies. However, from a macroeconomic standpoint, average annual FDI inflows have amounted to only 1.6% of Ukraine’s GDP since 2022, a number that falls short of what is required for Ukraine’s economic recovery, and well below the pre-war level.
What are the drivers?
A closer examination of the FDI statistics reveals that the majority of FDI is not attributable to new equity capital transfers from parent companies abroad to their subsidiaries in Ukraine. Rather, a substantial portion of FDI stems from the reinvestment of earnings. Due to limits of dividend repatriation, foreign companies’ balance sheet profits remain within Ukraine. Between 2019 and 2021 (i.e. before the full-scale war), they accounted for approximately 59% of total FDI. This trend has continued during the war: between 2022 and 2024, the share has slightly increased to 61% (figure 2). On the one hand, it is remarkable that foreign enterprises continue operating profitably in Ukraine. On the other hand, this dynamic also underscores the limited scale of new foreign companies entering the market.
However, the increase in equity capital inflows is a positive development worth mentioning. They increased from USD 0.4 bn in 2022 to USD 0.9 bn in 2024.
Figure 2. Main drivers of FDI inward flows
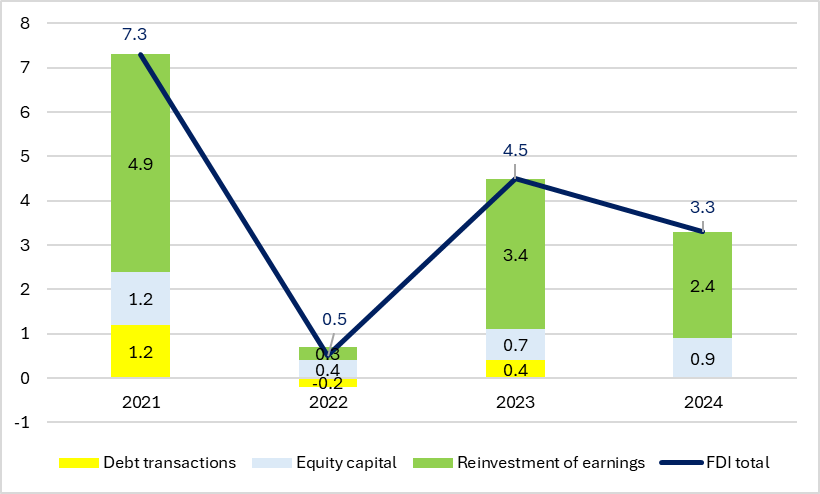
Source: Own display based on National Bank of Ukraine
Inward flows by countries
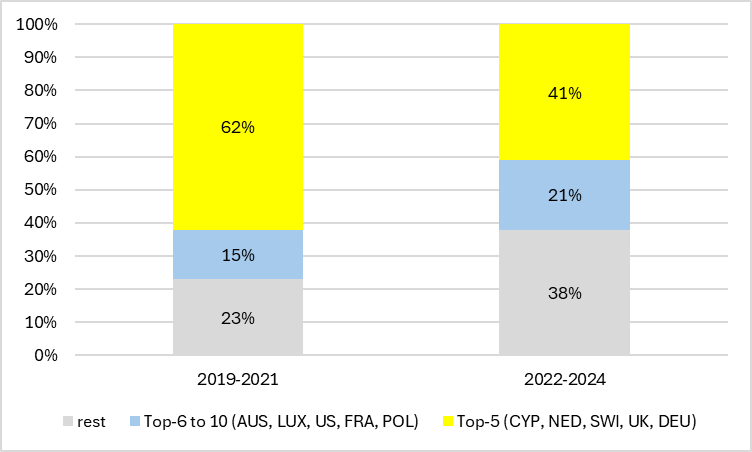
Between 2019 and 2021, the majority of inward FDI to Ukraine originated from five key source countries: Cyprus, the Netherlands, Switzerland, the United Kingdom, and Germany, accounting for 62% of total inward FDI flows. Note that a portion of these flows may be attributed to so-called “roundtripping”, which “refers to the channelling abroad by residents of local funds and the subsequent return of these funds to the local economy in the form of direct investment” (NBU, 2025). The NBU estimates the share of roundtripping at 24% of total flows between 2010 and 2024, particularly related to transactions from Cyprus, the Netherlands, and Switzerland.
Since 2022, source countries have become more diverse (figure 3). The mentioned top-5 countries’ share declined to 41%. FDI from Germany is negative due to negative reinvestment of earnings, while there is increasing investment from countries like Austria, the US, Poland or France. Furthermore, investments by Saudi companies of more than USD 217 million in 2024 are worth mentioning.
Figure 3. Source countries of FDI inward flows
Source: Own display based on National Bank of Ukraine
Inward flows by sectors
A further shift has been observed in the sectoral composition. Prior to the war, FDI flows were relatively evenly distributed between the industrial and services sectors. Since the beginning of Russia’s full-scale war, however, there has been a marked shift towards investment in services, driven both by larger level new equity and larger profits. Of the 17 subsectors for which data is available (excluding “public administration and defence” and “other services”), only five have recorded higher inward FDI flows since the full-scale war than during the pre-war period. All of these belong to the services sector.
Figure 4. Development of FDI inward flows by sectors
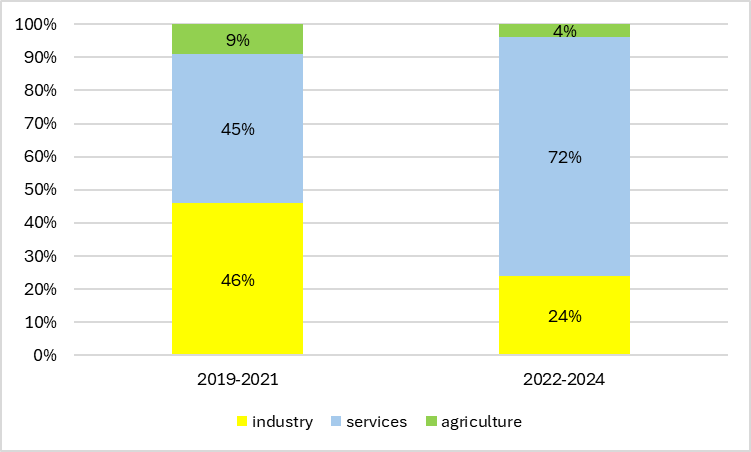
Source: Own display based on National Bank of Ukraine
Before the war, the top three subsectors attracting FDI were mining, financial services, and manufacturing. Since 2022, these have been replaced by trade, financial services, and ICT – all of which are service-related sectors. For a deeper understanding of the key importance of FDI for economic recovery and growth, which has often been stressed by key policy makers during the war, we empirically test the causality relation between FDI inflows and real gross value added (GVA) growth. Policy makers often refer to the importance of FDI for economic growth. We test this hypothesis. We use 17 economic subsectors and quarterly data from 2019 to 2024. As this test is based on panel data, we use a special application of the Granger Causality test, namely a pairwise Dumitrescu Hurlin Panel Causality Test (see Lopez and Weber (2017)). The model is applied using two lags which are identified via Schwarz Information Criterion and we made sure that both time series are stationary. We do find statistically significant support for the hypothesis that FDI flows cause GVA growth, which is often mentioned by policy makers.
Model presentation
The model is described by the following equations:
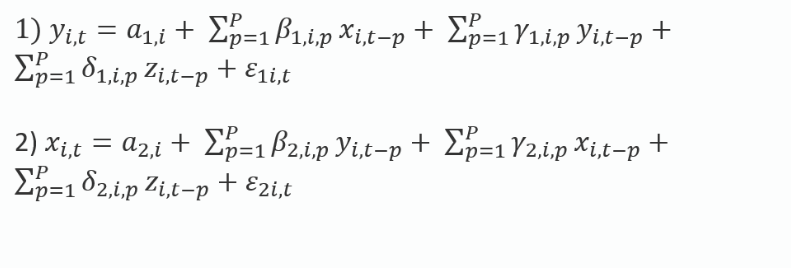
Where x=FDI flows, y=real GVA growth you, z=War Dummy, t=quarter (1 to 24), p=lag (1 or 2), i=sector (1 to 17).
| Null hypothesis: no causality | p-value | result |
| FDI does not cause GVA growth | 0.0003 | hypothesis rejected |
| GVA growth does not cause FDI | 0.3419 | hypothesis not rejected |
Source: Own estimate and display based on data by NBU and Ukrainian Statistical Service. Lag was selected by various lag order structure criteria comparing one and two lags due to the short time period. Both x and y are stationary tested by ADF. For panel Granger causality see Lopez and Weber (2017). p-value indicates that the hypothesis “FDI does not cause GVA growth” can be rejected. The hypothesis “GVA growth does not cause FDI” cannot be rejected under this test.
Policy implications and outlook
This result highlights the key importance of policy measures to attract FDI for Ukraine’s recovery. Currently, statistics show relatively moderate volumes of FDI inflows during the war. “Fresh” equity investment has been limited since 2022, even though there is a positive trend. This result indicates that foreign companies remain hesitant, given the risky environment. Therefore, there is a further need to discuss policy measures to improve investment attraction.
For example, reforms and the EU accession process were a key driver for FDI in Ukraine’s neighbourhood countries in the past. Therefore, expanding Ukraine’s access to the EU common market will positively influence foreign companies’ willingness to invest even before membership and support Ukraine’s economic resilience in general.
Moreover, security risks can be insured by public guarantee schemes. Currently, only a very limited number of countries offer schemes for their companies’ investment in Ukraine during the war. A new scheme insuring all new investments (domestic and foreign) would be a game changer. Involving different layers of insurance with private insurance at the first layers and public backing as a final layer, based on existing experience of terrorism insurance schemes (e.g. Israel, Australia), may display financially sustainable solutions. Capital controls are also often mentioned as obstacles for investment. Capital controls however support the exchange rate stability when Ukraine faces a strong trade deficit. So, the NBU, as the responsible institution, when deciding about capital controls has to take macro-financial stability into account. Thereby, a stable macro-financial environment is itself a key aspect for investment attraction. Furthermore, some of the capital controls, particularly for repatriation of dividends, have been recently relaxed. All in all, a resilient macroeconomic and macro-financial environment is as important as investment climate improvement for FDI attraction. All these issues will continue playing a key role for Ukraine’s economic recovery.
This newsletter is based on the Policy Briefing “FDI inward flows into Ukraine: Dynamics, structure, and drivers during wartime“.
Photo: depositphotos.com/ua
Attention
The author doesn`t work for, consult to, own shares in or receive funding from any company or organization that would benefit from this article, and have no relevant affiliations