According to the State Statistics Service, in Ukraine 31% of women aged 25-34 are economically inactive. The main reason for this is family care. At the same time enrollment rate at kindergartens for preschool age children is only 55% and kindergartens appear to operate at full capacity. Will an increase in preschool care availability have a significant positive effect on mothers’ employment? Or perhaps the availability of retired grandparents who can take care of grandchildren will help young mothers to join the labor force? This was the topic of the MA thesis of Anna Pylypchuk, 2018 KSE graduate.
Female labor force participation
Efficient use of human capital is probably the most important factor of economic growth. Today, population in many developed countries and in Ukraine is aging, so increasing labor force participation is very important for them. Stimulating female labor force participation is even more important, as it remains lower than men’s in almost all countries. Increasing female labor force participation may help to narrow total gender gap and to increase overall productivity. For example, Weinstein (2017) documents for the USA that increasing female labor force participation rate by 10% leads to a 5% increase in the median real wage for both men and women, likely due to rising overall productivity. In contrast, a 10% increase in male labor force participation rate is associated with a 3% decrease in the median real wage, mainly due to a shift of the labor supply curve.
Female labor force participation is a pressing issue in Ukraine. State Statistics Service (2017) reports a substantial difference in labor force participation among men and women. In 2016 there were 31% economically inactive women compared to 9.4% of men aged 25-35 (the most common childbearing age for women – Figure 1).
Figure 1. Economically inactive population in Ukraine, %.
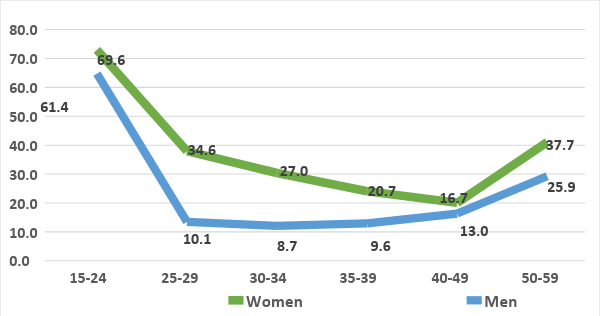
Source: State Statistics Service report (2017)
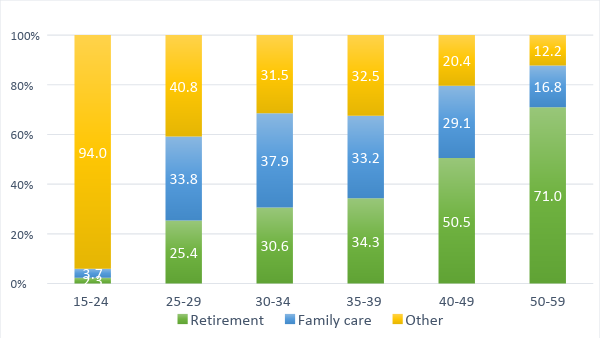
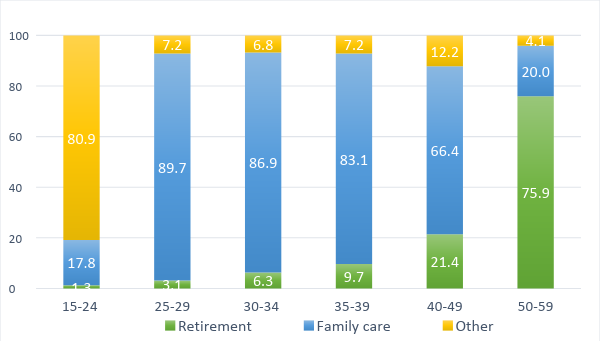
According to the report, the main reason for not participating in labor force for women aged 25-34 is family care (almost 90%), while only 30% of men of the same age indicate family care as a reason for economic inactivity (Figures 2 and 3)
Figure 2. Reasons for inactivity of men.
Source: State Statistics Service report (2017)
Figure 3. Reasons for inactivity of women.
Source: State Statistics Service report (2017)
This situation is not unique for Ukraine. A recent analysis of the European Institute for Gender Equality (2017) shows that a shift to a more equal distribution of unpaid care work is one of the main preconditions for realizing gender equality and increasing fertility rates in the future. Over the past decades, many advanced countries experienced the decline in fertility rates combined with the increase in female labor market participation. Nowadays the situation has changed, and many OECD countries show a positive correlation between birth rate and female employment – higher rates of female employment go together with higher birth rates. This is explained by higher security of earnings in times of higher employment opportunities (Da Rocha, J. et al., 2006).
Childcare options in Ukraine
Traditionally, women had to choose between work and family. Availability of different types of childcare softens this choice and allows women to join labor force without completely sacrificing personal aspects of life. Many studies show that lack of high-quality accessible childcare places significant constraints on female labor supply and is among the key factors that weaken women’s labor market attachment (e.g. Chevalier, 2002).
Childcare services in Ukraine can be divided into three major groups:
- public childcare (kindergartens). In Ukraine, only 55% of preschool children attend kindergartens while they are filled over capacity (118 children per 100 slots according to the State Statistics Service). The occupancy of kindergartens is uneven – in some rural areas there are fewer children than slots but in big cities there can be as many as 170 children per 100 slots. For comparison, in the European Union a plan (Barcelona Targets) of accessing public childcare is 33% until the age of 3 (this target has been generally reached in EU-28) and 90% from 3 until school age (European Commission, 2013). As of 2016, 86.3 % of children from 3 to the mandatory school-going age participated in formal childcare or attended preschool in the EU.
- informal childcare services – mostly provided by grandparents. An increase in the retirement age which makes grandparents less available to help with taking care of their grandchildren coupled with insufficient investment in public childcare may further stimulate the already wide intergenerational and gender gaps in employment. In particular, such situation may further reduce the employment of young women relative not only to older women but also to young men who traditionally bear less of the child care burden;
- private childcare services – babysitters or private kindergartens. In Ukraine, this type of childcare services is expensive and very rare in many regions. As a result, it is unavailable for most of Ukrainian families.
Estimation and results
We explore the impact on mothers’ labor supply of two most frequently used in Ukraine types of childcare – public and informal childcare services. In line with the literature we expect to see a positive effect of retired grandparents living in the same household on mothers’ labor supply. Kindergartens nearby are also expected to have a positive effect.
To examine the impact of different types of childcare on mothers’ labor supply we use the data from the Ukrainian Longitudinal Monitoring Survey – 2012 and the State Statistics Service Report (2013).
The results for Ukraine (see Annex) are different from those predicted by the literature – retired grandparents have a negative association with mothers’ employment. In particular, the likelihood of working for a young mother living in the same household with a retired grandfather is 24% lower than for mothers who live without grandparents. The only positive effect of grandparents on mothers’ labor supply is observed for employed grandmothers. Living with a working grandmother increases the likelihood of mother employment by 9%.
Availability of kindergartens nearby has no association with female employment. However, the amount of money that a family pays for a kindergarten is positively correlated with the probability of a mother to join labor market, even if a kindergarten is overcrowded.
Household income is a very important predictor of a mother’s decision to join the labor force. With higher family income the likelihood of women with young children to join labor force declines and mothers spend their time taking care of children and housework rather than working.
The labor force of young mothers in Ukraine has a few peculiarities compared to other countries. First, contrary to the literature, the level of education has no effect on the likelihood of mothers’ employment. For example, Muench et al. (2009) estimated female labor force participation in 23 EU countries over the period of 1995-2008 and found that tertiary education had a strong significant and positive effect on participation rates in all age groups. Absence of a similar effect in Ukraine suggests lower opportunity cost of non-working for young mothers. One of the reasons may be the age of mothers – 64% of females in our sample are under 30 years old, so they lack experience to have a highly-paid job even if they have tertiary education. Second, the type of settlement in which a household is living is an insignificant predictor of mothers’ employment. Thus for young mothers with children under 6, even more abundant opportunities of employment provided by big cities appear to have no effect on the probability of employment.
Conclusion and policy implications
Employers in Ukraine consistently complain about shortages of qualified workers being a limiting factor. Thus, to ensure high economic growth, policymakers should implement programs to raise labor force participation, especially for population groups where the pool of economically inactive people is large. The available evidence suggests that higher availability of childcare services is not enough to increase mothers’ labor supply in Ukraine. Instead, the household composition, namely, older members of households living together with a young family, has a crucial impact on female labor supply. A clear implication of this institutional setup in Ukraine is that we need to increase the supply of grandparents available for childcare services which would be hard to achieve without improving Ukraine’s healthcare system for the elderly.
References
Chevalier A. & Viitanen T. K. 2002. “The causality between female labour force participation and the availability of childcare”. Applied Economics Letters, 9:14, 915-918.
Da Rocha, J., & Fuster, L. 2006. “Why Are Fertility Rates and Female Employment Ratios Positively Correlated across O.E.C.D. Countries?” International Economic Review, 47(4), 1187-1222.
European Commission. 2013. Barcelona Objectives. The Development of Childcare Facilities for Young Children in Europe with a View to Sustainable and Inclusive Growth. Report from the Commission to the European Parliament, the Council, the European Economic and Social Committee and the Committee of the Regions. Luxembourg: Publications Office of the European Union.
European Institute for Gender Equality. 2017. Economic Benefits for Gender Equality in the European Union.
Lekhan VN, Rudiy VM, Shevchenko MV, Nitzan Kaluski D, Richardson E. 2015. “Ukraine: Health system review”. Health Systems in Transition; 17(2): 1–153.
Muench, Claudia and van Wijnbergen, Sweder and Lejour, Arjan. 2009. “Education and Labor Market Activity of Women: An Age-Group Specific Empirical Analysis”. Netspar Discussion Paper No. 11/2009 – 050.
State Statistics Service of Ukraine. 2013. Preschool education in Ukraine in 2012.
State Statistics Service of Ukraine. 2016. Ukraine in numbers.
State Statistics Service of Ukraine. 2017. Economic activity of population in 2016.
Weinstein AL. 2017. “Working women in the city and urban wage growth in the US”. Journal of Regional Science; 57:591-610.
Annex
Estimation results. Dependent variable – mother employment dummy
| Females with child under 6 y.o.
(1) |
Females with child under 6 y.o.
(2) |
Females with child under 6 y.o.
(3) |
Females
under 55 y.o. (4) |
|
| Grandparents on retirement ref. No grandparents | ||||
| Grandmother | 0.0955
[0.0803] |
0.0607 *
[0.0287] |
||
| Grandfather only | – 0.2364 *
[0.1098] |
– 0.1123
[0.0645] |
||
| Grandparents ref. No grandparents | ||||
| Grandmother | 0.0915 *
[0.0424] |
|||
| Grandfather only | – 0.0341
[0.1232] |
|||
| Kindergarten | – 0.0115
[0.0484] |
– 0.0223
[0.0484] |
– 0.0183
[0.0149] |
|
| Payment for kindergarten | 0.0290 ***
[0.0075] |
0.0294 ***
[0.0075] |
0.0149 **
[0.0048] |
|
| Number of kids under
15 y.o. |
– 0.0517 *
[0.0147] |
– 0.0761 **
[0.0276] |
– 0.0751 **
[0.0278] |
– 0.0215
[0.0130] |
| Age | 0.0169 ***
[0.0035] |
0.0147 ***
[0.0035] |
0.0164 ***
[0.0035] |
0.0077 ***
[0.0008] |
| Married | 0.0593
[0.0489] |
0.0621
[0.0482] |
0.1019
[0.0532] |
0.0326
[0.0203] |
| Income | – 0.0536 ***
[0.0146] |
– 0.0568 ***
[0.0145] |
– 0.0584 ***
[0.0146] |
– 0.0463 ***
[0.0069] |
| Education ref. Primary | ||||
| Secondary | – 0.0517
[0.0940] |
– 0.0531
[0.0938] |
– 0.0675
[0.0951] |
0.1836***
[0.0359] |
| Incomplete tertiary | 0.1230
[0.0999] |
0.1049
[0.0996] |
0.0855
[0.1009] |
0.2969 ***
[0.0393] |
| Tertiary | 0.1909
[0.0985] |
0.1801
[0.0982] |
0.1544
[0.0998] |
0.4430***
[0.0368] |
| Settlement ref. Village | ||||
| Town (up to 100th) | 0.0548
[0.0528] |
0.0503
[0.0554] |
0.0626
[0.0561] |
0.0613 *
[0.0284] |
| City | 0.0643
[0.0474] |
0.0542
[0.0574] |
0.0592
[0.0577] |
0.0716 **
[0.0268] |
| Region of Ukraine ref. Kyiv city | ||||
| West | – 0.0215
[0.1019] |
0.0138
[0.0970] |
0.0167
[0.0967] |
– 0.1010 *
[0.0493] |
| East | 0.1297
[0.0749] |
0.1587
[0.0957] |
0.1669
[0.0953] |
– 0.0243
[0.0467] |
| South | 0.0749
[0.1023] |
0.0919
[0.0972] |
0.1013
[0.0966] |
– 0.0333
[0.0479] |
| North | 0.1032
[0.1151] |
0.1486
[0.1125] |
0.1440
[0.1110] |
– 0.0230
[0.0527] |
| Central | 0.0659
[0.1027] |
0.1125
[0.0981] |
0.1164
[0.0973] |
– 0.0755
[0.0489] |
| Pseudo R2 | 0.1109 | 0.1319 | 0.1319 | 0.1241 |
| Number of observations | 632 | 632 | 632 | 2747 |
Notes: Standard errors in parentheses. * if p-value < 0.05, ** if p-value < 0.01, *** p < 0.001.