Estimating the potential net health gains or losses of approving a new health intervention (be it a surgical procedure, device, drug or pathway of care) requires understanding what else would have to be forgone to implement it. To understand these health opportunity costs we need a good estimate of the marginal productivity of the Ukrainian health care system. Current estimates are based on evidence of the expected health effects of changes in expenditure using cross-country data or extrapolations from previous work, but provide a framework within which an estimate of the health effects of a change in expenditure using Ukrainian data can be applied.
What is the health opportunity cost of an intervention?
Should the Ukrainian health care system fund treatment of multidrug resistant TB, flu vaccines or bone marrow transplants? Whether an intervention (be it a surgical procedure, device, drug or pathway of care) can be expected to improve overall population health isn’t just a question of its effectiveness. It also depends on whether the proposed new intervention would be expected to generate health benefits that outweigh those that could have been generated if the same money had been spent on something else in the health care system. Treating some patients in a national health system (NHS) with one intervention means that others must forgo treatment for something else. In other words, the question that needs answering is ‘what is the health opportunity cost of proposed new intervention?’
The health opportunity costs of funding interventions are likely to differ between health care systems (e.g., Ukraine, Georgia and Armenia), as systems may differ in terms of the size of “the bed”: the budget for health care, existing health care delivery infrastructure and human resources; and the “old men using the bed”: population demography (i.e., age and gender structure of the population) and epidemiology (i.e., burden of premature mortality and morbidity). Beyond these core characteristics the efficiency of the health care system and the array of interventions already provided may also differ based on various trade agreements and political will. To estimate health opportunity cost requires an estimate of how much health the health care system is currently able to generate given all these factors.
How much health does the Ukrainian health care system generate?
 Asking how productive the health care system is currently is the same as asking what effect on health a change (i.e., an increase or decrease) in expenditure would be expected to have. To date relatively few countries have been able to answer this question using within country data (see e.g.: Claxton et al. 2015 in the UK; Edney et al. 2017 in Australia; and Vallejo-Torres, García-Lorenzo & Serrano-Aguilar 2016 in Spain). However, a number of studies have aimed to answer this question using data from across countries (Gallet & Doucouliagos 2017).
One such study, Bokhari et al. (2007) used country-specific interaction terms reflecting measures of infrastructure and donor funding to identify country-specific effects of changes in expenditure on under-five and maternal mortality. The effect of a change in expenditure on under-5 and maternal mortality are themselves interesting, but knowing the marginal cost per under-5 death or cost per maternal death averted isn’t enough to enable comparisons across all the interventions a health care system could provide. Some health interventions will affect members of the population outside these groups. How can a knee replacement for a 64-year-old male and antibiotics to treat pneumonia in a 3-year-old girl be traded off? Both will reduce morbidity and one might even save a life. To be able to trade off across diverse interventions requires a generic measure of health that captures both length and quality of life. Commonly used measures are quality adjusted life years (QALYs) gained and disability adjusted life years (DALYs) averted. To understand better how these measures are estimated and used see (Drummond et al. 2015).
What is needed is an estimate of the effect of a change in expenditure on health that reflects the cost per QALY gained or cost per DALY averted at the margin in the health care system. Ochalek et al. (2015) expanded Bokhari et al.’s (2007) dataset to include additional outcome measures: adult mortality; a measure of survival, years of life lost (YLLs); a measure of morbidity, years of life disabled (YLDs); and a generic measure of health, DALYs; in addition to under-5 mortality. Elasticities are estimated on each of these outcome measures using an instrumental variable approach to estimation. (Details on the method of estimation are available in Bokhari et al, 2007). Applying the elasticities on these outcome measures to data on the demographic structure of the population and underlying burden of disease for each country, they were able to generate a range of country-specific cost per DALY averted estimates that reflect the health that the health care system is currently able to produce for 123 countries.
Ochalek et al (2017) provide a freely available online tool that enables users to input different elasticities reflecting what they believe the true effect of a change in a given amount of expenditure will have on each of the different outcome measures (figure 1). The estimates available in the tool are obtained by applying the elasticities to information about each country’s demography and epidemiology as well as the age and gender structure of the population. These use data from 2015 as compared to data from 2000, which inform the estimates available from Ochalek et al (2015).
Figure 1. An online tool that provides estimates of cost per DALY averted.
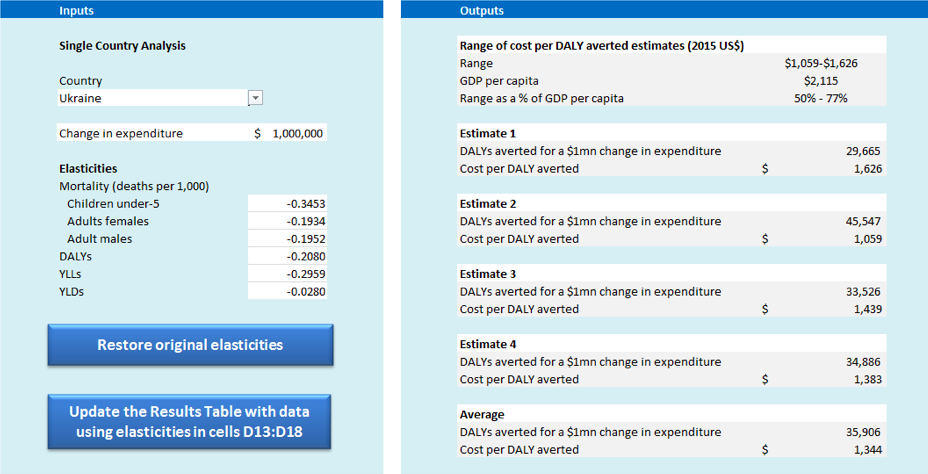
Available at york.ac.uk (Ochalek et al. 2017)
In Figure1, estimate 1 is based on under-5, adult female and adult male mortality elasticities (with respect to expenditure) and assumed proportionality to effect on morbidity. Estimate 2 is based on the YLL (years of life lost) elasticity and assumed proportionality to effect on morbidity. Estimate 3 is based on YLL and YLD (years of life disabled) elasticities, and so requires no assumptions about the proportionality of effects between the two. Finally, estimate 4 is based on the DALYs elasticity. As each of the four estimates is reported users are able to employ their own judgements about what they may believe to be the most plausible estimate (or estimates) based on the assumptions required to move from mortality to morbidity effects (i.e., in estimates 1 and 2) and the assumptions implicit in the calculation of YLDs and DALYs (i.e., relevant to estimates 3 and 4). Additional details on how each is estimated are available in Ochalek et al. (2015).
Other cost per DALY averted estimates are available from (Woods et al. 2016), who build on the work undertaken in the UK by Claxton et al. (2015), extrapolating those findings based on estimates of the income elasticity of demand for health and employing assumptions about the relative underfunding of each. The range of estimates available from Ochalek et al. (2017) and Woods et al. (2016) suggest that Ukrainian health care system is currently able to produce health at a rate of $1,059-1,626 (2015 US$) and $487-2,005 (2013 US$) respectively. This provides a likely range of possible point estimates based on cross-country data (Ochalek et al, 2015) and extrapolation from the UK estimates (Woods et al, 2016). (Note that there is also likely to be uncertainty in these estimates although this is not represented by the ranges.) However, estimates using Ukrainian data would help to pin the right value down more solidly..
These estimates of the productivity of the health care system reflect the health opportunity cost of a change (i.e., increase or decrease) in expenditure on health at the margin, and enable the calculation of the net impact that would result from funding an intervention. They are often referred to as ‘threshold’ values and while they can be used to calculate net impacts, they have historically more often been used as cut-off values to make categorical assessments about cost-effectiveness.
Wolves in sheep’s clothing
Danger lies, however, where ‘thresholds’ with other conceptual foundations reflecting ‘demand side’ notions, such as willingness to pay for health, are instead used to make such categorical assessments. Such estimates tend to be higher than ‘supply side’ estimates reflecting the marginal productivity of the health care system, and critically, they do not reflect the health that can actually be produced by the health care system (Vallejo-Torres, García-Lorenzo, Castilla, et al. 2016). Using estimates of willingness to pay as cut-off ‘threshold’ values therefore risks undermining the primary objective of health spending as interventions with higher ICERs (see below) that generate a net health loss may be approved for provision. The most widely cited ‘threshold’ values, which have since been disowned by the World Health Organization, are 1 and 3 times gross domestic product (GDP) per capita (Bertram et al. 2016; Leech et al. 2018).
Cold truth about ICERs
The ratio of incremental costs to incremental benefits (i.e., incremental cost-effectiveness ratio, ICER) of an intervention is often compared to a ‘threshold’ to make a categorical assessment about cost-effectiveness. If it is below the ‘threshold’, the intervention is deemed cost-effective. However, ICERs have important shortcomings. Deciding what other intervention the intervention under consideration is incremental to isn’t always straightforward (Drummond et al. 2015). Even having got the comparison correct, ICERs still don’t tell us anything about scale of the benefits (or harms) to population health of including a cost-effective (or not cost-effective) intervention. Table 2 incorporates information about the patient population.
Net impact. Size does matter
Knowing just how much health would be generated at the population level by providing an intervention would be in Ukraine might be useful if, for example, lobbyists are in favour of another drug, which isn’t cost-effective. Being able to quantify the actual scale of the benefit of choosing the right option can help communicate decisions to those who matter – key stakeholders, decision-makers in government, and ultimately, the people who stand to reap the benefits – patients. Information about the scale of benefits especially matters in situations where all cost-effective interventions cannot be feasibly implemented, for example, if hospitals, equipment or human resources are limited, and we must prioritise from within a set of cost-effective interventions.
The scale of benefits to the population can be expressed in terms of health (i.e., net health benefit: net QALYs gained or DALYs averted) or the equivalent financial resources (i.e., net monetary benefit: the financial value to the health care system).
- Net health benefit is the difference between the health gained by an intervention and health that could have been gained if the money required to deliver it had been spent on other interventions. If the intervention saves resources, it is the health gained by the intervention plus the health that can also be gained by including other interventions with the cost savings offered.
- The financial value to the healthcare system (the value of the intervention expressed in monetary terms) is the amount of additional healthcare resources that would be required to deliver the equivalent net health gained with other interventions (Claxton et al. 2016).
Using the midpoint of the range of estimates of the marginal productivity of the Ukrainian health care system from Ochalek et al (2017) and Woods et al (2016) scaled to 2015 USD, $1,180, it is possible to estimate net health benefit and the financial value to the health care system. Table 1 reports these values per patient for four hypothetical interventions. Intervention 1 has the lowest ICER, but has lower incremental health benefits than 2 and 3. Interventions 2 and 3 have the same ICER (B), but 3 offers greater incremental health gains (D) than 2 (although at a higher cost, C). These differences in per patient costs and benefits are reflected in the per patient net health benefit (E) and financial value to the health care system (F) where the ranking of interventions from highest to lowest net benefit is not necessarily the same as the ranking by ICER.
Table 1. Per patient net benefits or losses of interventions
| A | B | C | D | E | F |
| Intervention | ICER ($) | Per patient cost ($) | Per patient benefits, $ | Net health benefit per patient, $
(D-C/945) |
Financial value to the health care system per patient ($)
(945*D-C) |
| 1 | 500 | 50 | 0.10 | 0.05 | 44.5 |
| 2 | 750 | 262.5 | 0.35 | 0.07 | 68.25 |
| 3 | 750 | 375 | 0.50 | 0.10 | 97.5 |
| 4 | 2500 | 2,500 | 1.00 | -1.65 | -1555 |
Table 2 reports these measures at the population level, showing the scale of the benefits or losses of each intervention.
Table 2. The scale of the net benefits or losses of interventions to the population
| A | B | C | D | E | F |
| Intervention | Per patient cost ($) | Per patient benefits | Total patients | Net health benefit
(D-C/945) |
Financial value to the health care system ($)
(945*D-C) |
| 1 | 50 | 0.10 | 500,000 | 28,814 | 34,000,000 |
| 2 | 262.5 | 0.35 | 2,000,000 | 255,085 | 301,000,000 |
| 3 | 375 | 0.50 | 500,000 | 91,102 | 107,500,000 |
| 4 | 2,500 | 1.00 | 15,000 | -16,780 | -19,800,000 |
If intervention 2 was delivered to all patients in need of it, it could be expected to generate a net benefit that is much higher than that which would be expected from interventions 1 or 3. This illustrates the value of accounting for the scale of benefits net of any opportunity cost.
Making good choices
Estimates of the net health benefit and financial value to the health care system of including interventions are critical for ensuring choices are made that improve, rather than reduce, population health overall. Such estimates rely on a good estimate of the marginal productivity of the Ukrainian health care system. Estimates are available based on evidence of the expected health effects of changes in expenditure using cross-country data or extrapolations from previous work (Ochalek et al. 2015; Woods et al. 2016). Few countries to date have estimates the marginal productivity of the health care system using within country data (Claxton et al. 2015; Edney et al. 2017; Vallejo-Torres, García-Lorenzo & Serrano-Aguilar 2016), but these provide possible directions for such research in Ukraine.
Notes
Bertram, M.Y. et al., 2016. Use and misuse of thresholds Cost–effectiveness thresholds: pros and cons. Bulletin of the World Health Organization. [Accessed October 6, 2016].
Bokhari, F.A.S., Gai, Y. & Gottret, P., 2007. Government health expenditures and health outcomes. Health economics, 16(3), pp.257–73. [Accessed November 27, 2015].
Claxton, K. et al., 2016. Informing Decisions in Global Health: Cost Per DALY Thresholds and Health Opportunity Costs, York. [Accessed May 3, 2017].
Claxton, K. et al., 2015. Methods for the estimation of the National Institute for Health and Care Excellence cost-effectiveness threshold. Health technology assessment (Winchester, England), 19(14), pp.1–503, v–vi. [Accessed November 17, 2015].
Drummond, M.F. et al., 2015. Methods for the Economic Evaluation of Health Care Programmes, OUP Oxford. [Accessed April 1, 2016].
Edney, L.C. et al., 2017. Estimating the Reference Incremental Cost-Effectiveness Ratio for the Australian Health System. PharmacoEconomics. [Accessed January 23, 2018].
Gallet, C.A. & Doucouliagos, H., 2017. The impact of healthcare spending on health outcomes: A meta-regression analysis. Social Science & Medicine, 179, pp.9–17 [Accessed January 23, 2018].
Ochalek, J., Lomas, J. & Claxton, K., 2015. Cost Per DALY Averted Thresholds for Low- and Middle-Income Countries: Evidence From Cross Country Data, York. [Accessed February 16, 2016].
Ochalek, J., Lomas, J. & Claxton, K., 2017. Estimating health opportunity costs for LMICs.
Vallejo-Torres, L., García-Lorenzo, B., Castilla, I., et al., 2016. On the Estimation of the Cost-Effectiveness Threshold: Why, What, How? Value in Health, 19(5), pp.558–566. [Accessed February 28, 2017].
Vallejo-Torres, L., García-Lorenzo, B. & Serrano-Aguilar, P., 2016. Estimating a cost-effectiveness threshold for the Spanish NHS, Madrid. [Accessed July 31, 2017].
Woods, B. et al., 2016. Country-Level Cost-Effectiveness Thresholds: Initial Estimates and the Need for Further Research. Value in Health, 19(8), pp.929–935.