Ukrainians nowadays have shorter lives than citizens of OECD countries. In the 1960s the opposite was true. One of the reasons behind it may be unhealthy habits, first of all alcohol consumption, which is very widespread.
Life expectancy is a very useful metric that can in one number give us a lot of information. On face value it just shows how many years a person is likely to live in a country. But it can represent much more than that. In comparative studies, life expectancy is often used as a measure for quality of life, development and technological progress. And the reason for this is that living longer and healthier lives is one of the main goals of people. All advances in technology should have this as an ultimate goal. In this post I look at Ukrainian life expectancy records and try to identify reasons for Life expectancy in Ukraine. Why is it so low?
Figure 1 summarizes the data on life expectancy at birth in Ukraine for the past 85 years. The history of Ukrainian mortality records until 1950 was dominated by a series of crises suffered by the country. The Holodomor, the WWII and famine in 1947 left dramatic marks on Ukrainian population.
Figure 1. Life Expectancy at Birth, Ukraine, 1927-2013
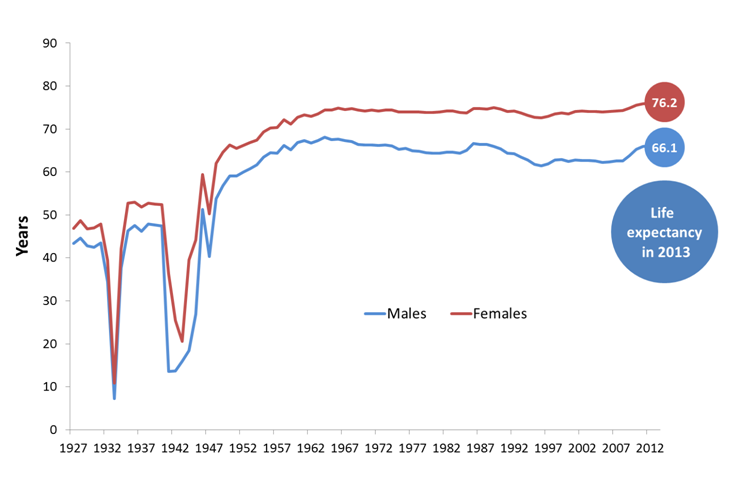
Source: F. Meslé and J. Vallin (2003) for 1927-1991, State Statistics Committee of Ukraine for 1992-20013
However, leaving aside crisis years, between 1927 and 1964 Ukraine experienced considerable improvement in life expectancy – up 24.8 years for males and 27.5 years for females. The improvement, in fact, was so significant that, by the mid-1960s, Ukrainian life expectancy had reached the level of the most advanced countries. In 1964, life expectancy for males/females in Ukraine was 68.1/74.4, which was higher than in Japan (67.6/72.8) and the US (66.8/73.7) (World Bank, WDI). Unfortunately, in 1964 life expectancy for males reached its highest level so far – 68.1 years. Female life expectancy has also stagnated since mid-60’s.
Figure 2 shows life expectancy in Ukraine, Poland and the high-income OECD countries (World Bank definition). The differences in life expectancy change are striking. At the beginning of the period, life expectancy in Ukraine exceeded that in Poland and was also higher than the average in the high-income OECD countries. But after reaching its peak in the mid-1960s, life expectancy in Ukraine declined for most of the period till 1996. Only during the past 17 years has there been an improvement.
Figure 2 Life Expectancy at Birth, Ukraine, Poland and High Income OECD countries 1960-2013*
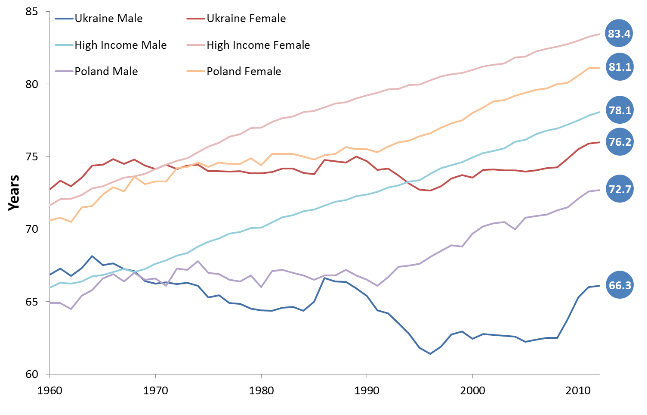
Source: Ukraine — F. Meslé and J. Vallin (2003) for 1960-1991, State Statistics Committee of Ukraine for 1992-2013. Poland and High Income OECD – WDI, World Bank (2013). * 2012 for Poland and High Income OECD
In contrast, the high income OECD countries saw steady and almost linear improvement in life expectancy for both males and females. The difference between Ukraine and Poland was not particularly significant until 1992. After that, the mortality rates in Poland started to decline very quickly, catching up with those of the high income OECD countries, while Ukraine plunged into economic crisis accompanied by increasing mortality.
Not all the age groups in Ukraine had increasing mortality. Infant and child mortality decreased substantially. However, starting with the age group 15-19, in 2000 mortality rates (number of deaths per thousand) were higher than in 1965. Especially strong rise of mortality was observed for working age males. In the age group 45-49, between 1965 and 2000 the mortality rate increased by 137%. The mortality rates in this group have increased across all causes of death, but the largest increase was observed in diseases of the digestive system (262%), heart diseases (229%) and injury and poisoning (204%) (Meslé and Vallin, 2003).
Thus, the highest increase in mortality rates occurred among the so-called preventable or man-made diseases. Many researchers connect it with high alcohol consumption (Meslé and Vallin, 2003; Levchuk, 2005). According to official statistics in 2004, only 2.5% of all deaths were related to alcohol consumption (Levchuk, 2005). However, it is widely accepted that official data do not represent the true situation, and significant proportion of homicides, suicides, deaths from liver cirrhosis, pancreatitis and circulatory diseases are related to alcohol .
Reliable data on alcohol consumption are also unavailable: according to the official statistics, alcohol consumption per person in Ukraine is about 6 times lower than in the European Union (Levchuk, 2005). I personally find it hard to believe. That is why I use other data as a proxy for alcohol consumption. Of death causes directly related to alcohol consumption, one of the most reliable records is of accidental poisoning by alcohol. Even if official records of alcohol consumption are wildly inaccurate, we can track rises and falls in Ukrainian alcohol consumption over time using this proxy. And it cannot directly affect life expectancy given that it accounts for only 0.7% of all deaths in 2000.
On Figure 3 accidental poisoning by alcohol is plotted against male life expectancy at birth. Even a simple glance at this chart is enough to notice that male life expectancy is highly negatively correlated with alcohol consumption – over time, increases in alcohol consumption have been accompanied by decreases in male life expectancy. The coefficient of correlation between these two variables is equal to -95%. Female life expectancy is less correlated with alcoholic poisoning – the coefficient of correlation is -73%, but this is still very high.
Figure 3. Male Life Expectancy at Births vs. Standardized Mortality Rate for Accidental Poisoning by Alcohol, Ukraine, 1965-2000.
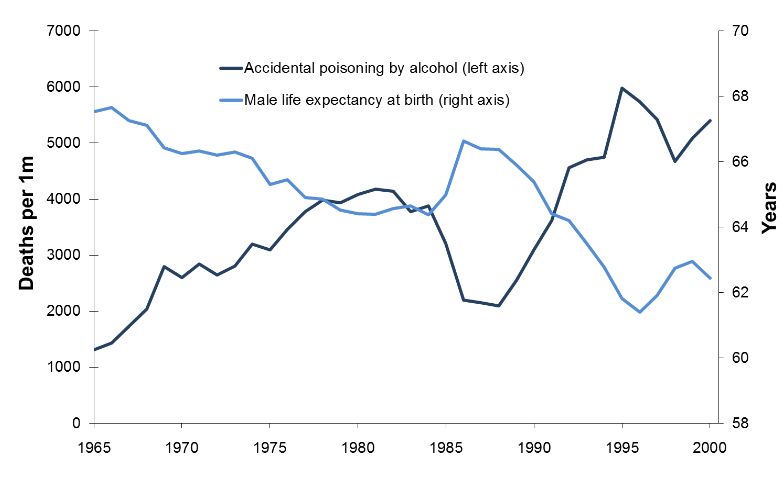
Source: Mortality rate from accidental poisoning by alcohol — Meslé and Vallin (2003). Male life expectancy – Meslé and Vallin (2003) for 1960-1991, State Statistics Committee of Ukraine for 1992-2000
Another point that this chart illustrates is an interesting blip in mid-1980’s in both life expectancy (increase) and accidental poisoning from alcohol (decrease). This is the effect of the anti-alcohol campaign: the so-called “dry law”. This fact is widely known to specialists, but is completely unknown to general public. Even such a short (and very unpopular) campaign had an immediate positive effect on life expectancy and other parameters, e.g. fertility and reduction in crime.
Having said all of this I do not believe that high alcohol consumption is the sole reason for low life expectancy in Ukraine. But I think that it is highly correlated with other factors that cause early death – unhealthy lifestyle, smoking, psychological stress, risky behaviour, etc. To achieve a steady improvement in life expectancy, these multiple risk factors need to be addressed together.
Such a low life expectancy in European country in the 21st century during peaceful (until recently) times should be very embarrassing. During the Soviet time, these statistics were not widely discussed precisely for that reason. For an independent country with an ambition to join the EU, this issue should be a top priority. However, there is still a lack of public discussion and government policy addressing this issue.
Notes
Levchuk, N. (2005) “Demographic Consequences of Alcohol Abuse in Ukraine”, Demography and Social Economy, No. 8, pp. 46-56, in Ukrainian
Meslé, F. and Vallin, J. (2003) Mortality and Causes of Deaths in Ukraine in the 20th Century, Paris, INED, in French
World Bank (2015) World Development Indicators, Database, [Internet] available at http://data.worldbank.org/data-catalog/world-development-indicators

Attention
The author doesn`t work for, consult to, own shares in or receive funding from any company or organization that would benefit from this article, and have no relevant affiliations