We outline an alternative approach to measuring private consumption during war times, using aggregated bank micro-level data for Ukraine. Commercial banks have remained operational during the war, with the exceptions of bank branches in occupied regions. Moreover, the electronic payment system has functioned unceasingly throughout the war period, providing stability of bank payments. Bank card activity suggests that private consumption fell in half during the first month of the full-scale war and has plateaued by June 2022 at 70-74% of its previous-year level.
There has been a significant gap in producing national-level data that captures the level of economic activity in Ukraine in the first half of 2022. As Russia’s invasion continues to ravage many parts of the country, the flow of official statistical data has been erratic. This lack of data and the continued war increase the challenge of assessing Ukraine’s post-war recovery needs (Becker et al 2022).
Respondents to the State Statistical Service of Ukraine surveys have been allowed to postpone their reporting during the period of martial law. For example, monthly sectoral output data and data on enterprise payrolls have not been reported since February 2022. These sets of indicators are required in constructing national output estimates under standard aggregation models employed by economic forecasters.
Business surveys have been limited in their statistical value due to geographic and sectoral gaps. The war has created additional complications. For example, the monthly business sentiment survey by the National Bank of Ukraine was interrupted for critical months of March-May (NBU 2022) and as a result it now points to a general trend rather than specific and comparable levels of economic activity.
Use of other data that could provide good proxies for economic activity in normal times has become inappropriate in war times. In particular, data on value-added tax (VAT) could not be translated into sales estimates as businesses were allowed to switch into a no-VAT regime in March 2022. Electricity consumption, which is another proxy for economic activity, has also become unavailable as power load data has been made secret at the start of the war.
Researchers have explored new approaches to proxying economic activity in Ukraine, for example through the use of social media data (Constantinescu et al. 2022). However, social media usage might change dramatically amid seismic events like the Russian invasion, which makes these data a noisy proxy. Also, social media is often used for non-business reasons, blurring the link between its usage and economic activity.
We propose another method for gauging private consumption, using micro-level bank card data. The benefit of this method is that it has uninterrupted flow of information, and data come from almost all Ukrainian regions, including regions where standard data collection techniques are suspended.
We start by describing the level of disruption across Ukraine, to give us the minimal benchmark for fall in consumption. We then report more precise estimates, while acknowledging some likely biases in the estimation.
Territories Affected by War
The simplest back-of-the-envelope estimate in the absence of reliable statistical or business survey data is mapping out the territories most affected by war activities and over-imposing these affected areas and the severity of damage with their role in national output. This estimate allows to quantify the direct war-related burdens to the economy. The method has limitations as there are indirect hits to the economy like the naval blockade of Ukrainian exports (Blinov and Djankov 2022a). It hence provides a lower estimate of the negative economic consequences of the war.
We employ this territorial method by investigating the eleven Ukrainian regions that have witnessed significant presence of Russian military power (table 1). Using official government data on war activities, we estimate the level of occupation and damage by assigning weights. The darker the color, the stronger the negative impact on economic activity. For instance, regions coded black saw much of their territory occupied by Russian military forces in the respective month. White color does not mean “no war” as all Ukrainian regions suffer from aerial attacks and may see clashes in some areas (like Dnipro or Odesa, not present in this table). Rather, it means that there are no significant troop movements on the ground.
This calculation leads us to conclude that a third of the Ukrainian economy ceased operating in March 2022, after which counter-advances of the Ukrainian army in the north halved this share to 15-18% in April and then further decreased it to an average of 13% in May and June.
Table 1: War-battered regions by months of 2022 and war severity, % of GDP
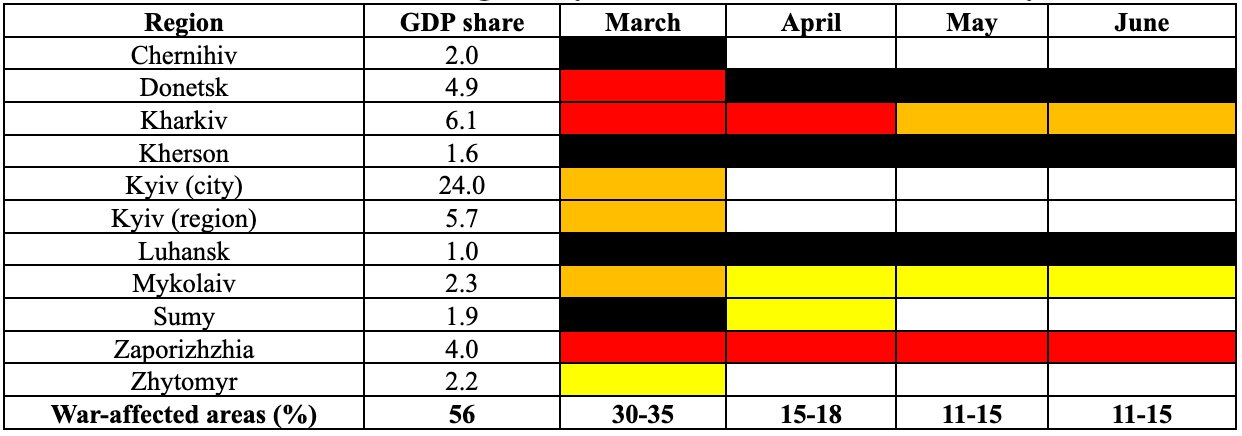
Source: State Statistics Service of Ukraine, authors’ estimates.
However, consumption has decreased even in geographical areas not directly invaded by Russian troops. Accelerating inflation, loss of jobs, exchange rate movements all act to depress economic activity. This means that the bottom-line figures above represent practical upper limits for private consumption estimates: actual decline figures are more dramatic.
Bank Card Transactions
We employ bank card activity data as a proxy for private consumption. In particular, we use monthly point of sale (POS) transaction data from Alfa-Bank, one of Ukraine’s biggest private commercial banks. The data show the exact location where a purchase is made. As of May, this data was in line with bank card transactions reported by Privatbank, Ukraine’s biggest bank (Privatbank 2022). The latter provides some comfort as to the robustness of our estimates for the two banks jointly account for over half of the POS market.
The deleterious effects of the war are easily discernible in the data. Bank card payments fell by half in March, the trough of the war-induced demand decline in Ukraine. A recovery in transactions volume was seen in April and May, and by June transactions volumes stabilized to around 75% of their pre-war monthly level. When adjusted for seasonality and inflation growth over the period, this estimate corresponds to a 40% decrease (figure 1).
We also plot data for the pandemic-affected first half of 2020 to compare the relative depth of the war crisis in consumption with the previous slump, also caused by exogenous factors. In 2020, retail sales, adjusted for seasonality and inflation, surpassed their 90% pre-shock level by June, reflecting swift recovery from the lockdown.
Figure 1: Retail sales trends of 2020 and 2022, January = 100
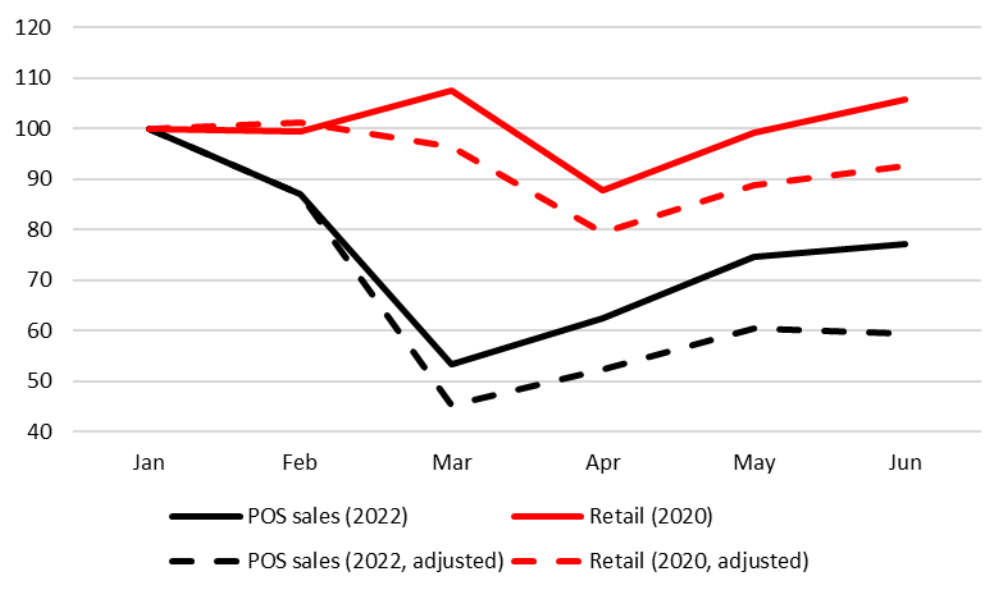
Source: State Statistics Service of Ukraine, authors’ estimates based on micro-level bank transactions data.
The pattern is different during the war. When seasonal and price adjustments are made to the trend estimates, it appears that the second quarter of 2022 plunge in consumer demand was 3.3 times deeper than during the initial COVID19 lockdown in 2020. Household consumption dropped 9.3% year-on-year in the second quarter of 2020. However, applying POS-derived coefficients, private consumption declined by around 30% in the second quarter of 2022, plateauing by June 2022 at around 70-74% percent of consumption relative to the previous-year levels.
The trend has been uneven for various bundles of consumption. While total nominal POS sales in June recovered to remain a little higher than their 75% pre-war level (figure 1), some of their contributors already surpassed their pre-war points, while others are still at less than half of the pre-war value (figure 2). Food purchases at supermarkets have remained rather stable. At the same, sales of clothing and shoes demonstrated fast recovery, while sales of entertainment services (cinemas, bars, etc) and dining have remained depressed.
Figure 2: Alfa-Bank POS sales by key sectors in 2022, January = 100 (non-adjusted)
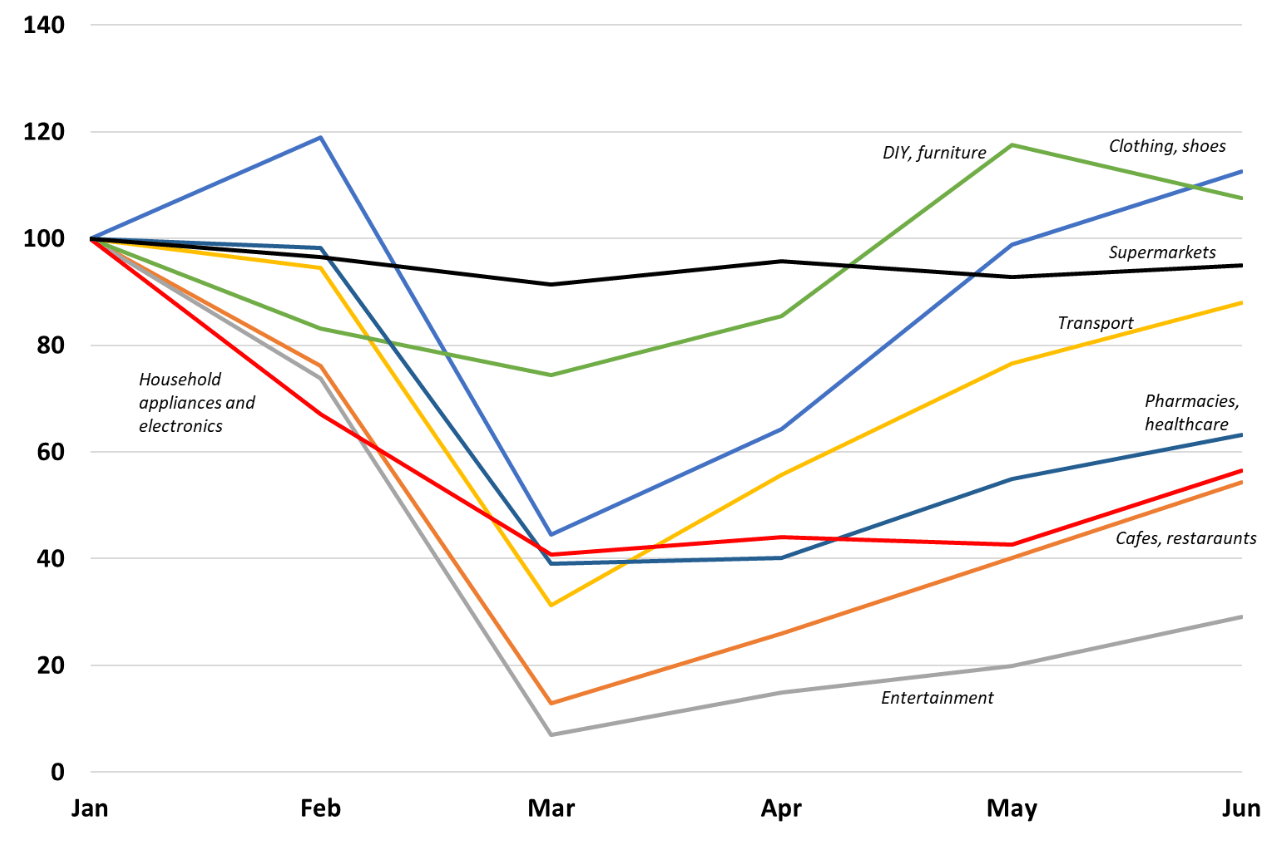
Source: Authors’ estimates based on micro-level bank transactions data. Notes: no seasonal and price adjustments.
The usage of bank card transactions data as a proxy for consumption has limitations. For instance, Ukrainian households use to withdraw more cash during crises and then make payments with that cash. This consideration makes POS-based consumption estimates conservative, particularly for March and April 2022, when much cash had been withdrawn and then supposedly returned to banks via various vendors. It is also worth noting that POS as a payment method has different penetration levels in big cities and small towns, with consumption in the latter being more cash-driven. These two biases tend to work in the direction of making the estimate more conservative and thus serving as the upper bound of the private consumption fall.
In summary, these aggregated micro data suggest that private consumption in Ukraine fell to half its pre-war level in March 2022. In the second quarter, it recovered to 70%, while monthly breakdown indicates that private consumption then plateaued by June 2022 at 70-74% of its previous-year level.
These micro-data estimates of private consumption are significantly affected by the negative effects of the war due to the large refugee wave that followed the start of hostilities (Blinov and Djankov 2022b). There is a statistical challenge for estimating consumption of those over 5 million Ukrainians who fled the country and have not returned yet. They are still Ukrainian consumers, though their consumption counts as imports for the purposes of calculating national accounts. The return of these Ukrainian citizens home is likely to boost consumption and move it away from the current plateau.
Conclusions
The micro-data approach to estimating private consumption during the war in Ukraine shows a dramatic collapse and then some recovery, to 70-74% of its previous-year level. The recovery has some similarities with the path in the aftermath of the COVID19 pandemic, albeit from a much deeper trough and with a much slower pace, due to obvious distinction in the nature of the two crises. In particular, the difference between the two events is the large refugee wave, which has not yet subsided and creates significant uncertainty about the future recovery trend. These first estimates suggest that Ukraine might indeed be poised for a slow recovery path (Blinov and Djankov 2022c).
The use of micro data may be warranted in calculating other parts of national accounts too, for example net exports and government investment. For the former, bank card data from Ukrainian refugee accounts can improve the import estimates, while data from public procurement contracts can shed light on government investment (Bosio et al 2022). These estimates are only imperfect substitutes for standard government statistics, which hopefully return to normal production in the near future.
References
Alfa-Bank, Private consumption recovery slowed down in June (in Ukrainian), 5 July 2022.
Becker, T, B Eichengreen, Y Gorodnichenko, S Guriev, S Johnson, T Mylovanov, K Rogoff and B Weder di Mauro (2022), “A Blueprint for the reconstruction of Ukraine”, VoxEU.org, 7 April.
Blinov, O and S Djankov (2022a), “Restarting Ukraine’s Agricultural Exports,” VoxEU.org, 10 June.
Blinov, O and S Djankov (2022b), “Ukraine’s Deepening Population Challenge,” VoxEU.org, 28 June.
Blinov, O and S Djankov (2022c), “Ukraine’s Recovery Challenge,” VoxEU.org, 31 May.
Bosio, E, S Djankov, E Glaeser, and A Shleifer (2022), “Public Procurement in Law and Practice.” American Economic Review, 112 (4): 1091-1117.
Constantinescu M, K Kappner, N Szumilo (2022). “Estimating the short-term impact of war on economic activity in Ukraine,” VoxEU.org, 21 June.
NBU (2022), Monthly Business Outlook Survey, National Bank of Ukraine, June 2022.
Privatbank (2022), Consumer market recovery: In May, Ukrainians purchased more food and appliances, visited cafes and restaurants and paid with cards (in Ukrainian), 16 June 2022.
Attention
The authors do not work for, consult to, own shares in or receive funding from any company or organization that would benefit from this article, and have no relevant affiliations