Ukraine’s logistics is by far more expensive by international standards. The World Bank 2016 Logistics Performance Index (LPI)[1] ranks Ukraine 80th among 160 countries, down from 61th place in 2014. Its LPI score is almost 55% lower than the value of the top performer, Germany (2.74 vs. 4.23).
Ukraine’s competitors in agriculture also outperform, USA and Argentina’s LPI scores are 3.99 and 2.96, correspondingly. {x} Poland, Ukraine’s neighbor and 33d in the LPI ranking, outperforms Ukraine in all components of the LPI. Port infrastructure, which is a part of logistics infrastructure and a focus of our paper, also performs quite badly on international rankings. Per the World Economic Forum Quality of Port Infrastructure measure[2], Ukraine’s score was only 3.2 out of 7 in 2016, down from 4 in 2012. In other words, business executives’ perception of Ukraine’s port facilities is more than moderate and it’s deteriorating. Ukraine’s competitors’ scores in this ranking are much higher (see Figure 1).
The above facts about Ukraine’s performance in various logistics infrastructure related rankings corroborates well with a finding of the recent study of the World Bank (2015). Among other things it shows that the costs of moving grain from Ukrainian farms to the Black Sea ports are approximately 40% higher than costs for comparable logistics in France and Germany, and 30% higher than costs in the United States. As a result, agricultural producers in Ukraine receive lower shares of world market prices and thus forgone revenues due to inefficient logistics in the country. According to the same World Bank (2015) study, if Ukrainian agricultural producers could get the same farm gate price as their US colleagues, they would earn additional US$ 1.6 billion per year for wheat and maize alone. Other exporting sectors (iron ore, metallurgy) face similar losses (see in the paper below). As far as imports is concerned, inefficient logistics makes consumers pay higher prices and thus decrease their purchasing power.
Figure 1 The Quality of Port Infrastructure scores for selected countries, 2016
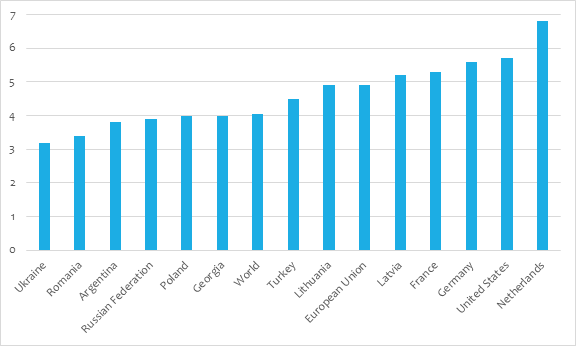
Source: World Economic Forum
Port costs especially high in Ukraine
Port costs seem to be especially high in Ukraine compared to its competitors. As Figure 2 shows, grain traders, for example, incur significantly higher costs at ports (black chunk of bars) compared to their competitors in the EU and US, i.e. their costs are higher almost by a factor of 3. Below we show the main contributors to the high port costs and focus in the following on one area where the Government has control over the pricing and could get rather quick reductions.
Port costs in general one can divide into those related to handling the cargo and those related to serving the vessels at port. Cargo handling costs cover the costs of terminal load/discharge operations, storing, vessel load/discharge operations, certification and forwarding fee etc. Vessel servicing costs are related to a call and stay of a vessel in the port of loading, agent fees and any additional expenditures that are negotiated in a charter (number of ports of loading, number of loading berths, additional expenses connected with shifting the vessel, etc.). These costs are contained in so-called vessels disbursement account and port charges make up a considerable share in it. Figure 3 demonstrates some examples of a breakdown of total port costs into cargo and vessels expenditures for key export products of Ukraine (see Figure 4). Of course, all these expenditures vary from port to port and depend on vessels’ tonnage capacity, but it would be relatively safe to assume that port charges make up on average 20 to 50 % of the total port costs for key Ukraine’s commodities.
Cargo handling expenditures or prices are market based in Ukraine and the government has little leverage to influence them in the short run. The answer to the question why cargo handling expenditures component is more expensive in Ukraine’s ports requires additional analysis and it is out of the scope of this paper, it is a question of competition between port terminals, their handling capacities, access of third parties, etc. But the general trend in cargo handling expenditures is downwards. Grain port terminal capacities increased from 32 million tons to nearly 52 mln tons over the last 5 years and cargo handling prices decreased from USD17-18/t two years ago to USD11-13/t today. Port charges, on the contrary to cargo handling prices, are established and regulated by the government, i.e. by the Ministry of Infrastructure of Ukraine/Ukrainian Sea Port Administration and this is where the government can decrease the export/import logistics costs via decreasing its port charges.
In the following we will take a closer look at the sea port pricing practices in Ukraine and how does it compare to the best international practices. We also demonstrate to what extend port tariffs could be reduced in Ukraine.
Figure 2 Wheat Logistics Costs in Ukraine compared to other countries (US$/t, 2010)
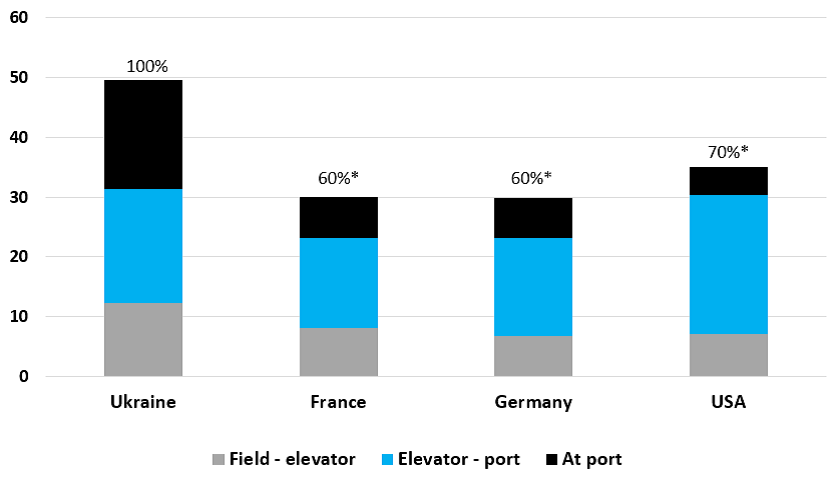
Source: World Bank (2015); Note: * – % of the costs in Ukraine
Figure 3 Port costs breakdown for key export products from Ukraine, 2016
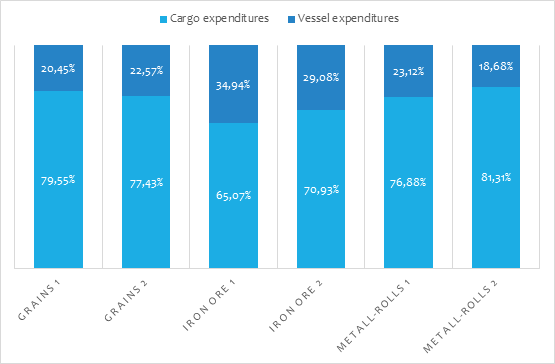
Source: Own data, USPA; Note: Grains/Iron Ore/Metall-Rolls 1 or 2 indicate port costs in different ports
Figure 4 Sea ports export cargo traffic in 2013-2016, in 000 tons
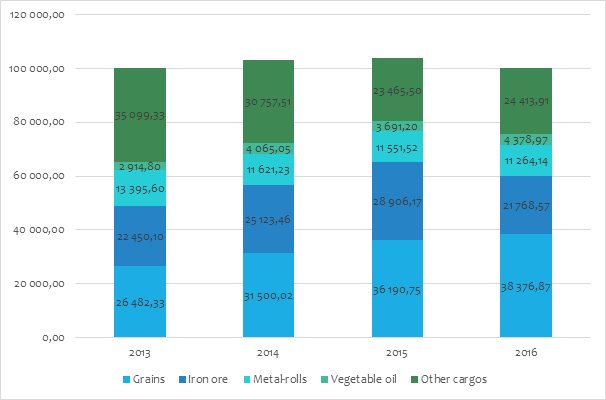
Source: Own presentation using USPA data
Sea Port Tariffs in Ukraine
1.1. Ukraine has too many port tariffs
The Ukrainian ports collect income from at least fourteen to up to twenty tariffs[3]. They consist of:
- Seven main tariffs – tonnage dues, light dues, berth dues, canal dues, anchorage dues, administration dues and sanitary dues – are established by the Ministry of Infrastructure/Sea Port Authority of Ukraine (USPA). They are paid mainly to the USPA (except light dues is paid to the State Enterprise Derzhhidrografia and administration dues is paid to the State Budget of Ukraine) and they dominate in the structure of the vessel call costs, i.e. 60% to 70% (see Figure 5).
- Special services tariffs – VTSM, pilotage and ice breaker – are also regulated
- Another five tariffs – towage, boatmen dues, Harbor Master fees, port information fees, watch keeping services and sealing of output valves are paid to other agencies, they are not regulated.
Figure 5 Example of Payments by a Panamax Dry Bulk Carrier at Ukraine’s Ports, in US$
Source: Own presentation using shipping agent data. The figures are based on a call by a Panamax vessel of about 65,000 DWT and 45,000 GT.
The structure of the main tariffs is only partly consistent with that elsewhere in the world, where charges have generally developed along similar lines. In particular, tonnage dues, towage, pilotage and sanitary dues are standard charges. But, canal/channel dues are less common in other countries, while seven others – administration, VTMS, boatmen dues, harbor master fees, port information fee, watch keeping service, sealing of output valves – are unusual. Two largest European ports – Rotterdam and Antwerp – have only three significant charges in their tariff schedules collected by Port Authority, while towage and pilotage dues are paid to private companies. The trend in advanced economies is towards fewer and simpler tariffs.
1.1. The levels of Ukrainian port tariffs are well above those at comparable ports elsewhere
There is a large body of evidence that Ukraine’s port tariffs are well above those at comparable ports elsewhere in the world. Container ships carry most Ukraine’s imports in terms of value, and the main container shipping lines confirm that Ukrainian port authority tariffs are very high by international standards. An example of port costs based on a typical container ship’s itinerary in the region concludes that Ukraine’s tariffs are over 2.5 times as high as the average for six other ports in the region (see Table 1) .
Table 1 Port Charges based on a typical container ship’s itinerary
| Port | Country | Payments per call, in 000 US$ |
| Odessa | Ukraine | 157 |
| Constanza | Romania | 71 |
| Port Said W | Egypt | 54 |
| Port Said E | Egypt | 50 |
| Sokhna | Egypt | 67 |
| El Dekheila | Egypt | 47 |
| Evayp | Turkey | 75 |
| Ambarli Kumport | Turkey | 67 |
Source: based on calls by a 95,000 GRT container vessel at eight ports in the region
Exporters of bulk products also confirmed that Ukrainian port tariffs were far above those of its competitors. Table 2 shows that Ukrainian exporters are paying more than twice as much as it competitors in other countries and seven times as much as the most competitive ports.
Table 2 Comparison of Iron Ore Port Charges for a Cape Size Dry Bulk Carrier
| Port | Country | Payments per call, in 000 US$ |
| Yuzhny/TIS | Ukraine | 420/300 |
| Hedland | Australia | 145 |
| Dampier | Australia | 145 |
| Seven Islands | Canada | 130 |
| Port Cartier | Canada | 125 |
| Itaguai | Brazil | 125 |
| Narvik | Norway | 111 |
| Tubarao | Brazil | 103 |
| Saldanha Bay | South Africa | 85 |
| Goa | India | 45 |
| Nouadibou | Mauritannia | 40 |
Source: data of the major iron ore exporter
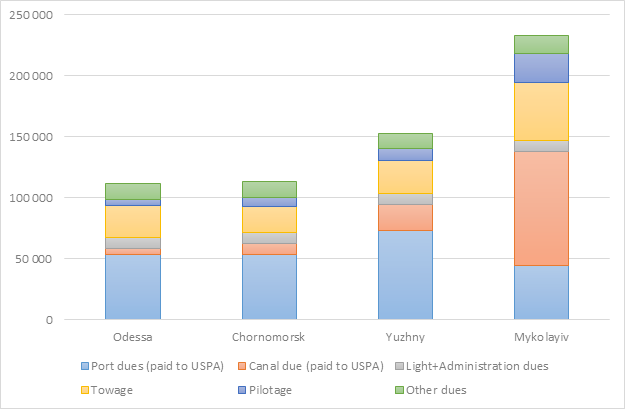
Smaller bulk carriers, however, do not always have to pay much more in Ukrainian ports than at other top ports in the world (see Figure 6), two of the Ukrainian ports (Nibulon and Mykolaiv) are about four times as expensive as the European ports. But Odessa, for example, is only about 45% more expensive. The reason is that well over half of the Nibulon and Mykolaiv costs consist of channel dues and tug charges, which are high because the ports are located at the end of long canals (see Figure 5).
Figure 6 Port Charges for a Panamax Bulk Carrier (60,000 DWT)
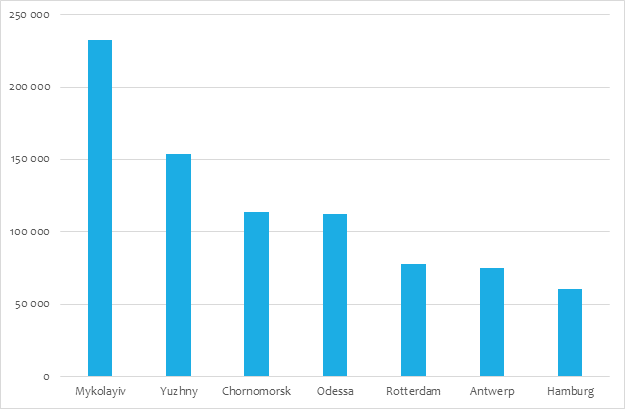
Source: Own presentation using shipping agent and exporters’ data
How to Reform Sea Port Tariffs in Ukraine
1.1. Approaches to port pricing
The discussion in the above sections makes a strong case for revising the sea port tariffs in Ukraine and making them competitive with the ports elsewhere in the region and in competing destinations.
Academic literature offers several options towards port pricing (Acciaro, 2013)[4], which are:
- Cost-Based Tariffs, whereby Port Authority are in practice usually expected to cover their operating costs and earn a moderate return on assets. There are, however, different sets of costs on which tariffs can be based, i.e. on average, variable or marginal costs. To safe the space, the arguments in favor for the last two, however, are often – although not always – In practice, average cost-based port pricing is the dominant approach worldwide – although it will be argued later that it should be blended with commercial or demand based considerations, where appropriate, especially where traffic is price elastic.
- Demand-based/ commercial/ market based/ “what the market will bear” Tariffs, whereby tariffs are set on the need to compete with neighboring ports. The need to compete commercially with other ports often requires deviations from cost-based tariffs, which is a common practice in ports; usually it is implemented via applying a discounting of some tariffs to attract traffic, especially footloose transit or transshipment traffic, away from other ports.
- Other value-based approaches, including Ramsey pricing and ad valorem pricing, base port tariffs on the value of the cargoes rather than costs of operation, exploiting the willingness or ability of some cargo owners to pay a high price for a service or a facility – and using the proceeds to subsidize lower prices to low value cargoes that would not be able to bear port charges based on average costs. To cut the long story short, however, despite encouragement by academics, value based or Ramsey pricing has not been adopted in ports.
- Incentive pricing to promote the efficient use of port facilities – for example, (i) by charging high tariffs to prevent cargo owners using the port for storage that might be cheaper than storage outside; or (ii) to deter ships from lying idle at berth when not handling cargo. In practice, some port authorities do sometimes use the first measure to reduce the use of scarce port land, especially where storage is expensive outside the port. But the second measure did not find any significant use whatsoever
- Congestion pricing. Although the concept and rationality of congestion pricing is well understood, it has only a minor role in practice at ports. Reasons are the following: 1) introduction of congestion pricing would be a bad indication for port users of a failure of the port to invest in its infrastructure; 2) in practice, congestion charges in ports are imposed on the port, not by the port. It is standard practice worldwide for the shipping lines to impose a surcharge on the freight rate if they have to wait for berths.
To conclude, the average cost-based approach is the most widely used approach to port pricing and that Ukraine should adopt it as the dominant model in revising its port tariffs. This basic approach, however, should be complemented by demand-based refinements, considered on a case by case basis, after reviewing competition from other ports and the scope for winning national, transshipment and transit traffic. The analysis should be carried out in conjunction with terminal and inland transport operators, both of whose costs are greater than those of the port authority.
Scope for reduction of sea port tariffs
The best starting point for understanding why Ukrainian port tariffs are high is the Financial Statements of the Ukrainian Sea Port authority (USPA), which shows revenues from sales in 2016 at UAH 7.3 billion compared with reported costs of only UAH 2.6 billion (see Table 3), i.e. the revenues exceed the costs by a factor of 2.8. Very similar picture is observed in previous years, so it could therefore be inferred prima facie that tariffs could be cut by at least 2 times and still cover costs.
Table 3. USPA Income statement and Port Tariffs Revenues and Costs, 000’UAH
| Income statement, 000’UAH | 2013* | 2014 | 2015 | 2016 |
| Net revenue | 1,870,928 | 4,002,291 | 6,810,663 | 7,297,604 |
| Cost of sales | (826,932) | (1,396,365) | (1,946,733) | (2,633,760) |
| Gross profit (loss) | 1,043,996 | 2,605,926 | 4,863,930 | 4,663,844 |
| Revenue/Cost of sales ratio | 2.26 | 2.87 | 3.50 | 2.77 |
| Port tariffs: Revenues and Costs | ||||
| Accrued revenues from port dues | 1,107,851 | 2,706,558 | 4,918,959 | 4,946,145 |
| Costs | 1,421,021 | 1,517,993 | 1,326,079 | 1,835,063 |
| OPEX excl. repair costs | 328,058 | 636,604 | 960,057 | 1,271,436 |
| Repair of fixed assets | 8,852 | 27,526 | 67,038 | 120,389 |
| Prepayment for goods, works and services | 121,276 | 13,351 | 33,408 | 57,825 |
| CAPEX | 923,898 | 729,397 | 143,900 | 326,559 |
| Cash repayments of amounts borrowed | 38,937 | 111,115 | 121,676 | 58,855 |
| Expected value of income tax | 317,639 | 866,734 | 1,644,823 | 2,862,135 |
| Port tariffs revenues/Costs ratio | 0.78 | 1.78 | 3.71 | 2.70 |
| Port tariffs revenues/Costs (w/o CAPEX) ratio | 2.23 | 3.43 | 4.16 | 3.28 |
| Port tariffs revenues/Costs ratio (only 50% of CAPEX is included) | 1.16 | 2.35 | 3.92 | 2.96 |
Source: Own presentation using USPA data; * not for the full year, because USPA was established in the middle of 2013, therefore financials for 2013 look unusual compared to other years
More detailed look at revenues and costs associated with port tariffs confirms that there is a significant scope of reduction of port tariffs. Table 3 shows that if all costs (opex and capex) are included, then the tariffs could be cut also by at least a factor of two. If inly OPEX is accounted for, one reach more significant reductions, i.e. by more than 3 times. If only 50% of CAPEX is to be recovered from port dues, port tariffs could be also then cut by more 3 times.
Table 4 shows a scope for tariffs reduction for each individual port tariffs, considering the revenues they generate and how much costs are associated with each of the tariffs. Resulting ratios are indeed impressing. For example, the revenues exceeded the corresponding costs for the anchorage due by more than 9 times in 2015.
It worth also mentioning, that little of the USPA’s large mark-up over costs is retained for port investment (CAPEX). Most of it goes to the state budget in the form of corporate tax and dividends[5], USPA is always on top of list taxpayers of Ukraine. As in many countries that have port revenues charged in dollars the port authority is treated as a cash cow by the Government.
Table 4. Individual Port Tariffs Revenue to Costs ratio
| Tonnage Dues | 2013 | 2014 | 2015 | 2016 |
| Port tariffs revenues/Costs ratio | 1.63 | 2.97 | 4.18 | 3.70 |
| Port tariffs revenues/Costs (w/o CAPEX) ratio | 3.87 | 3.54 | 4.23 | 3.90 |
| Port tariffs revenues/Costs ratio (only 50% of CAPEX is included) | 2.29 | 3.23 | 4.21 | 3.80 |
| Berth Dues* | ||||
| Port tariffs revenues/Costs ratio | 0.22 | 1.18 | 1.09 | 0.63 |
| Port tariffs revenues/Costs (w/o CAPEX) ratio | 0.90 | 1.50 | 2.02 | 1.23 |
| Port tariffs revenues/Costs ratio (only 50% of CAPEX is included) | 0.35 | 1.32 | 1.42 | 0.83 |
| Anchorage Dues | ||||
| Port tariffs revenues/Costs ratio | 4.44 | 7.02 | 9.47 | 3.07 |
| Port tariffs revenues/Costs (w/o CAPEX) ratio | 4.49 | 7.07 | 9.53 | 3.58 |
| Port tariffs revenues/Costs ratio (only 50% of CAPEX is included) | 4.46 | 7.04 | 9.50 | 3.31 |
| Channel Dues | ||||
| Port tariffs revenues/Costs ratio | 0.57 | 1.20 | 4.76 | 3.24 |
| Port tariffs revenues/Costs (w/o CAPEX) ratio | 1.75 | 4.70 | 5.13 | 3.48 |
| Port tariffs revenues/Costs ratio (only 50% of CAPEX is included) | 0.86 | 1.92 | 4.94 | 3.36 |
| Sanitary Dues | ||||
| Port tariffs revenues/Costs ratio | 1.12 | 1.25 | 1.76 | 1.05 |
| Port tariffs revenues/Costs (w/o CAPEX) ratio | 1.12 | 1.28 | 2.11 | 1.81 |
| Port tariffs revenues/Costs ratio (only 50% of CAPEX is included) | 1.12 | 1.27 | 1.92 | 1.33 |
Source: Own presentation using USPA data; berth due does not include a special berth service fee that is been charged by USPA separate from much smaller berth dues
The scope for tariff reductions could be even higher if:
- Staff numbers were to fall eventually towards international benchmarks because of port reforms (privatization, slimmer port authorities, etc.) adopted elsewhere in the world. The average number of staff in European port authorities is now only about 230 (for average cargo volumes of 13 million tonnes), while USPA employs about 8000 workers for only slightly more than 100 million tonnes of cargo flow.
- Depreciation allowances were to be reduced further to take account of the fact that not only channels but also breakwaters and some berths do not usually get replaced in practice. This applies most of all to ports channels (i.e. entrance channels at ports) and canals (i.e. artificial waterways outside ports). Therefore, no allowance for channels is to be included in the depreciation calculation. Strictly speaking, further reductions should be made for breakwaters and berths which will not be rebuilt, but his will require detailed analysis of the ports’ asset values. Even when major assets are replaced it is common practice internationally to fund the investment as much from loans as from internal surpluses. Consequently, the funds accumulated to cover depreciation are, in practical terms, surplus to requirements.
- There was less dependence on port revenues for investment. It is not common practice for port authorities to fund all the costs of their investments entirely from accumulated port surpluses. They usually borrow some of their funds from banks, governments, international agencies, etc.
A way forward with reforming port tariffs
Recommendations for building a sound foundation for rational tariffs based on modern port operations with reasonable costs in the short, medium and long terms are outlined below:
Short Term
- Adoption of a mission statement that the objective of port pricing should be to minimize the cost of trade to Ukraine rather than to profit the USPA. Ukraine’s’ economic interests have precedence over the port authority’s financial interests.
- Bringing the base for calculating the tariffs in Ukraine into line with ports elsewhere with a switch to Gross Tonnage (GT) as the base for port entry tariffs; the Ukrainian port dues are still charged on the old soviet measure of the ‘conventional volume of a vessel’[6], while the world practice is to charge on the basis of GT[7] of the vessels, ships. The GT base should be applied to tonnage, channel, light, administration, sanitary, and anchorage dues, while berth dues should continue to be based on the tonnage of the cargo loaded and discharged, as in major ports elsewhere.
- Reduction in the number of tariffs. Amalgamation of the port tariffs paid to USPA into about 2-3 tariffs as in top European ports. The need to simplify the tariffs and remove duplication and lack of transparency should be borne in mind during the consolidation the tariff schedule into a smaller number of dues.
- Design cost based tariffs. Blend the cost based approach with the demand-based approach, to allow Ukrainian ports to compete with regional and other export destination ports. Adjustments to the cost based tariffs should be implemented in a close consultation with port users, and they should be implemented without a delay. Port users in Ukraine did concede the limited role of port authority tariffs, but nevertheless suggested that they had some impact. The container shipping lines argued that high port entry costs can rule out double port calls in Ukraine, reduce a line’s number of calls, result in the use of smaller ships which pay less for a call but have diseconomies of size, and use of feeders rather than direct calls in larger ships, plus transshipment charges at hub ports. And the bulk exporters also argued that that it was important to keep port authority charges reasonable in comparison with those at the world’s iron ore, coal and grain export ports. The general perception of the high port authority charges is as export or import taxes, that are borne either by Ukrainian producers (in case of export) or by consumers (in case of imports).
- When designing cost based tariffs, they should cover the following USPA costs:
- operating costs,
- depreciation of some, but not all, assets; and revaluation of assets and assessment of the need for funds for asset replacement,
- a surplus to contribute to future investment. Make decision on what percentage of investment should be funded by port tariffs. Assessment of the need for funds for port investment, and reconsideration of whether tariffs should be set at a level where they can fund all future investment. Ports should be able to borrow for port investments, which is the modern practice in ports elsewhere in the world. As the analysis above show, if
- restriction of the use of the ports’ financial surpluses for purposes other than port investment; especially ending the transfer of port profits to central government funds.
Medium-Long Term
- Continue to seek cost reductions by adopting standard reforms, i.e.
- Privatization of operations, thereby reducing the USPA’s financial requirements
- A staff rationalization program to start to bring Ukrainian ports in line with employment levels at competitive ports elsewhere
- Continued drive to reduce the cost on which tariffs are based
Literature
Michele Acciaro (2013): “A Critical Review of Port Pricing Literature: What Role for Academic Research?” The Asian Journal of Shipping and Logistics, Volume 29, Issue 2, August 2013, Pages 207-228
World Bank (2015): Shifting into Higher Gear. Recommendations for Improved Grain Logistics in Ukraine. Report No: ACS15163, August 2015
Notes
[1] LPI is a perception survey and as such it demonstrates how private sector logistics professionals views logistics services in countries they operate.
[2] World Economic Forum The Quality of Port Infrastructure is an indicator (2.04) of the Global Competitiveness Index and it measures business executives’ perception of their country’s port facilities. Scores range from 1 (port infrastructure considered extremely underdeveloped) to 7 (port infrastructure considered efficient by international standards).
[3] Some shipping lines report paying even more tariffs, up to twenty, see users views on number of tariff later in this Chapter.
[4] Michele Acciaro (2013) review counted 57 articles and books on the subject that have been written over the last forty years
[5] Since 2015 75% of USPA’s profits is transferred to the state budget, this applies to all state enterprises in Ukraine
[6] Calculated in cubic metres from the sum of three values (vessel length, vessel beam and vessel freeboard) shown in the certificate of tonnage (principal dimensions) or in the document that substitutes for it.
[7] The GT of a ship, which is available in the vessel’s documents, is calculated on the basis of “the moulded volume of all enclosed spaces of the ship”, by measuring the total capacity in volumetric tons of 100 cubic feet, adding the underdeck tonnage and the internal volume of tween-decks and deck space used for cargo. The formula to be used is defined in Regulation 3 of Annex 1 of The International Convention on Tonnage Measurement of Ships, 1969, and serves to determine the ship’s manning obligations, safety requirements and registration cost as well as port dues.
Attention
The authors do not work for, consult to, own shares in or receive funding from any company or organization that would benefit from this article, and have no relevant affiliations