The company A+S, in association with the KCSA and with support from the World Bank, has conducted the first-ever large-scale survey of Kyiv residents’ movables: who drives in the capital of Ukraine, why they do so, what vehicles they use, and when the driving occurs. Now answers are known to a lot of interesting questions: how many people are there in Kyiv and how many cars do they have; what means of transport are most liked by Kyiv residents; how much time do they spend each day on traveling; and probably the most important question: what should be done immediately to avoid traffic collapse?
Every working day a vast majority of the 4 million Kyiv residents and guests of the capital go on foot or use their own cars or public transport to get to where they work or study or where they need to be for other reasons. Each day they use about 700,000 vehicles, more than 50 pairs of subway trains, over 200 trams, and about 700 trolley-buses and buses, while the number of fixed-route taxis has already almost reached 1,500. Does that infrastructure function effectively, and is it possible to reduce traveling time for millions of Kyiv residents and visitors to the city?
Now that subject can be discussed more meaningfully. In 2015 the consulting company A+S conducted the first-ever survey of Kyiv residents’ movables. As a result, it is now possible to identify the patterns of movement of different population groups for various reasons using vehicles or on foot and to evaluate transport service quality. Knowing where from, where to, and how its residents move, the city can reorganize its transport infrastructure in an optimal way.
Where to, why, and how do Kyiv residents move? How much time does the employable population spend on traveling, and how does this influence the city’s economy?
How was the counting done?
The survey was based on telephone interviews conducted in 2015 by the Kyiv International Institute of Sociology at the request of A+S Ukraine as well as on answers to electronic questionnaires. The quota sample size amounted to 1% of the city’s population, i.e. 30,000 respondents; it was representative and relevant.
Participants in the survey responded to questions about routes, types of transport, traveling time, as well as to socio-demographic questions. All movements of the population that we recorded are differentiated by purpose, or demand layer: from home to workplace, from home to place of study, from workplace to home, etc.
These data are useful for designing a more effective transportation model, for making decisions related to urban planning and transport infrastructure. A model constructed on the basis of collected data shows how the traffic flow is likely to change if a new junction is constructed, a new public transport route is created, or a new shopping and recreation center or residential area is built; it also forecasts the effect of such changes.
Where the people go to
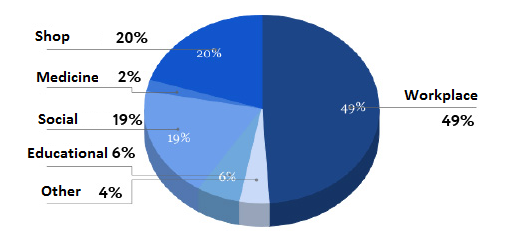
The survey shows that movements to the place of one’s work or study account for 55% of all transport correspondences. Such trips play the key role in transport demand formation, since other types are usually less important for the analysis. For example, trips to destinations such as “shop” are, as a rule, locally oriented and rather short, resulting in a much lower impact on the overall transport system.
Fig. 1. Purposes of Kyiv residents’ trips
What they use
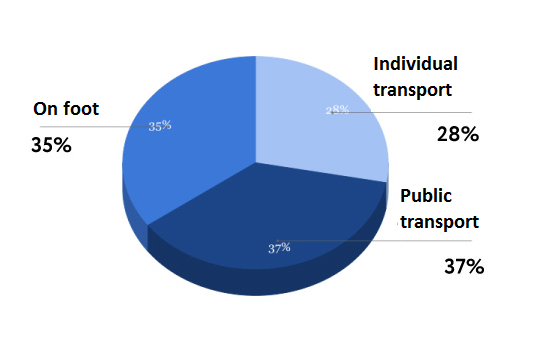
Each day every city resident decides on which type of transport he or she will use for making purpose-oriented trips. Based on the results of the survey, 28% of passengers use individual transport; 37%, public transport; another 35% travel on foot (without using any vehicle). One of the factors citizens take into account is traveling time.
Fig. 2. Breakdown by transport types
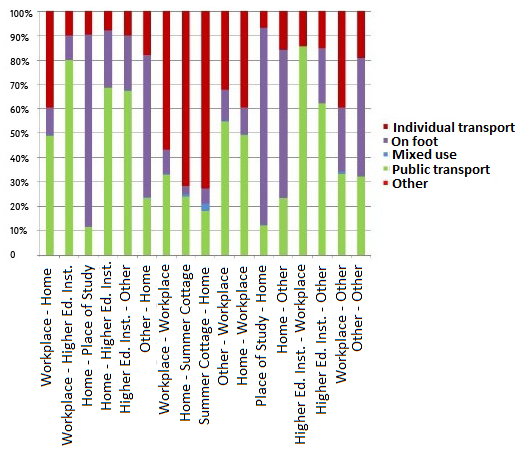
For moving on motorways, public transport is most often used: 57% of all the trips. It is most frequently used for going to/from educational institutions; this can partially be accounted for by the relatively low level of income of a large part of students/pupils.
As a matter of fact, such distribution pattern draws a line under the dispute as to the most important actor on the Kyiv roads (public transport vs. automobile) – as to which one of them should be given priority. In view of their passenger capacity and the area they occupy on the driveway, setting up traffic lanes for public transport appears to be well-founded.
Fig. 3. Breakdown by transport types and traveling purposes
At the same time, transport policy should be applied consistently to all traffic participants. Imbalances in favor of any party are, as a rule, counterproductive: one should not focus exclusively on public transport while ignoring individual vehicles, or vice versa.
Kyiv rush hour specifics
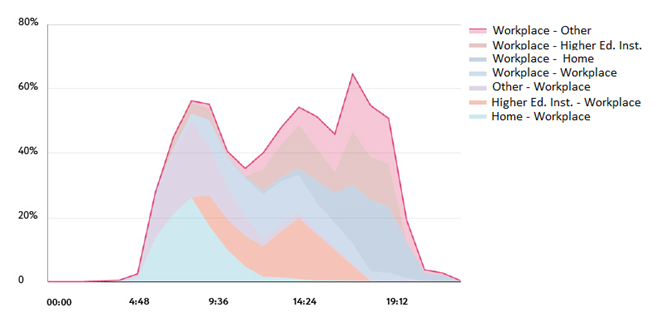
Faced with the existing disproportion in population density and with inadequate transport proposal, city residents lose incredible amounts of time in jams as they travel inside cars as well as inside public transport. The situation is hardest for residents of the most distant areas: they encounter the greatest number of jams. City residents suffer the greatest losses of time in the morning and in the evening, on the way to the workplace and then back home. This is when the rush hours are most pronounced. Although car users give preference to automobiles, referring to comfort and speed to support their viewpoint, this is not so important, really, if the time lost on the way is the same in both cases.
Fig. 4. Distribution of trips by time
The effectiveness of travels can be evaluated on the basis of transportation expenses; these have two components: economic and energy-related. The former pertain to the cost of one working hour of an employee; the latter, to fuel expenses. Thus, an hour of traveling amounts to 60 minutes of non-produced GDP.
As regards public transport users the situation looks somewhat better. They can spend traveling time on self-development or on creative activities; in fact many of us practice this every day. Compared to using one’s own car (having no personal driver), public transport provides benefits.
Moreover, use of public transport to get to the workplace by those who have an own car, should a lot of them start doing so, will result in a number of essential benefits: traffic will become less intense, the risk of accidents will decrease, and the air will be less polluted. However, encouraging Kyiv residents to switch to public transport is by no means a trivial task, judging by the convenience indices of different types of transport (Table 1).
Are there a lot of cars in Kyiv?
Automobilization level is a coefficient reflecting the average number of cars per 1,000 residents. Most frequently, this parameter correlates with the population’s welfare level; indeed, the more people can afford to buy a car, the better is the economic situation. However, sometimes an increase in the number of cars in a city brings down the quality of life for all of its residents including the car owners, for instance if the city cannot accommodate a lot of cars – e.g. New York’s index is lower than that of Kyiv. There is also a reverse side of the coin: a higher number of cars is associated with higher environmental pollution and noise levels as well as with a larger number of expected road accidents.
Kyiv’s level of automobilization is 213 cars. Ukraine’s average level of automobilization is somewhat smaller: 148 cars. This is not much lower compared to the European capitals Berlin (317) and London (345).
Fig. 5. Level of automobilization in some cities of the world
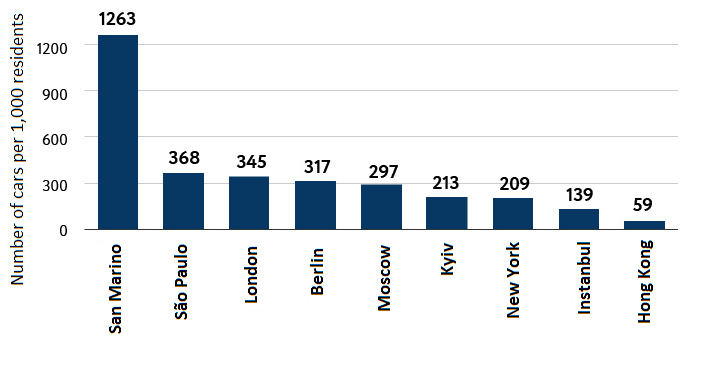
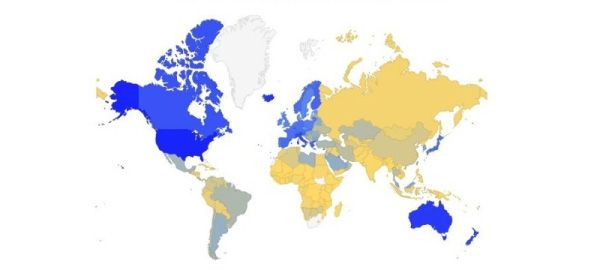
Fig. 6. Level of automobilization in the world’s countries (blue color representing the highest number of cars; yellow color, the lowest)
The results of the survey have also been used to determine the probability of a city resident using a car. If someone has an own car, the probability of a transport correspondence being implemented by car is 88%.
From the viewpoint of rational use of city space, quite important is the car-filling coefficient. If the driver is the only person inside the car, the coefficient equals 1; in case of one passenger it amounts to 2, etc. The average car filling coefficient in Kyiv is 1.5. This is indicative of inefficient use of cars – most frequently for the movement of 1 or 2 persons. This is one of the lowest car use efficiency indices in Europe. For example the index is 1.9 in Hungary and 2 in Slovakia.
This provides another important argument in favor of public transport. A comparison of the sizes of public and individual transport leads us to conclude that, while the total area of three cars equals that of 1 bus, the number of passengers inside those three cars averages 5, whereas in a bus that number is much larger, even disregarding the rush-hour passenger load. This is conducive to attaining the main goal of a successful transport system, which consists in moving the maximum number of passengers from one point to another as fast as possible.
Amount of time spent on traveling
One of the most important factors taken into consideration in road planning is the likely amount of time lost on traveling.
According to DBN 360-92 standards, this parameter must not exceed 45 minutes in cities with a population of over one million. In Kyiv, the average resident spends 35.5 minutes on moving through the city to get to the workplace; the return “workplace-to-home” trip lasts for 36.6 minutes. Those figures are in fact even smaller than required by the standard.
There are, however, a number of nuances. Firstly, the parameter does not take into account the breakdown for particular types of transport. Secondly, Kyiv is noted for an essential disproportion in employable population density: 36% of the population live on the Left Bank, which only provides 18% of the jobs, whereas 64% of the population and 72% of the jobs are concentrated on the Right Bank.
Kyiv residents’ favorite type of transport
When choosing a transport type for traveling, users are most often guided by subjective criteria: predictability of times of arrival and departure, comfort, availability of empty seats, crowdedness and others. Among these criteria, the first place is shared by movement by car and going on foot (4.5 points out of 5), i.e. parameters unaffected by externalities.
Table 1. Generalized transport convenience indices
| Type of transport | Weighted average |
| Car, as the driver | 4.566 |
| On foot to or from a public transport stop (transfer) | 4.522 |
| On foot (no use of vehicles at all) | 4.508 |
| Free bus | 4.314 |
| Car, as a passenger | 4.117 |
| Subway train | 4.066 |
| Funicular | 4.000 |
| Bicycle | 3.999 |
| Taxi | 3.946 |
| Commuter train | 3.897 |
| Tram | 3.876 |
| Trolley-bus | 3.840 |
| Ordinary bus | 3.777 |
| Fixed-route taxi | 3.687 |
| Hitchhiking | 3.284 |
| Motorcycle, motorbike | 3.154 |
In the ranking, public transport is alongside of travels by car and on foot. As was to be expected, the free bus and the subway train are in the lead. In spite of low efficiency, the commuter train is a runner-up to the subway. Next are the tram, the trolley-bus, and the city buses. The fixed-route taxis are the lowest-ranking type of public transport.
Transport efficiency
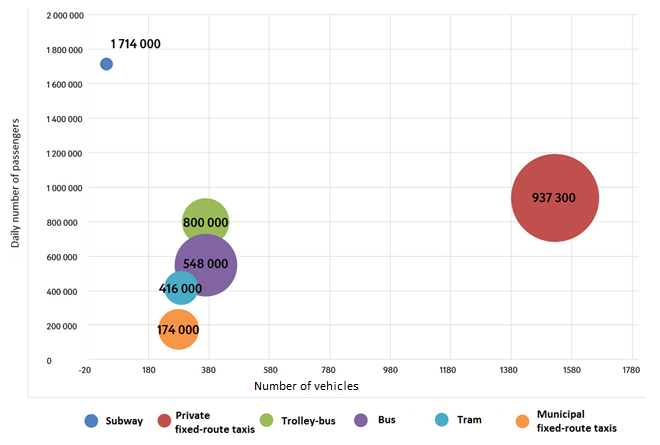
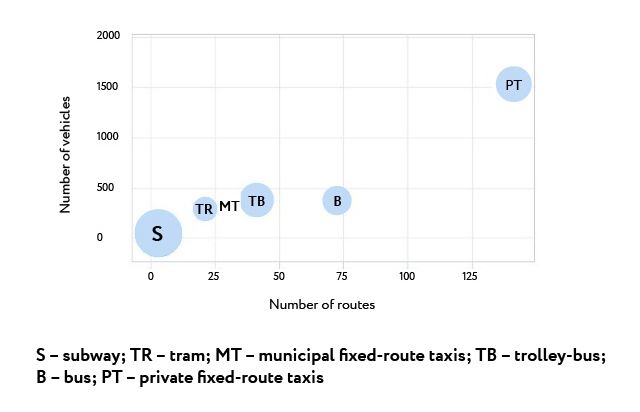
Among public transport types, the highest number of passengers is carried by the city subway (“Metro”). Each day the Kyiv subway is used by 1,714,000 passengers. The runner-up is the private fixed-route taxi (“marshrootka”). These serve 147 routes and 937,000 passengers. The third most used type of transport is the trolley-bus.
Fig. 7. The passenger load of city transport in the capital
Sustainable development concept
The survey of Kyiv residents’ movables was conducive to working out a concept for sustainable development of Kyiv public transport; this concept was created by Integrated Transport Planning Ltd. (ITP) in association with the Kyiv City State Administration (KCSA) at the request of the World Bank.
As a result, the KCSA and ITP developed three scenarios for improving the transport situation in the city: short-term scenario “A”, medium-term “B” and long-term “C”.
Scenario “A” envisages minimum changes to the city’s current infrastructure: cancellation of 107 routes and introduction of 16 new ones, change of 38 existing routes and departure intervals on 168 routes. As of today, we only have three new routes: buses 114 and 118 and trolley-bus 50.
According to scenario “B”, a lot of work is to be done to create a new infrastructure. Scenario “C” consists in discovering new potential schemes for mass transportation. The Kyiv authorities have not made a final choice of the priority scenario. At present, some financially affordable paragraphs from a random scenario are being implemented.
However, the mere implementation of any one of the scenarios will not essentially improve the situation. The transport sphere problems of the capital must be addressed in a complex way. Kyiv faces a great problem with observance of traffic regulations: chaotic parking on driveways, pedestrian sidewalks and at public transport stops, use of the traffic lanes set aside for public transport, etc. All of this adversely affects not only passenger transportation convenience but also the effectiveness of the entire road network.
Therefore, along with reorganization of public transport, it is necessary to change the system for supervising drivers and holding them liable for offenses. That is the only way to make the city convenient and comfortable.
Design and literary editing by Oleksandr Yaroshchuk, junior analyst for VoxUkraine

Attention
The author doesn`t work for, consult to, own shares in or receive funding from any company or organization that would benefit from this article, and have no relevant affiliations