On July 26, 2015, Ukraine had snap parliamentary elections in district 205, which is in Chernigiv. Two main contenders were Sergiy Berezenko from the pro-presidential party Bloc Petra Poroshenko and Gennadiy Korban from the recently formed party UKROP, rumoured to be sponsored and controlled by oligarch Igor Kolomoyskiy. The election was marred by scandals and accusations of fraud. The Ukrainian democracy is young and fragile, it is critical that elections are conducted in a fair and transparent manner, and that the elected representatives have legitimacy in the eyes of the voters. In this post, we use statistical tools to assess whether there is evidence suggestive of the fraud in elections.
On July 26, 2015, Ukraine had snap parliamentary elections in district 205, which is in Chernigiv. The reason for elections – the president had appointed the representative from the district to lead the regional state administration, vacating the seat. Two main contenders were Sergiy Berezenko from the pro-presidential party Bloc Petra Poroshenko and Gennadiy Korban from the recently formed party UKROP, rumoured to be sponsored and controlled by oligarch Igor Kolomoyskiy.
The election was marred by scandals and accusations of fraud. Media reported that UKROP offered humanitarian support, including food rations to the voters, and that there was a mysterious car full of cash and weapons, possibly related to buying the votes for the pro-presidential candidates. According to the Ministry of Interior, 37 criminal investigations have been opened in connection with these elections, among which 18 concern bribing the voters.
The Ukrainian democracy is young and fragile. It is critical that elections are conducted in a fair and transparent manner, and that the elected representatives have legitimacy in the eyes of the voters. In this post, we use statistical tools to assess whether there is evidence suggestive of the fraud in elections. We do not evaluate whether the campaigning prior to the elections was fair and in accordance with the law (including the incidents mentioned above). Instead, we build on our previous approach and study the distribution of the reported results. Specifically, we use three tests to analyze statistical patterns in reported voter turnout and voting shares to identify instances where tampering with votes was likely. In contrast to the national parliamentary elections in 2014, we have a small sample size–only 83 polling stations–and thus our results should be interpreted with caution. With this caveat in mind, we find no clear indication of fraud in favor of Mr. Berezenko, the winner of the election race.
Test #1.
A popular form of fraud is to “throw in” votes for a given candidate in a handful of polling stations. In this case, one may expect a strong positive correlation between voter turnout and the share of votes for the candidate. In Table 1, we examine if there is a correlation of this type for four major candidates: Berezenko, Korban, Zub, and Andriychenko. We regress the share of votes a candidate gets on the share of registered voters who cast their votes. We find a statistically significant positive correlation for Berezenko and a statistically significant negative correlation for Korban.
Table 1.
| Share of votes for | ||||
| Berezenko |
Korban |
Zub | Andriychenko | |
| (1) | (2) | (3) | (4) | |
| Voter turnout | 0.724*** | -0.332*** | -0.022 | -0.003 |
| (0.144) | (0.078) | (0.035) | (0.042) | |
| Observations | 83 | 83 | 83 | 83 |
| R-squared | 0.242 | 0.213 | 0.004 | 0.000 |
Notes: the dependent variable is the share of votes for a candidate show in the second row. Standard errors are in parentheses. *** and ** denote statistical significance at the 1 and 5 percent level.
These strong correlations suggest that we should examine the voting patterns and turnout more closely. The correlations by themselves do not signal fraud: it may be a genuine fact that in areas where voters are more mobilized the voters prefer Berezenko. Figure 1 shows that a few polling stations had a very high turnout and a very high share of votes in favor of Berezenko. However, these polling stations are tiny: most of these stations had fewer than 20 votes. As a result, such high shares of votes may be just a coincidence and these polling stations do not make any impact at the aggregate level. Yet, even if we downweigh these small polling stations, there is a positive correlation between voter turnout and Berezenko’s share of votes.
Figure 1. Voter turnout and share of votes
How can one differentiate fraud and genuine preferences? We need “benchmark” elections where fraud was likely. The 2012 parliamentary elections were widely perceived as problematic and hence can be used as a basis for comparison. Figure 2 shows the relationship between voter turnout and the share of votes cast for the Party of Regions in Donetsk oblast, perhaps the most problematic region in the 2012 elections. When we compare these results with Berezenko’s results we note a key difference. Turnout in 2012 was approaching 100 percent, while elections in 2015 barely got turnout of 40 percent at standard-size polling stations. The very high turnout in 2012 is suspicious–voters rarely show up at such high rates–while the turnout in 2015 is close to normal.The normal turnout limits the ability of potential perpetrators to “throw in” many ballots which is consistent with limited fraud.
In summary, while there is a positive correlation for Berezenko, there is no clear smoking gun of fraud in his favor but there are potential grounds to be cautious.
Figure 2. 2012 elections in Donetsk oblast
 Test #2.
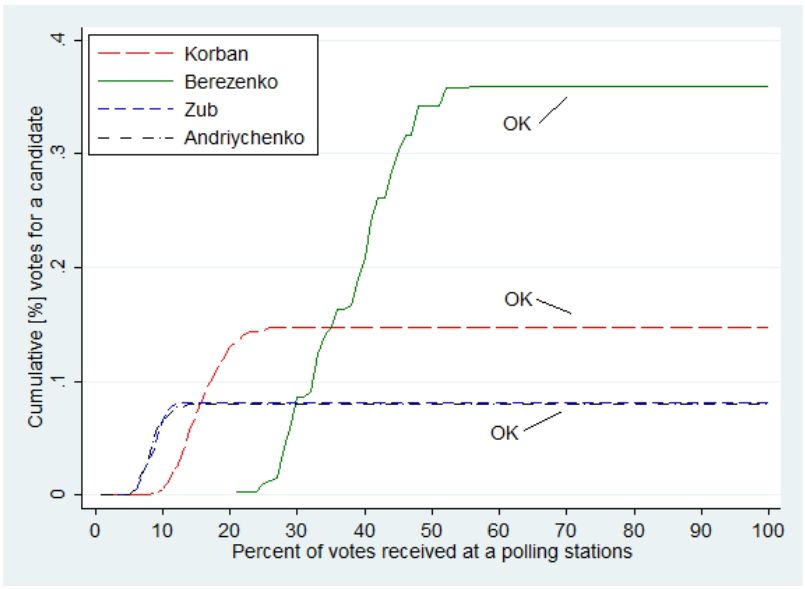
Because fraud is likely to be concentrated in a few polling stations, these polling stations should contribute a disproportionate number of votes in the total number of votes a candidate receives. One can use the following approach to detect this type of fraud statistically. First, for a given candidate, sort polling stations by the share of votes this candidate receives. Second, calculate the cumulative contribution to the total number of votes the candidate receives as a function of the share of votes. In a normal situation, as the share of votes approaches 100 percent, the contribution to the total number of votes should flatten. Intuitively, the candidate can get close to 100 percent of votes only in polling stations with a few voters where it is statically possible that all voters were in favor of the candidate. In polling stations with many voters, it should be highly unlikely that the candidate gets close to 100 percent of votes. Thus, if the cumulative contribution is increasing considerably at the polling stations with close to 100 percent of votes for a given candidate, we should be doubtful. See our analysis of 2012 parliamentary election to see example of such suspicious activity.
Figure 3 illustrates this test. Consider Mr. Berezenko. In most polling stations, he got more than 30 percent of votes. However, there was no polling station where more than 50 percent of votes were in his favor. Hence, the cumulative contribution of polling stations to his total share of votes flattens out at 50 percent. There is no statistical evidence consistent with this type of fraud for any of the major candidates.
Figure 3. Contribution to the total number of votes by polling stations
Test #3.
Physicist Frank Benford found that a simple relation could describe the distribution of first digits in real-life data: in about 30% of cases, the first digit in real-life data is “1”; in about 18% of cases the first digit is “2”, and so on. This relationship was called Benford’s law. While there is no particular reason why voting patterns should obey this law, this statistical regularity has been used often to detect fraud: when perpetrators add or subtract votes at a polling station, they fail to take into account that their actions change the distribution of results at the aggregate level.
Using this approach works best in cases with many polling stations. We have only 83. As a result, we can have some departures from the law simply because combinations of results may be observed by a coincidence. In other words, the power of this test is limited but it is still informative. For example, we can use the distribution of the first digit for the number of registered voters as an additional benchmark.
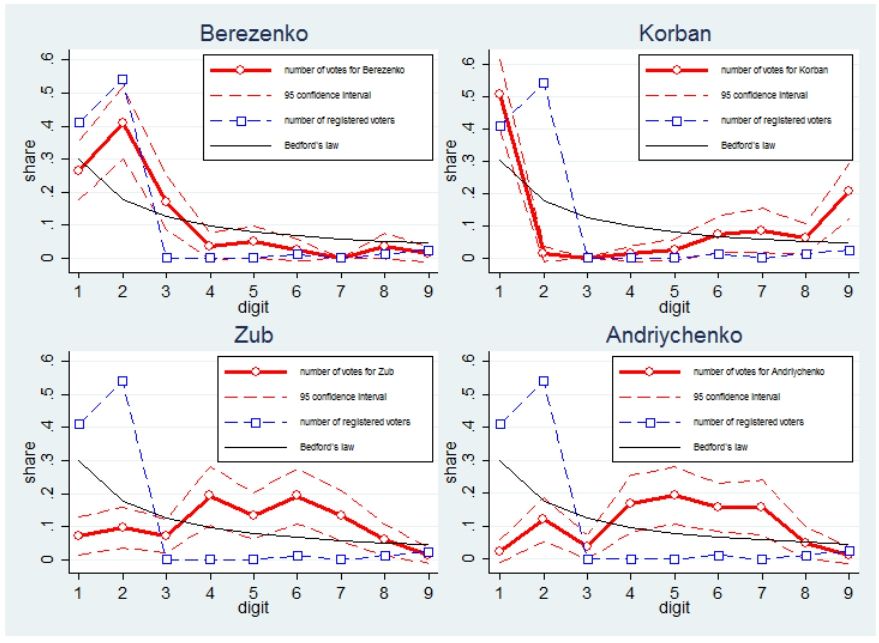
Figure 4 shows the distribution of the first digit for the number of votes across polling stations for four major candidates (red, solid line and 95 percent confidence interval). The blue, dashed line is the distribution of digits for the number of registered voters. The black, solid line is the prediction of Bedford’s law. Again, consider Mr. Berezenko. The shape of the red line is similar to the shape of the blue line and is generally close to the distribution predicted by Bedford’s law. Thus, we have no clear statistical evidence that the distribution of the first digit in the number of votes for Mr. Berezenko is unnatural.
The distribution for other candidates has some minor “unnatural” departures. For example, candidates Zub and Andriychenko appear to have too many 4’s, 5’s and 6’s as the first digit in the number of voters cast for them, while Mr. Korban seems to have too many 9’s and too few 2’s. However, the sample size is small and these could be just random factors rather than malicious activity.
Figure 4. Distribution of the first digit for the number of cast votes by candidate
In summary, many observers felt that elections in Chernigiv were seriously impaired. Perhaps. But, given the combine statistical evidence, we fail to see clear statistical proof of tampering with the vote count. According to our statistical tests, Mr. Berezenko appears to have a clean victory.
Ihor Buinyi (“Democratic Alliance”) disagrees with the conclusions of the post and has written the article Chernigiv Rada Election 2015: The Results Seem to be Manipulated
Attention
The authors do not work for, consult to, own shares in or receive funding from any company or organization that would benefit from this article, and have no relevant affiliations


