Structural Problems:
Analyzing features of the network of owners of the Ukrainian banks
Network analysis is a powerful tool for modeling interactions between economic agents and assessing the stability of financial systems against systemic risk. Financial interdependence is a major issue in the sphere of macro-financial supervision and is central in the discussions concerning prudential regulation policies. Network analysis methods are used to describe the global architecture of cross-border financial flows, analyze spreading of financial "contagion", and to study the dynamics of payments systems and interbank markets. The global financial crisis of 2008-2009, which, due to its strength and coverage, provided fertile ground for the analysis of financial networks during the stressful periods has renewed interest in the use of network analysis instruments.
We continue to study the Ukrainian banking system. In the previous articles, we have analyzed the network of owners of the Ukrainian banks and which financial indicators have a serious impact on the bank's financial health. However, the financial "health" condition of the bank can be determined not only by financial indicators. In this article, we will focus on the network of owners of each particular bank: we will study their structure and identify which indicators distinguish "healthy" (solvent) banks from "sick" (insolvent) ones.
The data on the banks' ownership structure are published on the website of the National Bank of Ukraine. Processed data can be downloaded from the following website: data.voxukraine.org.
Banks’ ownership structure
Why do we need to study the structure of any social network? The structure is related to the efficiency of the entire network or its individual representatives. For example, in business and diplomacy the network structure influences the decision-making, in schools it affects the deviant behavior of students, while in politics it bears an impact on the results of voting. Banks are no exception and their ownership structure can affect the "health" condition of the bank.
Please note that the network structure is not the same as its size. A large network can have a very simple structure, with a few owners directly connected with the bank. On the other hand, a small network of owners can have complicated interconnected ties or break up into separate segments.
Below you can see the ownership structure of the Ukrainian banks. Yellow dots are those banks which can be connected with the owners: legal entities (red dots) and individuals (gray dots). In some cases, one and the same network could include several banks.
Ownership structure of some Ukrainian banks
A bank can be more successful when the ownership structure facilitates cooperation. Owners can attract resources, including useful information, reputation or necessary informal connections. Owners’ actions are easier to coordinate when information circulates between them freely and uniformly. When information is available to all participants, when the interests are clear and the behavior is predictable, it is possible to develop a common view of the problems and deal with them together. On the other hand, when the owners break up into segregated groups, and the connections between them are too complicated, the opposite situation arises. The more disconnected owners are there, the more difficult it is to coordinate their actions. An information asymmetry appears. In addition, existence of isolated groups can result in competitive interests.
In the network analysis, there are many methods for measuring different features of the network structure or its individual members. Some researchers even create tongue-in-cheek "periodic tables" of such methods to emphasize their sheer number.
We examined a number of features that describe the size of the network, its complexity, as well as the owners’ characteristics to study the structure of the owners of "healthy" and "sick" banks.However, we found that the "healthy" banks differed significantly only in four of them.
Table lists some features to illustrate this statement. The table shows their average scores and highlights whether there is a significant difference between the two groups of banks (T-test). A significant difference is observed only in terms of four features: effective size, transitivity, limitation, and the number of groups of four owners. Their meaning will be discussed below.
Average indicators of network features for "sick" and "healthy" banks
| "Sick" banks (82) | "Healthy" banks (95) | |
|---|---|---|
| Number of groups of two owners (diads) | 17.1 | 16.4 |
| Number of groups of three owners (triads) | 1.2 | 2.3 |
| Number of groups of four owners* | 0.1 | 0.7 |
| Network transitivity* | 0.05 | 0.1 |
| Network density | 0.2 | 0.2 |
| Number of components | 7.2 | 7.8 |
| Limitation** | 0.4 | 0.6 |
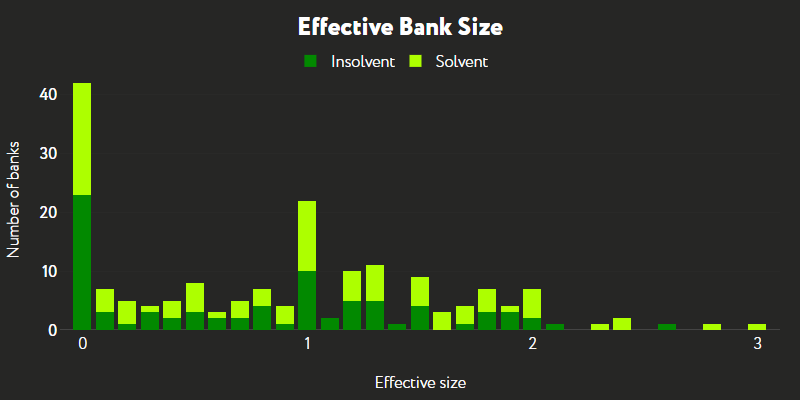
| Difference between effective and real size** | 0.7 | 0.9 |
| Number of owners | 16 | 14 |
| Share of individuals among the owners | 0.5 | 0.6 |
| Agresti owners homogeneity index | 0.8 | 0.8 |
Effective network size. If all owners in the banking network are connected, they have access to the same resources (for example, information) and the value of a new tie drops significantly. Effective size indicates that there are no excessive connections. It is usually measured as the number of connections (links) a bank has minus the average number of connections in the entire network. However, in order to be able to compare different banks, we used a standardized indicator calculated as the difference between the real and the effective sizes of the network. For example, in the report on the "Alpari Bank", the real size of the network will be 3, while the effective size will be 1 (since it is necessary to use only one connection to transmit the information further throughout the network). The standardized indicator (the difference between these two), respectively, will be 2.
Transitivity. A bank owner can have a connection with the other two owners A and B (for example, own a stake in two different companies). In turn, these A and B may be connected with each other, or may not be connected. Transitivity is the probability that connections of A and B will be linked to each other. For example, the report on the "Aksioma Bank" indicates that K. O. Boiko (A) and Sfeno LCC (B), on the one hand, own Kars-Komerts LLC (C), while, on the other hand, they are connected with each other, because Boiko owns 0.1 percent of Sfeno LCC. Thus, A, B, and C are connected with each other.
Limitation. Some owners are connected with each other (as in the above-mentioned case of the Aksioma Bank). However, other owners can be connected only through the bank itself. For example, the report on the Aksioma Bank, states that Alad-Dnepr LLC and Kars-Komerts LLC are connected with the Aksioma Bank, but are not linked with each other. Accordingly, in this configuration, both LLCs can meet only through the bank. But if you look at other owners, you can see that some of them can meet not only through the bank, but also through other connections. For instance, T. A. Chetveryk and Ye. V. Revylo are connected through the Brokinvest-Laert PrJSC. If the owners have an opportunity to communicate directly without the participation of the bank, it imposes limitations on this bank as a connecting unit (hence the name of the feature). Of course, we cannot rule out the possibility that in real life these owners can have other connections which we do not observe. However, our analysis focuses on their bank "meetings" only.
Number of groups of four owners. The bank owners are often divided into different groups. These groups can vary in size. For example, such groups can consist of two (dyad), three (triad), or more owners. Having compared "healthy" and "sick" banks, we will see that the number of dyads and triads in them is, on average, the same. However, when it comes to large groups of four owners, "healthy" banks do have many of them.
It was the "healthy" banks that demonstrated higher indicators by these four parameters. This means that the ownership structure of "healthy" banks facilitated a better information exchange. Different owners could receive the same information and had a possibility to influence each other. In other words, the quality of corporate management is improving.
It is interesting that it was the "healthy" banks that showed a greater difference between the real and the effective network sizes. This indicates that the owners of solvent banks might have too many connections. Thus, the data indicate that in the case of the Ukrainian banking system, the availability of excessive connections among the owners had a rather positive effect. The owners of "healthy" banks are more accountable to each other, because they are closely connected and their actions are more transparent. Mutual control, even if it is excessive, ensures transparency and mutual responsibility.
However, we should not ignore the alternative explanations of the fact that the ownership structure of the "sick" banks was not so complicated. It is well-known that particular banks have been established for the sole purpose of money laundering, servicing one’s own business at the expanse of deposits, or selling or implementing a risky business strategy. It might be the case that the founders of such "sick" banks have not bothered to establish unnecessary connections, knowing that the bank would leave the market anyway or would be sold. Or they did not want to create extra barriers to the implementation of their risky business model. One should also keep in mind that some of the owners of the insolvent banks could have simply been on the run.
Conclusion
Thus, "healthy" banks often have a complicated ownership structure. On the one hand, there are large groups of shareholders, on the other hand, different owners have more contacts with each other, not just with the bank. Although the number of contacts was excessive at first sight, these connections have played a rather positive role. Such a structure ensures transparency of actions and mutual control, and improves the quality of corporate management.