Valentyna Smal, Director of Analytical Center SV-Platform has gathered the most comprehensive dataset on internally displaced persons from the Crimea and Donbass. She has found out who those people are, where they live and where they are looking for a job. Can they become a driver of the economic growth in Ukraine?
As a result of the annexation of Crimea by Russia and the loss of control over a part of the Donetsk and Lugansk regions, many people in Ukraine were forced to leave their homes and move to other Ukrainian regions. How many such people are there, what are their ages and genders, and where did they find shelter? These questions need to be answered in order to help build a national strategy to solve the problems facing internally displaced persons and Ukrainian society.
This is the second time in its contemporary history that Ukraine has experienced a large-scale internal migration. The first was related to the Chernobyl nuclear accident in 1986, when over 116,000 persons were evacuated from contaminated areas [4]. In today’s independent Ukraine, the mass migration is a consequence of Russia’s aggression and the occupation of Crimea and some areas of the Donetsk and Lugansk regions. Ukraine’s scientific literature and media refer to people who have been forced to move to other regions of Ukraine ‘forced’ or ‘internal’ migrants. Government documents call them ‘internally displaced persons’.
Ukrainian IDPs by the Numbers
According to the Ministry of Social Policy, 1,785,740 internally displaced persons were registered as of June 6, 2016, including 1,100,000 women and 700,000 men [5; 1].
It is notable that IDP counts published in various official sources or even in the same source may differ significantly. According to official information from the Interagency Coordinating Headquarters (ICH) for Social Security of Persons Displaced from the Anti-Terror Operation Area and Temporarily Occupied Territories, there were 760,000 fewer IDPs registered as of June 7, 2016, than the Ministry of Social Policy had stated.
According to the ICH, 1,026,177 persons were displaced from the occupied territories and Anti-Terror Operation area to other Ukrainian regions, including 1,003,824 persons from the Donetsk and Lugansk regions, and 22,353 persons from the Autonomous Republic of Crimea and the city of Sevastopol. There are 169,756 children and 493,897 disabled and elderly persons among them.
The ICH and the Ministry of Social Policy use somewhat different IDP registration methods. The ICH registers persons who apply for help in migration and accommodation. This information is recorded in the register of Ukrainian citizens displaced from the occupied and Anti-Terror Operation areas.
The Ministry registers people who applied for pension or social welfare payments at a new place of residence (this registry is based on the Ukrainian Cabinet of Ministers’ resolution No. 509 “On the registration of internally displaced persons” dated October 1, 2014). In reality, the Ministry’s data include not only internally displaced persons but also those who have declined temporary accommodation services and actually live in the occupied areas, while periodically entering the territory controlled by the Ukrainian government to claim their pensions or social welfare.
The number of internally displaced persons is significant enough to exceed the total population of many countries of the world, including European states (e.g., Montenegro’s population is 647,000, and the population of Estonia is 1,265,000). Ukraine ranks first among European countries in terms of the number of IDPs, and is among global leaders by the number of IDPs (see Table 1) [7].
Table 1. Countries with the largest number of IDPs, as of December 31, 2015
| № | Country IDPs | persons |
| 1 | Syria | 6,600,000 |
| 2 | Columbia | 6,270,436 |
| 3 | Iraq | 3,290,310 |
| 4 | Sudan | 3,182,286 |
| 5 | Yemen | 2,509,068 |
| 6 | Nigeria | 2,095,812 |
| 7 | South Sudan | 1,696,962 |
| 8 | Ukraine | 1,678,587 |
| 9 | The Democratic Republic of the Congo | 1,500,000 |
| 10 | Pakistan | 1,459,000 |
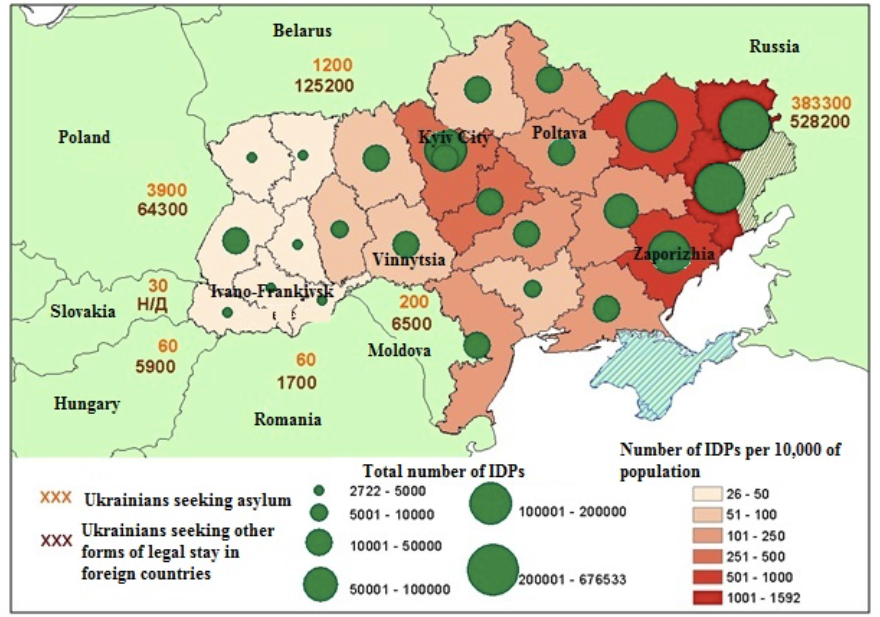
In addition to Ukrainian regions, the residents of temporarily occupied territories and Anti-Terror Operation zone are also migrating abroad (see Figure 1).
Figure 1. IDPs by Ukrainian regions, and Ukrainians seeking asylum or other forms of legal residency in neighboring countries*
Where IDPs flee
The uneven geographical distribution of IDPs becomes even clearer when we compare relative numbers, such as the number of internally displaced persons per 10,000 of native inhabitants (see Figure 1).
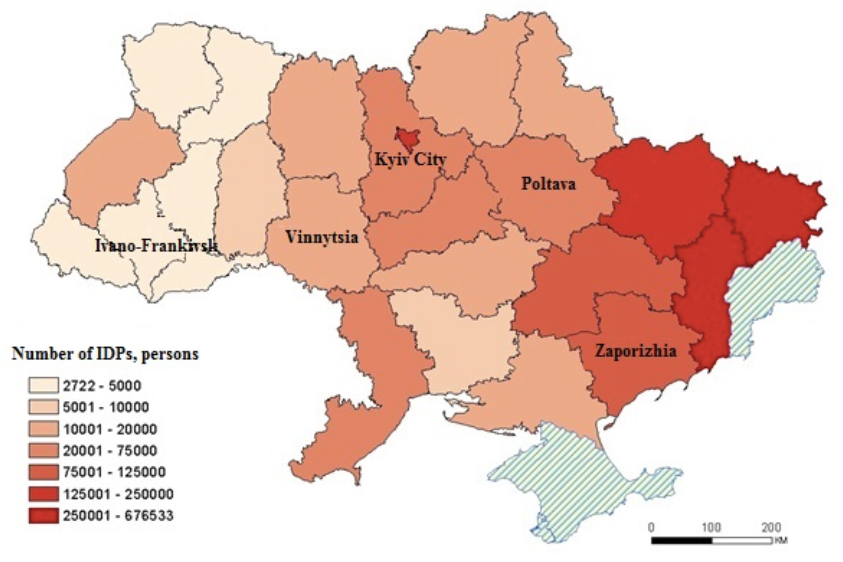
The fact that a significant part of IDPs choose to move to regions nearest their previous homes is evidence of their intent to return. At the same time, a significant number of IPDs are known to register outside the occupied areas of the Donetsk and Lugansk regions, in order to withdraw their pensions and social payments, subsequently returning home to the occupied areas. According to numerous media reports, there are cases of hundreds and even thousands of displaced persons registering as living at the same address, or even a nonexistent address.
Figure 2. Total number of IDPs by Ukrainian regions*
Where IDPs Seek Employment
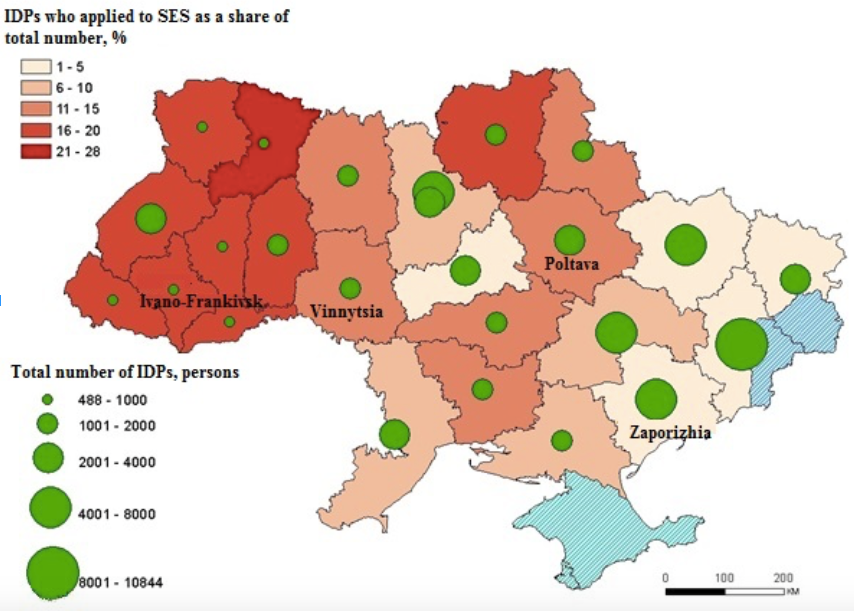
This registration loophole explains the difference between the number of IDPs’ applications submitted to the State Employment Service (SES) in Western regions of Ukraine and the number submitted in Eastern regions, in the period from March 1, 2014 to January 31, 2016 (see Figure 3). For instance, there are 30 times more IDPs in the Zaporizhia region than in the Ivano-Frankivsk region, but the number of those who applied to the State Employment Service differs only by a factor of 6.
Western Ukraine’s IDPs were more proactive in seeking employment, as the percentage of those who have applied to the employment service is significantly higher there than the same statistic in Ukraine in general (3.75%): 27.7% in the Rivne region, 19.7% in the Ivano-Frankivsk region, 18.6% in the Lviv region, and 18.5% in the Volyn region. On the other hand, the percentage of IDPs applying for jobs is 1.6% in the Donetsk region and 1.4% in the Lugansk region.
Figure 3. Total number of IDPs and the share of IDPs who applied to SES by region*
The problem of unified registration of IDPs [2; 5] should finally be solved using transparent approaches which take into account all kinds of assistance, including aid provided by international projects, foundations, and programs. A clear mechanism and selection criteria should be developed to distribute assistance among internally displaced persons according to their material situation.
A unified IDP registration system would provide a more effective way to determine the volume of displaced persons’ needs and to plan social payments, as well as to prevent the misuse of government and donor assistance.
IDPs’ Gender, Age and Education
According to the Office of the United Nations High Commissioner for Refugees, the percentages of men and women in the total number of IDPs worldwide is nearly the same [8]. In contrast, there is a significant predominance of women among IDPs in Ukraine: according to the unified information database of IDPs, the proportion of women is approximately 62% [1]. There are various reasons explaining this — from men staying at home to care for their houses or infirm relatives, to the unwillingness of men to register as IDPs in order to avoid being drafted into the Ukrainian army. This IDP gender difference is shaped by displaced persons from Eastern Ukraine; IDPs from Crimea are gender-balanced.
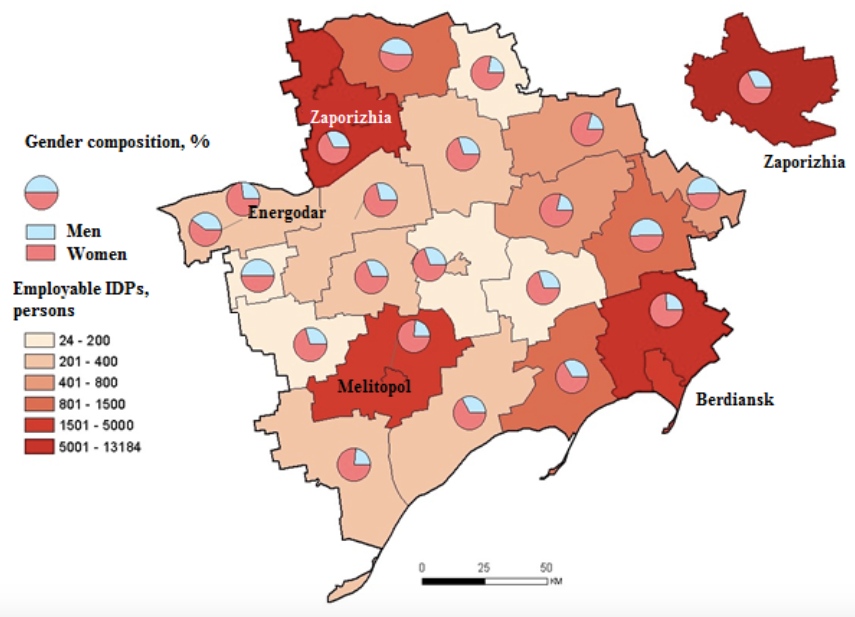
Women dominate the employable population in all Ukrainian regions, e.g., 69% in the Zaporizhia and Vinnytsia regions and 67% in the Ivano-Frankivsk region. The predominance of women in the gender composition of IDPs at the level of districts of the oblast and regional capitals also becomes evident if we look at the example of the Zaporizhia region (see Figure 4).
Figure 4. Gender composition of employable IDPs in the Zaporizhia region*
*Prepared by the author based on data from the Department of Social Welfare in the Zaporizhia Regional State Administration
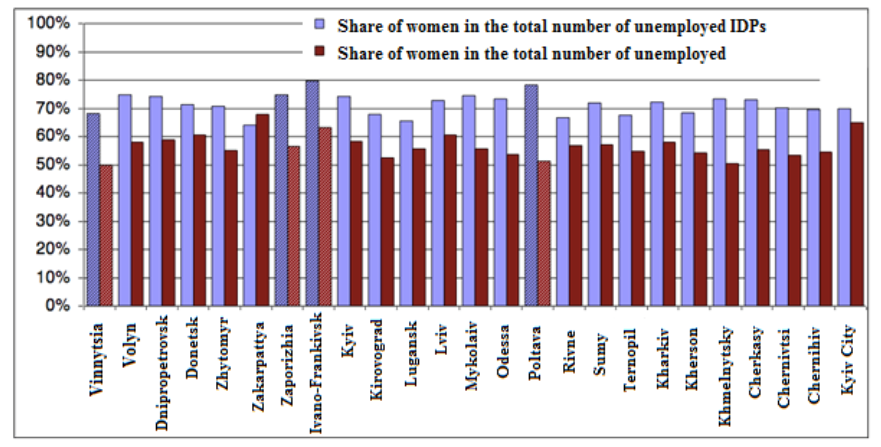
In most cases, the women’s share also dominates among unemployed IDPs. With the fraction of women among all categories of registered unemployed people being 56.4%, their percentage among unemployed IDPs is 71.7%. The share of women among unemployed IDPs ranges from 64% in the Zakarpattya region to 79.6% in the Ivano-Frankivsk region. The Poltava and Zaporizhia regions also show a high share of women in the total number of unemployed IDPs (77% and 75% respectively). In the Vinnytsia region these figures are somewhat lower than in other regions — 67% (see Figure 5).
Figure 5. Share of women in the total number of unemployed in Ukrainian regions
The percentage of young people among employable IDPs is significant. In particular, the share of those under 35 among IDPs is over 40% (see Figure 6). This age composition suggests a considerable potential of labor resources, as young people are more mobile, creative, have modern educations and are more capable of mastering new skills.
Figure 6. Age composition of unemployed IDPs
Employable IDPs have high skill and education levels, as most of them have higher education. According to the State Employment Service, the breakdown by education among IDPs substantially differs from the educational level of the unemployed population in general: over 70% of unemployed IDPs have higher education, 19% have vocational education, and 11% have primary and secondary education. Among the whole unemployed population in Ukraine, the share of persons with higher education is less than 45%; 35% have vocational and 20% have secondary education. It is noteworthy that the share of persons with higher education is prevalent in all regions except the Zhytomyr (47.1%) and Ternopil (47.5%) regions.
Such a highly educated IDP population belies a significant accumulation of human capital, which may become an independent driver for the development of the tech sector and knowledge industries in regions with high concentrations of IDPs.
This article was written based on research “Internally Displaced Persons: Social and Economic Integration in Host Communities”, prepared as a part of the Project for Local Development and Economic Governance (PLDEG) being implemented by the Federation of Canadian Municipalities (FCM) with the financial support of the Department of Global Affairs of Canada.
References
[1] During the year, the number of IDPs has increased by half a million // Access to the truth, 10.05.2016.
[2] Official site of the State Employment Service [Web site]
[3] Official site of the State Emergency Service of Ukraine [Web site]
[4] Official site of Kyiv Regional State Administration. Chernobyl. [Web site]
[5] Official site of the Ministry of Social Policy [Web site]
[6] Official site of the Office of the United Nations High Commissioner for Refugees. [Web site]
[7] International Displacement Monitoring Center. Latest IDP numbers by country. [Web site]
[8] Refugees and internally displaced persons. [Web site]
Attention
The author doesn`t work for, consult to, own shares in or receive funding from any company or organization that would benefit from this article, and have no relevant affiliations
