There have always been heated debates about students going abroad. Some cite student migration as an argument for reforming higher education; others, on the contrary, point to it as evidence against changes—for example, in the case of raising tuition fees. Meanwhile, the media and social networks are awash with increasingly alarming reports about the scale of youth migration.
I have been studying student migration for over 10 years, so I will try to answer several key questions about its scale, geography, and future trends. In this article, I rely on data I have collected from 34 countries. At the end, I provide a file with this data so that anyone interested could analyze it, along with the data sources and its limitations.
Overall trend
Over the past 15 years, the number of Ukrainians studying at Western universities (in Europe, the US, Canada, and Australia) has grown more than fivefold—from 21,000 in the 2008/2009 academic year to 115,000 in 2023/2024 (Figure 1). In relative terms, this is an increase from 2% to 11% of the total number of full-time students in Ukraine, in part because the number of students in Ukraine over this period fell by more than 21%.
From 2008 until Russia’s aggression against Ukraine in 2014, the number of Ukrainian students abroad was growing by several thousand per year. This can be described as typical educational migration, when some young Ukrainian people sought better-quality education and career opportunities in other countries. At first, the growth was 2,000–3,000 a year, but by 2011–2013, the pace of increase in Ukrainians studying abroad had risen to 5,000–7,000 a year.
Russia’s attack on Ukraine in 2014 sharply accelerated the pace of educational migration. By the 2018/2019 academic year, the number of Ukrainians studying at foreign universities had nearly doubled compared to 2013/2014. In some years, the number of students grew by 10,000. Possible reasons for migration—aside from the war—include deterioration of the economic situation and a growing sense of instability in Ukraine. Perhaps some students also shifted their focus from Russia to Europe.
From the 2018/2019 to the 2021/2022 academic year, due to economic stabilization and later the pandemic, which restrained migration flows, the number of our students abroad remained relatively steady, at 70,000–75,000.
Russia’s full-scale war against Ukraine gave a new and powerful boost to migration. Millions of Ukrainians were forced to leave the country, among them many young people. Within a year, the number of Ukrainian students at Western universities grew by half, reaching 109,000, after which the growth rate slowed. In the 2023/2024 academic year (the latest available data), there were 115,000 such students.
Figure 1. Number of Ukrainian students studying at foreign universities and their share of Ukrainian full-time students
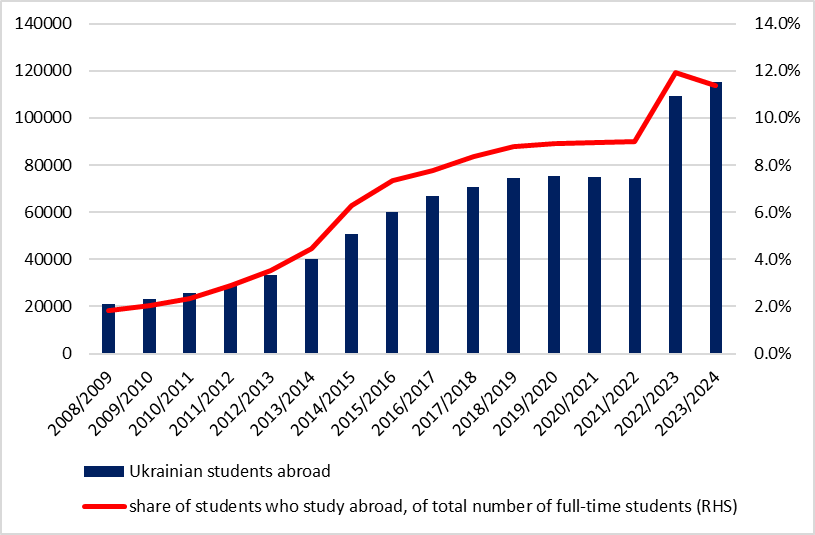
Note: Data on full-time students include bachelor’s and master’s (specialist) programs as of October 1 of each year. Sources: State Statistics Service of Ukraine (2008/2009–2015/2016), Unified State Electronic Database on Education (2016/2017–2023/2024), Register: Number of higher education students [Open Data Portal].
In Ukraine, the total number of students was 754,000 in the 2021/2022 academic year, 807,000 in 2022/2023, and 899,000 in 2023/2024. Thus, before the start of the full-scale war, the share of those studying outside the country was 9%; in 2022, this figure rose to 11.9%, and in 2023 it slightly decreased to 11.4%.
A shift in destination countries
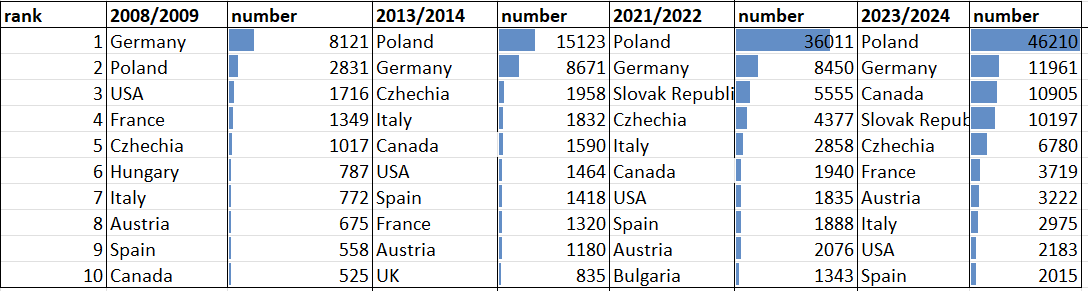
Over the past 15 years, the list of the top 10 Western countries where Ukrainians most often pursued higher education has remained virtually unchanged. However, there have been shifts within this top 10 (see Table 1).
In 2008/2009, the undisputed leader was Germany, where 8,121 Ukrainian students were enrolled. It was nearly three times ahead of Poland (2,831), followed by the US, France, and Czechia. This choice reflected a predominant orientation toward Western European and North American countries, which have traditionally been associated with high quality and prestige of university education.
As of 2013/2014, the situation started to change dramatically. Poland was already hosting 15,123 Ukrainian students, significantly surpassing Germany. Since 2014, Poland has become the new center of gravity for Ukrainian students and their number in this country has steadily increased since then, reaching nearly 40,000 by the 2018/2019 academic year. On the one hand, this shift was driven by the strengthening positive image of Poland—geographically, culturally, and linguistically close—as a kind of “near Europe” that was experiencing economic growth, offering attractive opportunities, while at the same time having lower cost of living. The joint hosting of Euro 2012 and the introduction of visa-free travel may also have played a role. On the other hand, Polish universities, especially private ones, discovered previously untapped potential in Ukrainian applicants who could afford to pay tuition.
Czech and Slovak universities were also gaining momentum, especially the latter: the number of Ukrainian students in Slovakia rose from 176 in 2013/2014 to 5,555 in 2021/2022 and 10,197 in 2023/2024. The number of Ukrainian students in Canada also grew rapidly—fivefold—to 10,905 as of 2023/2024.
Forced migration after the start of the full-scale war reinforced Poland’s dominance—46,210 students as of 2023/2024, or 40% of all Ukrainian students abroad.
Table 1. Top 10 Western countries by number of Ukrainian students in 2008/2009, 2013/2014, 2021/2022, and 2023/2024
How significant are Ukrainian students for different countries?
Often, what matters is not just the absolute number of Ukrainian students, but also how large their share is among all international students in a given country. This figure helps show how strategically important they are and, ultimately, how dependent local universities are on the revenue—direct or indirect—that Ukrainian students bring.
For example, despite the considerable number of Ukrainian students in Germany and Canada, they make up only 2.5% and 1% of all international students there, respectively. In both countries, students from China account for a much larger share. The situation is similar across all Western European countries, the US, and Australia, as these are global players with strong positions in the international student market.
Ukrainians have traditionally made up a significant share of students in Poland. After 2022, due to the scale of migration, the share of Ukrainian students in Poland’s neighboring countries significantly increased. Thus, in the 2023/2024 academic year, Ukrainians accounted for 53.5% of all international students in Slovakia and 43.1% in Poland, with substantial shares also in Lithuania (16.7%), Czechia (12.2%), Bulgaria (11.2%), and Estonia (9.9%).
Impact of the full-scale invasion
According to Eurostat, in 2022, more than 4 million Ukrainians—primarily women and children—were forced to move to EU countries looking for safety. Among them was a substantial number of school-age youth and students who, upon arriving in new countries, gained the opportunity to continue or begin studying at local universities (Figure 2).
In the 2022/2023 academic year, the number of Ukrainian students abroad grew by 35,000—or 47%—compared to the previous year. The main recipients of this new wave of student migration were Poland, Canada, Slovakia, Germany, the Czechia, France, and Lithuania. These seven countries accounted for more than 80% of the total increase. In Poland, Germany, and Czechia—which had already been popular with Ukrainian students—the number of students from Ukraine grew by 30–40% year over year, while in Slovakia it jumped by 80%.
In March 2022, the Polish government granted Ukrainian students who had arrived due to the war the right to study for free in public universities in Polish. Previously, this opportunity was available only to those who spoke Polish at the C1 level or held a Pole’s Card (i.e. proven historic links to Poland). It is hard to say exactly how many Ukrainian students took advantage of this right, but as of the 2022/2023 academic year, among all Ukrainian students in Poland (including those already studying as of February 24, 2022), one-third were enrolled in public universities. In 2022, 8,000 Ukrainian students received one-time financial assistance.
Some countries have already changed the conditions for Ukrainians. For example, Lithuania initially allowed all Ukrainian students to study for free, but later had to amend these terms. Starting in September 2024, newly arrived students must compete for public-financed places in the general admissions process alongside Lithuanian citizens.
Figure 2. Absolute and relative increase of the number of Ukrainian students in the 2022/2023 academic year compared to 2021/2022
Gender distribution
Until 2022, women comprised about 60% of Ukrainian students studying abroad. Women predominated in almost every country—for example, in Poland their share ranged from 54% to 57% in different years, while in Germany, Italy, Spain, France, and Austria it reached 70–75% in certain years. It is important to note that this predominance is characteristic only of Ukrainian students abroad. In Ukraine, the gender distribution among students has been and remains roughly 50/50. In other words, women in Ukraine were more likely than men to go abroad for higher education. The most likely reasons are lower labor market discrimination against women in EU countries—meaning better professional prospects—as well as better foreign language skills.
This traditional distribution changed with the start of the full-scale invasion. My analysis is based on data from 17 countries where a gender breakdown is available (out of a total of 34 countries in the dataset). In almost every country, the share of women has declined somewhat (Figure 3).
In the 2022/2023 academic year, the share of men significantly increased—to 50%—and in 2023/2024 it somewhat decreased again, to 46%. Interestingly, the share of men was over 50% in countries closest to Ukraine, while women prevailed in countries farther West. In the first year after the full-scale invasion, men made up the majority of Ukrainian students in Latvia (69%), Slovakia (60%), Lithuania (60%), Romania (56%), and Poland (53%). And although in the following academic year (2023/2024) women once again became the majority in Poland, this regional pattern largely persists. Since in these countries access to higher education for Ukrainians is generally easier, i.e. less demanding admission exams and lower tuition fees, than in Western European countries, we can assume that men leaving due to fear of mobilization are more inclined to choose such countries because of the easier entry into their universities.
Figure 3. Share of women among Ukrainian students in foreign higher education institutions, 2016/2017 and 2022/2023
How many university applicants leave Ukraine each year?
Ukrainian Border Service could provide the precise answer to this question. However, in the absence of access to their data, we can rely only on indirect estimates.
It is possible to estimate the minimum and maximum of this number using data on the number of incoming students with Ukrainian citizenship published by Poland and Germany. In Poland, this is the number of the first-year bachelor’s students (including entrants into integrated MA programs in medicine and veterinary medicine), which do not include students entering master’s programs. For Germany, we use the figure im ersten Hochschulsemester (in the first semester of a higher education institution), to which we add those who enrolled in the summer semester (there are far fewer such students, since traditionally the majority begin studies in October, i.e. in the winter semester).
These two countries accounted for 26,100 and 22,700 incoming students in the 2022/2023 and 2023/2024 academic years, respectively. Before that, the overall number of students for these countries was between 13,000 and nearly 15,000 Ukrainian entrants per year. It is unclear whether these are students who had arrived long before admission and completed local secondary school, or those who came to the country right before entering a university. Some clues can be derived from the above mentioned German data, which differentiate between the two groups. In 2022/2023, 8.7% of all Ukrainian entrants had German secondary school credentials; in 2023/2024, the figure was 7.8%. Therefore, at least in the case of Germany, we can assume that almost all of the more than 4,000 entrants were those who left Ukraine in order to enroll in a foreign university, not those who graduated from a German school.
At the same time, it is likely that some of them left 1-2 years before graduation, studied at a Ukrainian school remotely, and then attempted to enter a local university. In fact, for Germany, a common pathway for students could be to first study remotely for a year at a Ukrainian university to become eligible for admission to a German university. This is because Germany considers 11 years of Ukrainian schooling plus one year at a university equivalent to 12 years of German schooling and allows admission if the applicant has German language proficiency at the C1 level.
Figure 4. Number of Ukrainian citizens enrolled in education in Poland and Germany
There is no data on the number of applicants for all countries, but the figures from Poland and Germany can be used for extrapolation. These two countries have consistently accounted for more than half of all Ukrainian students in the West, and in some years their share exceeded 65%. In addition, they represent different types of educational migration. In Germany, until 2022, the number of Ukrainian students was practically constant at about 8,000–9,000. In contrast, in Poland, the number of students has grown steadily since the start of observations in 2008/2009. Combining these two trends makes it possible to estimate the number of applicants from Ukraine to Western higher education institutions each year.
The estimate is based on the student inflow rate, which I calculate as the ratio of new entrants to the total number of students in a given year. I could make it a bit more complex by factoring in dropout rates during studies, but such data are available only for Poland. Over the past 10 years, dropout rates have increased: in 2014, about 75% of a cohort graduated, in 2021, it was 46%, and in 2023, only 40%[1] . This may indicate both increasing demands during the course of study and a decrease in the average quality of students. Based on previous research, I am inclined to think that average quality of incoming cohorts has declined due to the dramatic increase in their size. For Poland, the student inflow rate hovered around 30–35%, jumping to 40–45% after 2022, while for Germany it ranged from 18–23%, with a jump to 36–39%[2] .
Poland’s and Germany’s rates will serve as our extreme values (maximum and minimum bounds). I will calculate the central estimate using a weighted coefficient: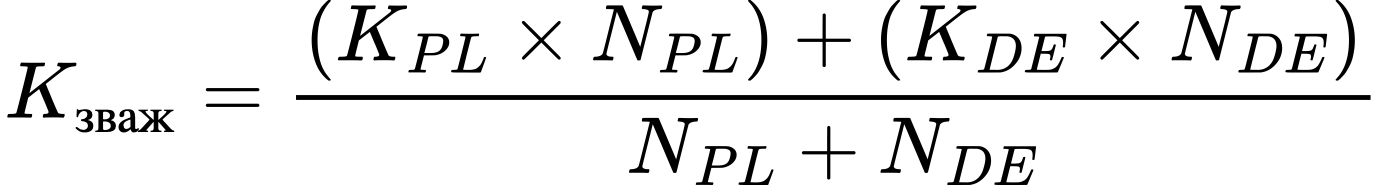
NPL and NDE are the total number of students in each country.
Using the conservative, i.e., lower, bound, we can conclude that the volume of annual departures abroad grew more than threefold between the 2008/2009 and 2021/2022 academic years—from 4,500 to 14,700 people. After the full-scale invasion, the number of new Ukrainian entrants to Western universities was 42,000 in 2022/2023 and 41,000 in 2023/2024. For comparison, Ukrainian universities enrolled 213,000 students in 2021, 274,000 in 2022, and 288,000 in 2023[3] . Thus, before the war, at least 6.5% of entrants went abroad, while after the full-scale invasion, this share doubled to 13.5% in 2022 and then decreased slightly to 12.5% in 2023. It is likely that the number of entrants abroad—just as in Ukraine—increased due to the possibility to obtain a deferral.
Figure 5. Estimated annual number of entrants from Ukraine to Western universities
What will be the impact of Ukrainian graduates from local schools?
Before the full-scale invasion, Ukrainian students in foreign universities were predominantly those who had enrolled after graduating from a Ukrainian school. Far fewer were those who had long lived in the destination country and completed school there. According to Eurostat, after 2022, up to 1.4 million children (persons under 18) ended up in EU countries, including between 300,000 and 340,000 teenagers aged 14–17 (this figure can fluctuate from month to month). How many of them could soon become university students in their respective countries? To answer this question, I calculate the ratio of the number of persons aged 14–17 in October 2023 to the number of students in the 2023/2024 academic year for 23 European countries for which both datasets are available. The higher this ratio, the greater the potential for growth in the number of Ukrainian students (see Table 2).
However, this potential will not necessarily be realized. The number of students is affected by the education and migration policies of specific countries—for example, study permits, admission requirements, funding arrangements, competition levels, etc.
Table 2. Potential growth in the number of Ukrainian students based on the number of Ukrainian teenagers in European countries
| Country | Number of teenagers aged 14–17 | Number of students | Index | Estimated potential |
| Ireland | 6,725 | 210 | 32 | Very high |
| Finland | 3,935 | 140 | 28 | Very high |
| Sweden | 2,925 | 200 | 15 | Very high |
| Norway | 4,465 | 319 | 14 | Very high |
| Croatia | 1,425 | 142 | 10 | High |
| Germany | 94,115 | 11,961 | 8 | High |
| Belgium | 5,105 | 681 | 7 | High |
| Cyprus | 1,100 | 161 | 7 | High |
| Romania | 7,665 | 1,143 | 7 | High |
| Bulgaria | 11,380 | 1,761 | 6 | Medium |
| Spain | 11,890 | 2,015 | 6 | Medium |
| Switzerland | 5,150 | 982 | 5 | Medium |
| Portugal | 2,740 | 529 | 5 | Medium |
| Estonia | 2,735 | 542 | 5 | Medium |
| Netherlands | 7,160 | 1,450 | 5 | Medium |
| Latvia | 3,230 | 750 | 4 | Medium |
| Czech Republic | 27,735 | 6,780 | 4 | Medium |
| Italy | 11,875 | 2,975 | 4 | Medium |
| Lithuania | 6,625 | 1,999 | 3 | Low |
| Slovenia | 665 | 250 | 3 | Low |
| Austria | 6,765 | 3,222 | 2 | Low |
| Poland | 91,980 | 46,210 | 2 | Low |
| Slovakia | 8,375 | 10,197 | 1 | Low |
Countries with a very high index (Ireland, Finland, Sweden, Norway) have a significant “reserve” of Ukrainian teenagers. However, in these countries, there are virtually no opportunities for free education for Ukrainian citizens, and the cost of fee-paid programs is quite high (€7,000–8,000 per year), so it is unlikely that this high potential will be realized under current conditions.
Germany has the largest number of Ukrainian teenagers, so its index is high even with a substantial overall number of Ukrainian students. German universities stand out for offering Ukrainian citizens the opportunity to study free of charge, provided they have strong German language skills. At the same time, in Germany’s school system, students are sorted into different educational pathways after primary school (at the age of 9–10). Traditionally, university admission follows graduation from a Gymnasium—an academically oriented secondary school where programs are typically two years longer than in other school types[4] .
Gymnasium programs end with the Abitur exams, which grants the right to enter a university. In 2021, among everyone completing secondary education in Germany, 34% earned the Abitur, while the rest graduated from institutions leading either to vocational training or early entry into the labor market. In the 2023/2024 academic year, 133,000 Ukrainian schoolchildren were enrolled in various types of secondary institutions (i.e., after primary school), of whom 35,000 (26.5 %) attended Gymnasiums. For comparison, among German students, this share is 43%. In other words, Ukrainian children are much less likely to attend Gymnasiums and therefore have lower chances to enter universities.
Among all Ukrainian entrants in Germany enrolling in higher education for the first time, 8–9% held German secondary school credentials in 2022/2023 and 2023/2024. This is not surprising, as the large wave of Ukrainian children who have integrated well into German Gymnasiums and after graduation will enroll in German universities, will start to be felt later—around 2026–2027. I do not have data on the exact grade-level distribution of Ukrainian children in Gymnasiums. However, if we assume that these 35,000 children are evenly spread across grades (which is unlikely), we can expect 3,000–4,000 Ukrainian teenagers per year to successfully complete Gymnasiums and pass the Abitur. This would bring a noticeable increase in the number of Ukrainian students in German universities.
Poland is somewhat similar to Germany in its conditions for accessing higher education. Since 2022, Ukrainian refugees have had the right to study for free at public universities in Polish. However, recently, a mandatory minimum Polish proficiency level of B2 has been introduced for applicants with a foreign high school diploma. Previously, many universities (especially private ones) did not require certificates at all, and for a significant number of public universities, a B1 certificate was sufficient.
The index in Table 2 ranked Poland’s potential as low, since the large number of students already studying there somewhat offsets its internal reserve. However, a closer look at the position of Ukrainian children in the Polish school system shows that, similar to Germany, they are less likely than local children to end up in lyceums. In fact, the Polish government only required Ukrainian children to attend Polish schools starting in September 2024; before that, the challenge was a shortage of school staff and a lack of experience integrating this large number of foreign children.
Some studies show that the biggest challenge for Ukrainian teenagers remains the language barrier. Statistics indicate that most Ukrainian teenagers (71%) are enrolled in vocational schools, which prepare skilled workers for the labor market and are not primarily aimed at preparing students for university admission. Graduation (matura) exam results in such schools are usually worse than in lyceums. It is therefore unsurprising that in 2025, among 676 Ukrainians taking the matura, 30% failed (the overall failure rate in Poland is 20%).
Next year, a much larger graduating class is expected—over 7,000 Ukrainian children. If we make a conservative assumption that at least 30–40% of them will successfully pass the matura and that some of these will then enroll in Polish universities, this would bring an additional 2,000–3,000 Ukrainian entrants from “internal inflow,” and in subsequent years up to 5,000–6,000.
Note that this refers only to those already in these countries, without taking into account new waves arriving from Ukraine.
For Slovakia, it appears that the main source of Ukrainian students is incoming first-year entrants. It is the only country where the number of Ukrainian teenagers aged 14–17 is smaller than that of Ukrainian students. Thus, the very favorable conditions—admission without entrance exams, free study in Slovak at public universities, and moderate tuition fees at private universities—are likely aimed primarily at those coming directly from Ukraine.
Finally, note that the number of 14–17-year-olds recorded by Eurostat is increasing (Figure 6). Assuming that the natural flow “through” this age category is roughly the same at entry and exit, we can infer that there is a steady, gradual increase in the number of teenagers due to the arrival of Ukrainian children in European countries. There is a noticeable jump in summer—that is, between academic years—when people are deciding what to do next, especially when finishing school.
Figure 6. Number of Ukrainian refugees aged 14–17 in Europe, according to Eurostat
This increase suggests that in the future, there will be a fairly long trend in which a significant share of Ukrainian entrants to Western universities will be not the ones who left just before admission, but those who studied in local schools for a long time and achieved relatively high results, enabling them to enter a local university. Based on graduates of German and Polish schools alone, we can expect an annual inflow of 5,000–10,000 Ukrainian students in Poland and Germany in the coming years.
Further research
Going forward, it will be essential to examine in depth the situation in each country with the largest number of Ukrainian students—Poland, Germany, Slovakia, Canada, and the Czech Republic—to assess how much local conditions currently facilitate access to higher education and how they might do so in the future, as well as to explore the factors that will influence whether Ukrainian teenagers return. More attention should also be devoted to identifying what could more effectively keep young people in Ukraine from leaving for foreign universities.
Data
I am providing access to all the data collected in a separate file. It contains six individual tabs with datasets and the charts used in this publication. I hope that making this data publicly available will be useful for other researchers. I would also like to remind readers that when using or publishing this data, attribution is mandatory.
Data collection methodology
The author of these lines has been monitoring the number of Ukrainian students studying at universities abroad for over 10 years. Analyses and datasets up to the 2017/2018 academic year were previously published on the website of the Cedos think tank, and the data from those publications is also used in this article.
Over the years, this research has produced a database covering 34 countries worldwide—primarily in Europe—for the period from the 2008/2009 to the 2023/2024 academic years. In each of these countries, I collect information from open official sources and contact the government body responsible for collecting and processing statistics on international students.
These bodies, listed at the end, have provided official responses containing both the data and the metadata—that is, the definitions that make it possible to compare statistics across countries. In addition, there are about ten other countries I monitor but do not include in the dataset due to the fragmented nature of the data and the generally small number of Ukrainian students there. These include Greece, Denmark, India, North Macedonia, Mexico, South Korea, and Japan, where the combined number of Ukrainian students does not exceed a few hundred. The dataset also excludes data from Belarus and Russia due to significant distortions.
For most countries, the reported figure covers Ukrainian citizens studying in institutions of higher education recognized by those states, in full-cycle programs, in full-time (on-campus) mode, and in bachelor’s and master’s programs.
Data on the number of Ukrainians enrolled in full-cycle programs is presented for Australia, Austria, Azerbaijan, Belgium (Flanders), Bulgaria, the United Kingdom, Georgia, Estonia, Ireland, Spain (up to and including the 2014/2015 academic year), Latvia, Lithuania, Moldova, the Netherlands, Portugal, Romania, Serbia, Slovakia, Slovenia, Turkey, Croatia, Finland, France, the Czech Republic, and Switzerland. The number of Ukrainians that includes both those enrolled in full-cycle programs and those participating in various non-degree programs (credit mobility, exchange programs, internships, language courses, optional practical training, etc.) is reflected in the data from Belgium (Wallonia), Canada, Spain (starting from the 2015/2016 academic year), Italy, Germany, Norway, Poland, the United States, Hungary, and Sweden.
The number of Ukrainians studying full-time (on-campus) is reflected in the data from Austria, Azerbaijan, the United Kingdom, Georgia, Ireland, Latvia, Moldova, the Netherlands, Portugal, Serbia, Slovakia, Slovenia, France, Finland, Croatia, the Czech Republic, and Switzerland. The number of Ukrainians studying either full-time or in distance-learning mode is shown in the data from Belgium (Wallonia), Belgium (Flanders), Bulgaria, Estonia, Spain, Italy, Lithuania, Germany, Norway, Poland, Hungary, and Sweden.
The number of Ukrainians enrolled in bachelor’s or master’s (or equivalent) programs is reflected in the data from Austria, Azerbaijan, Belgium, Bulgaria, the United Kingdom, Georgia, Estonia, Ireland, Spain, Italy, Cyprus, Lithuania, Moldova, the Netherlands, Germany, Poland, Portugal, Russia, Romania, Serbia, Slovakia, Slovenia, the United States, Hungary, Finland, Croatia, the Czech Republic, Switzerland, and Sweden. The number of Ukrainians enrolled in bachelor’s, master’s, or PhD programs is shown in Latvia, Norway, and France data.
A separate note for Canada: foreign nationals must obtain a study permit to participate in academic, professional, vocational, or other education lasting more than six months. The data presented here represent the number of individuals holding an active study permit as of December 31 of a given year.
A separate note for the Netherlands: figures are rounded to the nearest ten.
A separate note for Romania and Bulgaria: since the 2014/2015 academic year, Romania has recorded international students in its universities not by citizenship but by the country where the person completed secondary education. I present here the number of those who finished school in Ukraine and are studying at Romanian universities. A similar method is used to record international students in Bulgaria.
*Information for the 2023/2024 academic year is unavailable for Spain and Cyprus, and the data for Belgium lacks figures from Wallonia (only Flanders is included), as the relevant authorities in these countries have not yet provided the data. For ease of display in the charts, the 2022/2023 figures will be duplicated for the 2023/2024 academic year.
List of institutions that provided information
- Główny Urząd Statystyczny (Central Statistical Office, Poland)
- Statistisches Bundesamt (Federal Statistical Office, Germany)
- Immigration, Refugees and Citizenship Canada (Canada)
- Ministerstvo školství, mládeže a tělovýchovy (Ministry of Education, Youth and Sports, Czech Republic)
- Ministero dell’Università e della Ricerca (Ministry of University and Research, Italy)
- The Institute of International Education (United States)
- Ministerio de Universidades (Ministry of Universities, Spain)
- Directorate of Social Statistics, Statistics Austria (Austria)
- Ministère de l’Enseignement Supérieur et de la Recherche (Ministry of Higher Education and Research, France)
- Slovak Centre of Scientific and Technical Information (Slovakia)
- Hungarian Central Statistical Office (Hungary)
- Higher Education Statistics Agency (United Kingdom)
- Национален статистически институт (National Statistical Institute, Bulgaria)
- Yükseköğretim Kurulu (Council of Higher Education, Turkey)
- Education and Culture Statistics Division, Statistics Lithuania (Lithuania)
- Direção-Geral de Estatísticas da Educação e Ciência (Directorate-General for Education and Science Statistics, Portugal)
- Bundesamt für Statistik BFS (Federal Statistical Office, Switzerland)
- EL.STAT (Hellenic Statistical Authority, Greece)
- Национальный статистический комитет Республики Беларусь (National Statistical Committee of the Republic of Belarus, Belarus)
- Centrālās statistikas pārvaldes (Central Statistical Bureau, Latvia)
- Statistikaamet (Statistics Estonia, Estonia)
- Departement Onderwijs en Vorming (Department of Education and Training, Flanders, Belgium)
- ARES—Académie de recherche et d’enseignement supérieur (Academy of Research and Higher Education, Wallonia, Belgium)
- Direcţia de diseminare date statistice INSTITUTUL NAŢIONAL DE STATISTICĂ (Data Dissemination Directorate, National Institute of Statistics, Romania)
- Tilastokeskus / Statistics Finland (Finland)
- Australian Education International (Australia)
- Centraal Bureau voor de Statistiek (Statistics Netherlands, Netherlands)
- Statistiska centralbyrån / Statistics Sweden (Sweden)
- Biroului Naţional de Statistică / National Bureau of Statistics (Moldova)
- Office for Student Exchange, Higher Education Bureau, MEXT (Ministry of Education, Culture, Sports, Science and Technology, Japan)
- Στατιστική Υπηρεσία της Κυπριακής Δημοκρατίας (Statistical Service of the Republic of Cyprus, Cyprus)
- Statistični urad Republike Slovenije (Statistical Office of the Republic of Slovenia, Slovenia)
- Azərbaycan Respublikasının Dövlət Statistika Komitəsi Ünvan (S
- tate Statistical Committee of the Republic of Azerbaijan, Azerbaijan)
- National Statistics Office of Georgia (Georgia)
- Statistics Section, Department of Education and Skills (Ireland)
- DRŽAVNI ZAVOD ZA STATISTIKU (Croatian Bureau of Statistics, Croatia)
- Републички завод за статистику (Statistical Office of the Republic of Serbia, Serbia)
- Statistics Korea (South Korea)
- Danmarks Statistik (Statistics Denmark, Denmark)
- Statistics Norway (Norway)
- State Statistical Office of the Republic of Macedonia (North Macedonia)
References
- Eurostat. (2025, July 4). Temporary protection for persons fleeing Ukraine – Monthly statistics [Data extracted July 4, 2025]. In Statistics Explained. Retrieved July 13, 2025
- Eurostat. (n.d.). Beneficiaries of temporary protection at the end of the month by citizenship, age, and sex (Data code: MIGR_ASYTPSM) [Data set]. Eurostat. Retrieved July 13, 2025
- Stadnyi, Y., & Slobodian, O. (2016). Українські студенти за кордоном: скільки та чому? [Ukrainian students abroad: How many and why?]. CEDOS. Retrieved July 13, 2025, from
- Ambrazaitytė, K. (2024, July 15). Lithuania ending free tuition for Ukrainian students [News article]. LRT English. Retrieved July 13, 2025, from
- CARE International in Poland, International Rescue Committee, & Save the Children Poland. (2024). Out of School: Assessment on barriers to school enrolment for Ukrainian refugee adolescents in Poland [PDF report]. Retrieved July 13, 2025
- Świdrowska, E., & Stano, K. (2025, January). Refugee students from Ukraine in Polish schools: Data analysis report – October 2024 [PDF report]. Center for Citizenship Education; UNICEF. Retrieved July 13, 2025
- Centralna Komisja Egzaminacyjna. (2025, July 8). Wstępne informacje o wynikach egzaminu maturalnego 2025 – prezentacja ogólnopolska [PDF report]. Retrieved July 13, 2025
- Hrach, K., Pilat, A., Segesh Frelak, Y., Mishaľska, D., Łada, A., Stadnyi, Y., Slobodian, O., Fitisova, A., & Kudelia, M. (2018). Українське студентство в Польщі: політики залучення, інтеграції та мотивація і плани студентів [Ukrainian students in Poland: Recruitment policies, integration, and students’ motivation and plans] [PDF report]. CEDOS. Retrieved July 15, 2025
- Єдина державна електронна база з питань освіти (2025, Jan 1). Реєстр: кількість осіб, зарахованих на навчання [Unified State Electronic Database on Education. (2025, January 1). Register: Number of persons enrolled in education] [Open data portal]. Retrieved July 15, 2025
- Główny Urząd Statystyczny. (2024, October 31). Szkolnictwo wyższe i jego finanse w 2023 roku [Statystyka roczna]. Retrieved July 15, 2025
- Statistisches Bundesamt (Destatis). (n.d.). Hochschulen [Government web page]. Retrieved July 15, 2025
- Statistisches Bundesamt (Destatis). (2023, July 5). Zahl der Woche: Hochschulen – Zahl der neu immatrikulierten Studierenden im Wintersemester 2022/23 leicht rückläufig [Press release]. Destatis. Retrieved July 15, 2025
- Statistisches Bundesamt (Destatis). (2024, October 11). Statistischer Bericht – Allgemeinbildende Schulen – Schuljahr 2023/2024 [Excel data set]. Retrieved July 15, 2025
[1] This calculation covers only bachelor’s programs. The available data include the number of entrants to bachelor’s programs and the total number of graduates. Based on previous research, I assume that 70% of all graduates are bachelor’s degree holders. The chronological framework is as follows—for example, for the 2023 graduating class, the intake from the 2020/2021 academic year is used (assuming a three-year bachelor’s program). The calculation refers to the standard on-schedule graduation and does not account for students who, for various reasons, take a break and graduate later (as a rule, their number is small and does not affect the main indicators).
[2] For 2008–2017, data on summer semester intake are missing (this typically accounts for up to one-third of the total intake). For these years, the average rate from the stable pre-crisis period of 2018–2021—21.6%—was used. In the case of Germany, with its consistent patterns, this simplification should not distort the general picture.
[3] Full-time bachelor’s and master’s entrants are included. For bachelor’s programs, only entrants based on a complete general secondary education are counted. Data source: Unified State Electronic Database on Education (2025, January 1). Register: Number of persons enrolled in studies [Open Data Portal]. Retrieved July 15, 2025, from https://registry.edbo.gov.ua/opendata/entrant/
[4] Some time ago, Germany introduced the possibility of entering university even without completing a Gymnasium and without passing the Abitur. For example, a person who has obtained a qualification through vocational education can enroll in a related field of study or may be admitted only to a university of applied sciences. This has broadened access to higher education, and the number of people making use of these opportunities has been growing every year. However, these remain exceptions rather than the rule. In 2021, less than 4% of university entrants did not have Abitur.

Attention
The author doesn`t work for, consult to, own shares in or receive funding from any company or organization that would benefit from this article, and have no relevant affiliations