Development of sales market of agricultural land in Ukraine will be driven by two main factors: by a set of restrictions and distortions that will be stipulated by Law on land turnover (e.g. maximum size of land holding, access to land market by legal entities and foreigners, establishment of pre-emptive rights), and by access to capital. It is expected that prices for agricultural land in Ukraine will be significantly lower than in most Western European countries but similar to prices in Eastern Europe.
Despite the extension of Moratorium for sales of agricultural land until January 2017, land reforms in Ukraine and design of land market will be on political agenda for the upcoming year. In this respect, it is informative to look at the land markets of neighboring countries and make some inferences for Ukraine (particularly in lights of Eurointegration process). It is likely that conditions of many markets (including land) will share some common tendencies between Ukraine and neighboring countries. We review the land markets of European countries and try to make a prediction about the potential size and prices on Ukrainian market for agricultural land after the moratorium is lifted.
Current trends of the European Union land market
Markets for farmland in the EU member states are relatively thin and stable. In France, for example, about 280 000 ha is transacted annually on average from 1993 till 2005, which is about 1% of the total agricultural land. In Italy, about 1-2% of the total agricultural area is transacted annually. In Ireland this share is 3%, and only 0.6% in Spain, Sweden and UK. Regarding the new EU members, farmland sales in Bulgaria were less than 2.5% of total agricultural land around the accession period, but the overall transacted area grew by 45% between 2006 and 2008. In Romania, prior to accession this share was even smaller, less than 1.5% on average per year. The transacted area of agricultural land has more than tripled between 2005 and 2009. In Poland, around 0.9% of agricultural land is transacted via public sales, and a similar share is transacted via private sales. In Czech Republic, the annual turnover of privately purchased land is about 0.2–0.3% of the total agricultural area during the period 1993–2001, 1.5% from 2002 to 2004 and even 3.3% in 2005. This surge in more recent years was caused (among other things) by a launch of reduced interest mortgage program. In Lithuania, around 3% of privately owned land being transferred through either sales or donations over the 2000–03 period. There was a strong rise in 2004, the year of EU accession, with the share of private land being transferred being up to 5-7%.
Unlike the above mentioned countries, the land market in Ukraine is yet to be established. It is likely that the share of the transacted land will be higher than in most European countries (likely to be close to 5 % after initial stabilization, but assuming liberal conditions of the market after the Moratorium is lifted). Most of private farmland in Ukraine is not cultivated by owners, most of the owners are retirees. Thus, the land market in Ukraine will be larger and less rigid. On the other hand, most land sales in other countries are financed by banks. In Ukraine, however, mortgages for land purchase are almost non-existent, which would keep demand low. Finally, it would be reasonable to expect a larger number of transactions during the first 2-3 years after opening the sales market. It will be driven by a speculative demand and by people who would try to legalize previously made informal deals.
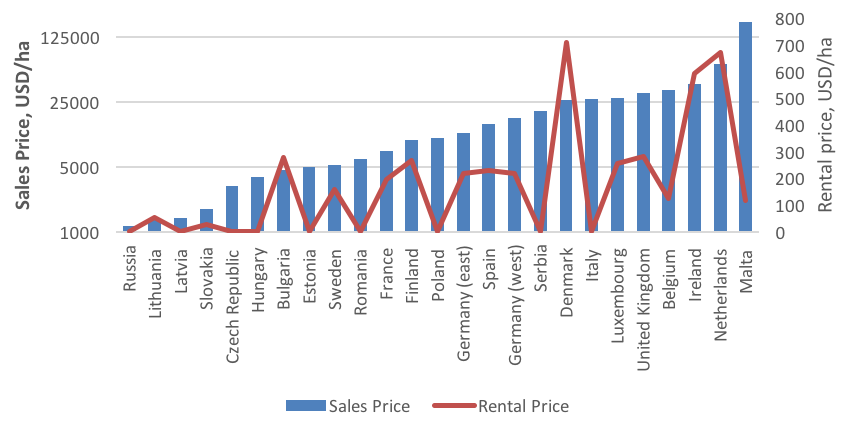
As for the prices for agricultural land, they vary significantly across EU and other neighboring countries (see Figure 1 and Annex for details). The highest prices are observed in Malta and Netherlands (above 60 000 USD/ha). In most Western European countries prices range between 15000 and 30000 USD per ha, and in Eastern Europe the range is between 1 000-5 000 USD/ha. The prices have a tendency for growth with the highest growth rates between 2000 and 2009 found in Latvia, Romania, and Lithuania (71%, 62% and 47% respectively) – new EU member states.
Figure 1. Price for agricultural land in selected countries

Source: Eurostat, Savills, National statistical institute of Republic of Bulgaria, Central Statistical Office of Poland, The German Agricultural Society (DLG), Teagasc
On the other hand, the variation of rental prices is much lower. The highest rate is found in Denmark, Ireland and Netherlands (above 600 USD per ha per year) and the lowest is in Lithuania and Slovakia (54 and 26 USD/ha respectively). For most other countries, the rental prices are around 200 USD/ha.
The rental prices are determined primarily by economic return to land (how much value of agricultural products can be produced per hectare net of other costs). This return is driven by prices for agricultural commodities, agricultural technologies, land fertility and land scarcity. There are several countries where rental markets are distorted or not existent (e.g. Serbia, Georgia). In Ukraine, the rental price for private land was around 75 USD per ha before Hrivna devaluation and was about 32 USD in 2015 (with a wide variation across regions). Other factors that keep rental prices low in Ukraine are related to high fragmentation of land and low bargaining power of land owners as well as difficulties with registration of rental rights.
Link between sales and rental prices for agricultural land
The sales prices in well developed markets represent the capitalization of rental value of land. Thus, countries with lower interest rates and more accessible credit markets would have higher land prices. Besides the interest rate, better security of property rights for land would support higher prices (e.g. formal registration and law enforcement). On the other hand, distortions (e.g., caps on the land holding size, restrictions in access to land market, taxes) would decrease the prices. Options for renting the land and using it as collateral would increase the land value and prices as well as subsidies to agricultural producers.
All the above factors affect the ratio of rental to sales prices, which vary from 0.06% to 5.99% in European Union countries (average is 2.01%). The lowest ratio is observed in Malta, Belgium, United Kingdom and Luxembourg (below 1%) – prices are relatively higher in comparison to rent prices. The highest rental to sales price ratio is Lithuania and Bulgaria (above 4%) – land prices are relatively low in comparison to economic return to land captured by rental prices.
If the same relationship between the rental and sales prices as in the EU is applied to Ukraine, the average price for land should be expected [1] at 2990 USD per ha (with 95% confidence interval ranging from 1480 USD/ha to 6030 USD/ha.)
What could be expected for Ukraine
Development of sales market of agricultural land in Ukraine will be driven by two main factors: by a set of restrictions and distortions that will be stipulated by Law on land turnover (e.g. maximum size of land holding, access to land market by legal entities and foreigners, establishment of pre-emptive rights), and by access to capital. The most likely scenario is that by the time of lifting the Moratorium, very limited resources become available, thus prices are likely to stay below the expected value mentioned above. Recently approved legislative changes to agricultural tax exemptions and establishment of 7-year minimum duration for rental contracts are among other policy factors that are likely to keep land price low. However, with development of land market infrastructure and other reforms in land governance and agriculture, the prices are likely to increase to the level of other Eastern European countries.
Appendix
Table 1. Prices of land by countries
| Price of land sold | Price of land rented | Ratio of rent prices to sales prices | |||
| Year | Price, USD/ha | Year | Price, USD/ha | ||
| Belgium | 2006 | 33617,72 | 2006 | 123,75 | 0,37% |
| Bulgaria | 2014 | 4653,59 | 2014 | 278,94 | 5,99% |
| Czech Republic | 2009 | 3137,18 | – | – | |
| Denmark | 2012 | 25919,26 | 2009 | 708,83 | 2,73% |
| Estonia | 2015 | 5000,00 | – | – | |
| Finland | 2009 | 9600,99 | 2008 | 267,14 | 2,78% |
| France | 2012 | 7453,00 | 2009 | 195,09 | 2,62% |
| Germany (west) | 2013 | 16761,46 | 2005 | 219,36 | 1,31% |
| Germany (east) | 2013 | 11600,62 | 2005 | 219,36 | 1,89% |
| Hungary | 2012 | 3859,00 | – | – | |
| Ireland | 2014 | 39305,78 | 2014 | 592,20 | 1,51% |
| Italy | 2011 | 27018,48 | – | – | |
| Latvia | 2009 | 1414,84 | – | – | |
| Lithuania | 2009 | 1354,58 | 2009 | 53,72 | 3,97% |
| Luxembourg | 2009 | 27889,60 | 2009 | 256,17 | 0,92% |
| Malta | 2009 | 181282,40 | 2009 | 115,99 | 0,06% |
| Netherlands | 2012 | 63738,43 | 2009 | 672,14 | 1,05% |
| Poland | 2014 | 10265,66 | – | – | |
| Romania | 2012 | 6132,00 | – | – | |
| Slovakia | 2009 | 1752,01 | 2009 | 26,29 | 1,50% |
| Serbia | 2013 | 19926,96 | – | – | |
| Spain | 2009 | 14593,23 | 2009 | 227,30 | 1,56% |
| Sweden | 2009 | 5226,46 | 2009 | 157,33 | 3,01% |
| United Kingdom | 2015 | 31389,61 | 2007 | 281,29 | 0,90% |
| Russia | 2012 | 1140,00 | – | – | – |
Source: Eurostat, Savills, National statistical institute of Republic of Bulgaria, Central Statistical Office of Poland, The German Agricultural Society (DLG), Teagasc
Notes
[1] As estimated with simple linear regression
Attention
The authors do not work for, consult to, own shares in or receive funding from any company or organization that would benefit from this article, and have no relevant affiliations


