Are Ukrainians able to distinguish facts from fakes? What factors impact their judgment? Specifically, do they change their attitude to information when they are told that certain information was delivered by russian media?
To answer these questions, we analyzed the data collected by Factum Group in April 2022. Together with the demographic information, respondents were asked to evaluate whether certain statements were true or false. There were 6 true and 18 false statements that were high on the news at the time of the survey (see Annex 1 for details). Each respondent saw half of statements in their original wording, and half of statements preceded with the phrase “According to russian media…” (in random order). Respondents could provide one of four answers to each statement: True, Maybe true, False, Don’t know.
The main results are as follows:
- respondents could more easily identify fakes as fakes than truths as truths (true statements have rather high shares of “maybe” and “don’t know” answers). This suggests that Ukrainians are able to distinguish fakes but official sources and media should make more effort in delivering important actual information;
- shares of respondents that marked fakes as “true” or “maybe” are rather low, except for the fake that Europeans are outraged by bad behaviour of Ukrainian refugees. Thus, media should pay more attention to covering refugee stories and showing that refugees are welcomed;
- people evaluate statements rather than sources: three true statements (two for combined ‘true’ and ‘maybe’ answers) and only two fakes had significantly different distribution of answers for ‘original’ statements and statements with ‘according to russian media’ part added. In all of these cases respondents believed ‘russian media’ less than unsourced statements;
- demographic characteristics have no significant impact on the ability to identify truths or fakes. Higher education may have a weak positive impact.
Data description
In total we have 484 answers of respondents aged 18-55 from cities with more than 50 thousand people. The sample is representative of the urban population of the relevant age. Since the start of the full-scale invasion some people have relocated to other regions or abroad. The region of their origin is identified as of February 23rd, 2022. The respondents also indicated whether they remained in their home region, relocated within the same oblast or to another oblast, came back after relocation or went abroad.
For the ease of analysis, we aggregated the data on people’s whereabouts into four regions: east (Dnipro, Donetsk, Zaporizhzhya, Luhansk, Kharkiv oblasts), centre-north (Poltava, Vinnytsia, Kyiv, Kirovohrad, Sumy, Zhytomyr, Cherkasy and Chernihiv oblasts and Kyiv city), south (Mykolaiv, Odesa, Kherson oblasts) and west (Volyn, Zakarpattya, Ivano-Frankivsk, Lviv, Khmelnytsky, Rivne, Ternopil, Chernivtsi oblasts). Summary statistics is provided in the Annex 2.
Next we discuss the results in more detail.
Can people identify truths and lies?
Figures 1, 2 and 3 suggest that people can more easily identify a fake than a true statement – perhaps because often fakes are absurd and thus easy to identify.
Indeed, less than 1% of respondents could correctly identify all the true statements, and 13% correctly identified more than a half of true statements, while for fakes the respective shares were 9% and 76%.
As Figure 3 shows, not many people identified truths as fakes but rather high shares of respondents answered “maybe” or “don’t know” to the true statements.
Figure 1. Shares of people who could correctly identify certain number of truths
Source: Factum Group survey.
Note: horizontal axis shows the number of true statements, vertical axis - the share of people who could identify this number of truths. Thus, 50% of respondents could identify only one or none true statements. On average, a respondent correctly identified 1.8 truths (st.dev. 1.5)
Figure 2. Shares of people who could correctly identify certain number of fakes
Source: Factum Group survey.
Note: horizontal axis shows the number of fakes, vertical axis - the share of people who could identify this number of fakes. Thus, 53% could identify more than 13 fakes. On average, a respondent correctly identified 12.2 fakes (st.dev. 5.1).
Do people trust russian media less?
Our results do not allow us to make this conclusion. Shares of people who correctly identified true and false statements only in a few cases were statistically different for people who saw the statement with or without the “russian media” phrase. As figure 3 shows, shares of people who correctly identified these statements as ‘truth’ or ‘maybe truth’ significantly differed only for statement #3 - that 10 million of Ukrainians were displaced (which was true at that time, now the number is higher), and statement #6 - that there were explosions in Belgorod. In both cases less respondents marked these statements as true when they saw the phrase “according to russian media” preceding the statement.
Figure 3. Shares of people who identified TRUE statements as true, maybe true, false or did not know, %
Source: Factum Group survey
Note: letter R indicates shares for statements with added “russian media” phrase.
For 18 false statements the picture is even clearer. Only for two of them the shares of people who correctly identified them as false were statistically different when “russian media” part was added. These were fake #14 (Europeans are outraged by bad behaviour of Ukrainian refugees) and fake #17 (Zelenskyi promised to bring to referendum the issues of “denazification” and “demilitarization” of Ukraine). In both cases more people who saw the “russian media” part identified these statements as false compared to the original statements.
A worrying sign is that shares of people who identified the statement about Ukrainian refugees as a fake were very low - 38% for people who saw the “russian media” part and only 25% for people who did not see it. This suggests the need to inform Ukrainians more about how refugees live and how Europeans perceive them and help them. This result may also suggest that stories and videos with “bad behaviour” of refugees distributed at that time by russian propaganda had some effect because people can easily remember instances when they had adverse communication experience with peer Ukrainians. However, even if some of these stories are true, they do not allow to make these strong generalizations that Ukrainians are not welcomed in Europe.
Another statement that our respondents had trouble identifying was fake #15 (that Louis Vuitton used letters Z and V in their new jewelry collection). 55% could not provide any definite answer to this question. Nevertheless, 46% correctly identified it as false. In some sense this fake fits into a russian narrative that “Europeans (European companies) trade values for money” that is quite actively proliferated by russian media. Thus, probably stories of companies that left russia should make their way into the Ukrainian media sphere.
Figure 4. Shares of respondents who recognized FAKES as fakes, %
Source: Factum Group survey
Note: dots show the share of people who identified fake as fake under original formulation (horizontal axis) or with “russian media” part added (vertical axis).
Who can more easily distinguish truths and fakes?
To answer this question, we estimated whether personal characteristics of people, such as gender, age, region of origin and relocation situation, household income, family and employment status impact the probability of people correctly identifying true and false statements and the number of statements which they could correctly identify. We could not find any robust evidence that some personal characteristics systematically impact the ability to distinguish truths and fakes.
At best, one can suggest that higher education plays a mildly positive role: it was significant in regressions with dependent variables ‘identification of fakes’ but not in ‘identification of truths’ (at the same time, this result may be determined by a small number of true statements).
Thus, we can suggest that (1) some other factors impact the ability to distinguish truths and fakes or (2) that anyone, independently of his/her background, can be good at telling truths from lies - if he/she applies a little critical thinking.
Conclusion
The good news is that people are quite good at identifying fakes, independently of sources of these fakes. The not so good news is that people are less able to identify truths. Thus, official sources and media should pay more attention to delivering important information to Ukrainians. One specific topic that is insufficiently covered is Ukrainian refugees in Europe as well as other aspects of Ukraine-EU relations, such as EU companies leaving russia or supporting Ukraine. Thus, we advise the media to pay more attention to this topic, especially taking into account the prospect of Ukraine’s EU accession.
Annex 1. List of statements which the respondents saw
| True statements | Fakes | ||
| T1 | Canadian parliament supported visa-free regime for Ukrainians | F1 | Ukrainian army places artillery in residential districts |
| T2 | General prosecutor office of Ukraine issued suspicion to Illya Kyva | F2 | Ukrainian army doesn’t allow residents of Kramatorsk, Kostyantynivka, Slovyansk and Druzhkivka to evacuate |
| T3 | 10 million of Ukrainians became displaced | F3 | 12-17-year-olds go to war in Mariupol and Chernihiv |
| T4 | Moscow churches voluntarily transfer to Ukrainian Orthodox Church | F4 | Weapons of mass destruction was developed in biolaboratories in Ukraine |
| T5 | At the end of March russia started military exercise at Kuril islands | F5 | Coronavirus was invented by Ukranian sicentists in biolaboratories |
| T6 | Munition warehouse exploded in Belgorod | F6 | European countries will pay rubles for Russian gas |
| F7 | Ukraine used phosphorus bombs in Donetsk | ||
| F8 | Russia destroyed all Ukrainian planes and anti-aircraft systems | ||
| F9 | Ukraine took hostages 11 Rosatom workers | ||
| F10 | Ukrainian doctors take organs for Ukrainian army from dead civilians and russian soldiers | ||
| F11 | Hungary is getting ready to take Zakarpattya | ||
| F12 | Nuclear weapons was developed in Chornobyl laboratories | ||
| F13 | US and Europe considered Ukraine as the base for placing nuclear weapons pointed at russia | ||
| F14 | Residents of EU countries are outraged by the behaviour of Ukrainian refugees | ||
| F15 | Louis Vuitton supports “special operation” because they use symbols Z and V in their new jewelry collection | ||
| F16 | Poland and Hungary together with russia planned to capture parts of Ukraine | ||
| F17 | Zelenskyi promised to organize a referendum about “denazification” and “demilitarization” of Ukraine | ||
| F18 | EU and NATO countries don’t help Ukraine. They planned to give it up to russia |
Annex 2. Summary statistics for the sample
Figure A1. Distribution of respondents by age and gender (number)
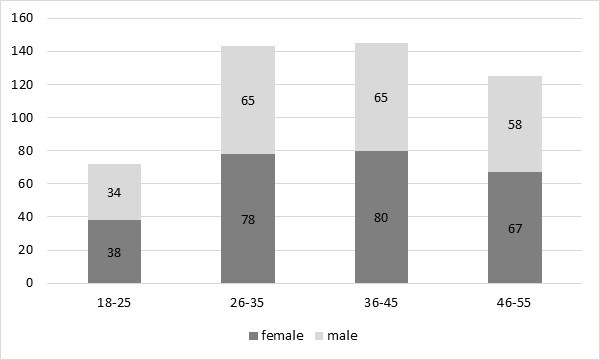
Table A1. Distribution of respondents by permanent and current place of living, %
| region of origin | East | Centre_North | South | West |
| Remained in place | 58.6 | 61.8 | 79.3 | 83.9 |
| Relocated within oblast | 7.4 | 6.9 | 5.2 | 5.7 |
| Relocated to another oblast | 23.5 | 15.6 | 3.4 | 2.3 |
| Moved out but then came back | 0.6 | 3.5 | 1.7 | 3.4 |
| Relocated abroad | 9.9 | 12.1 | 10.3 | 4.6 |
| Total No of respondents | 162 | 173 | 58 | 87 |
Table A2. Distribution of respondents by education and employment, %
| Education | Employment | ||
| high school | 3.3 | employed | 62.9 |
| incomplete higher/ technical | 23.1 | doesn’t work | 30.7 |
| BA | 13.2 | pensioner | 2.9 |
| MA | 57.1 | student | 3.5 |
| PhD | 3.3 | ||
Table A3. Income distribution of respondents, %
| Do you have enough money? | How much of household income do you spend on basics such as food and communal services? | What is your household monthly income? | |||
| not enough even for food | 6.5% | 75% + | 16.3% | < UAH 5k | 15% |
| we can buy food but it’s hard to buy clothes | 25.3% | 50-75% | 25.4% | UAH 5-10k | 23.3% |
| can buy food and clothes but hard to buy durables | 49% | 25-50% | 38.6% | UAH 10-15k | 22.8% |
| can buy durables | 17.5% | < 25% | 10.3% | UAH 15-20k | 15.5% |
| can buy very expensive things | 1.5% | - | - | UAH 20-30k | 12.3% |
| - | - | - | - | UAH 30-40k | 7% |
| - | - | - | - | UAH 40k+ | 4% |
Attention
The authors do not work for, consult to, own shares in or receive funding from any company or organization that would benefit from this article, and have no relevant affiliations