In April 2021, inflation hit more than 4% in the U.S. and the world is holding its breath. If the Federal Reserve starts to raise interest rates to fight inflation, all nations—big and small—are going to face a higher cost of borrowing. For many governments, firms, and households drowned in debt such an increase can prove devastating. For countries like Ukraine that heavily depend on global markets this could be very serious. But will inflation in the U.S. get out of control? Will the Federal Reserve raise interest rates?
I believe this scenario is unlikely for several reasons.
First, there is a massive slack in the U.S. economy. Just before the COVID crisis hit the world, the US labor market was slowly recovering from the Great Recession. Even at the end of 2019 employment-to-population ratio, a popular metric of how scarce labor is, was below the pre-Great Recession level. The pandemic destroyed millions of jobs and the latest reading of the ratio is below its lowest value since the start of the Great Recession (see Figure 1). In other words, the current state of the labor market is worse than it was at the trough of the Great Recession, one of the worst recessions in US history. At the trough of the Great Recession, output gap was more than 6 percentage points. That is, the actual output of the U.S. economy was approximately 1 trillion dollars below where its potential is.
Figure 1. Employment to population ratio
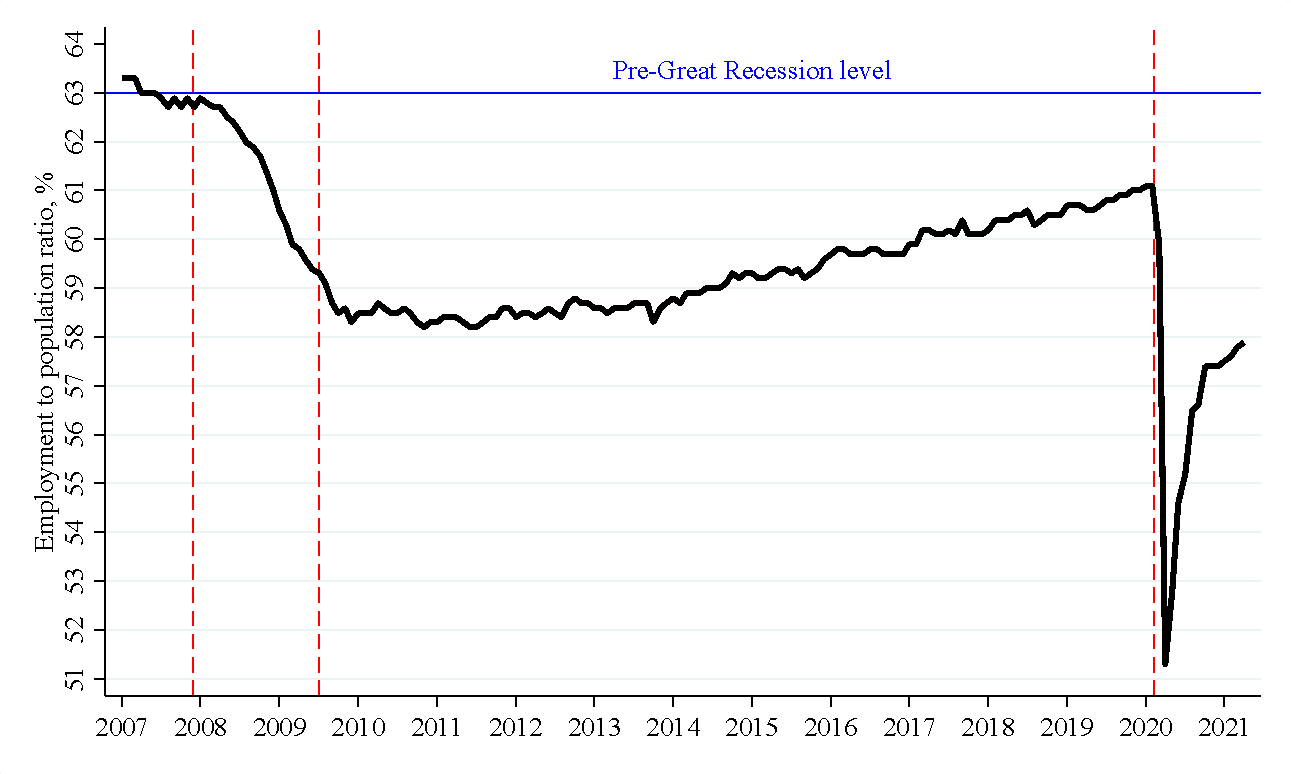
Notes: FRED database.
Why is this important? Macroeconomists posit that the more slack (underutilization of resources) you have, the lower inflation should be. This relationship is called the Phillips curve. Although there is some debate about whether the Phillips curve is alive or dead, if one uses the right specification, the curve is alive and well. Figure 2 uses international data to show the relationship between inflation gap (inflation minus expected inflation) and unemployment gap (difference between actual unemployment rate and “natural” unemployment rate, that is, the rate of unemployment one would observe if the economy was functioning normally). The figure documents a clear negative relationship: more unemployment, less inflation.
Figure 2. Phillips curve.
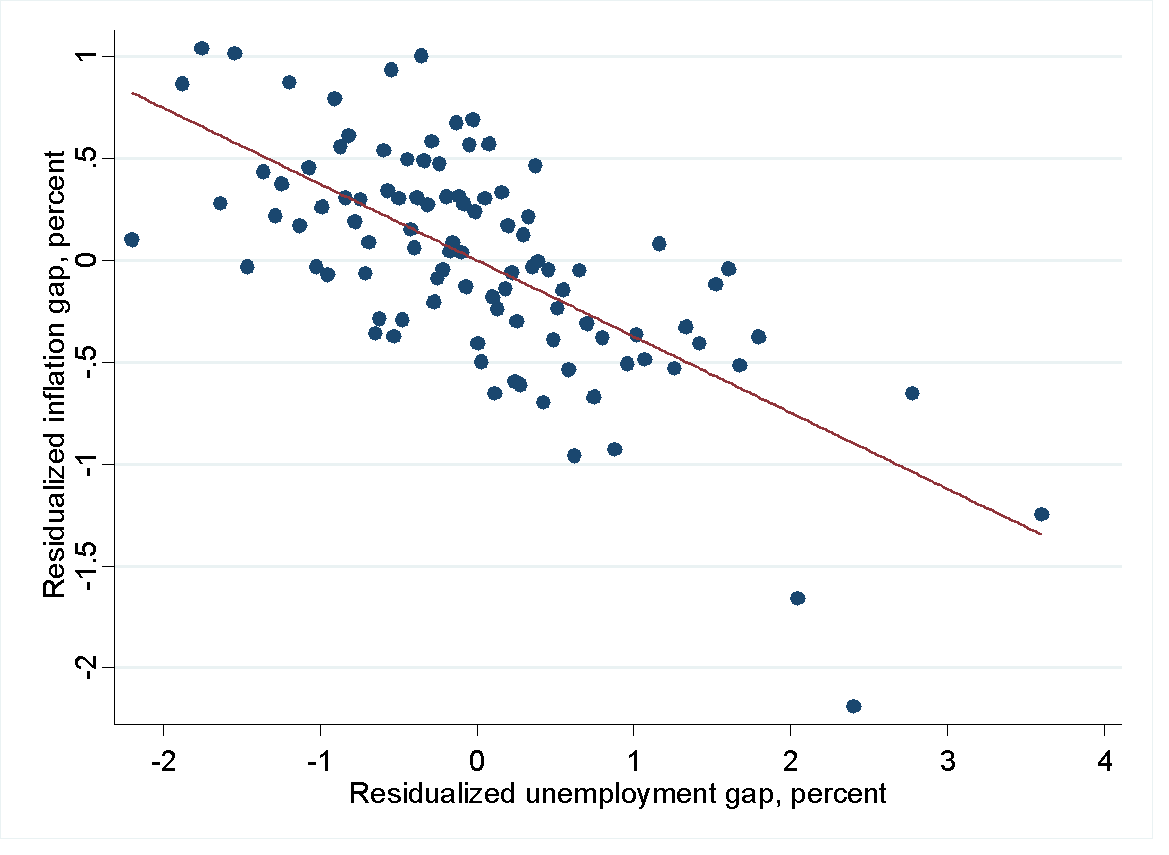
Notes: the figure shows a binscatter plot of unemployment gap (actual and natural unemployment) vs inflation gap (actual inflation minus expected inflation). Each point represents about 30 country/quarter observations. Source: Coibion, Gorodnichenko and Ulate (2019).
If there is so much underemployment in the U.S. economy, then it is not likely that we can have systematic inflation pressure. In other words, inflation can sometimes spike, but such spikes are unlikely to be persistent.
Second, the 1970s were characterized by unanchored inflation expectations. This means that when workers and firms expect high inflation, they set prices and demand wages in light of these expectations. As a result, wages and prices increase thus generating inflation. Expectations are fulfilled. People expected inflation and it happened. But this means that they should continue to expect more inflation and hence more inflation will happen. This vicious loop of self-fulling expectations is very hard to stop and it took an epic recession engineered by the Federal Reserve to stop this loop and then many years of tough monetary policy to anchor inflation expectations.
The U.S. economy is nowhere near unanchored inflation expectations. Figure 3 shows that professional forecasters (SPF, blue line) believe that inflation is going to be on average close to 2% (the inflation target of the Federal Reserve) per year for the next 10 years. Forecasters have this projection because they believe that the Federal Reserve will stop inflation in the bud if inflation becomes dangerous. And it makes sense. Over the last 10 years, inflation was barely above 2% and one has to go many years back to have serious inflation in the U.S.
Figure 3. Actual inflation and expected inflation.
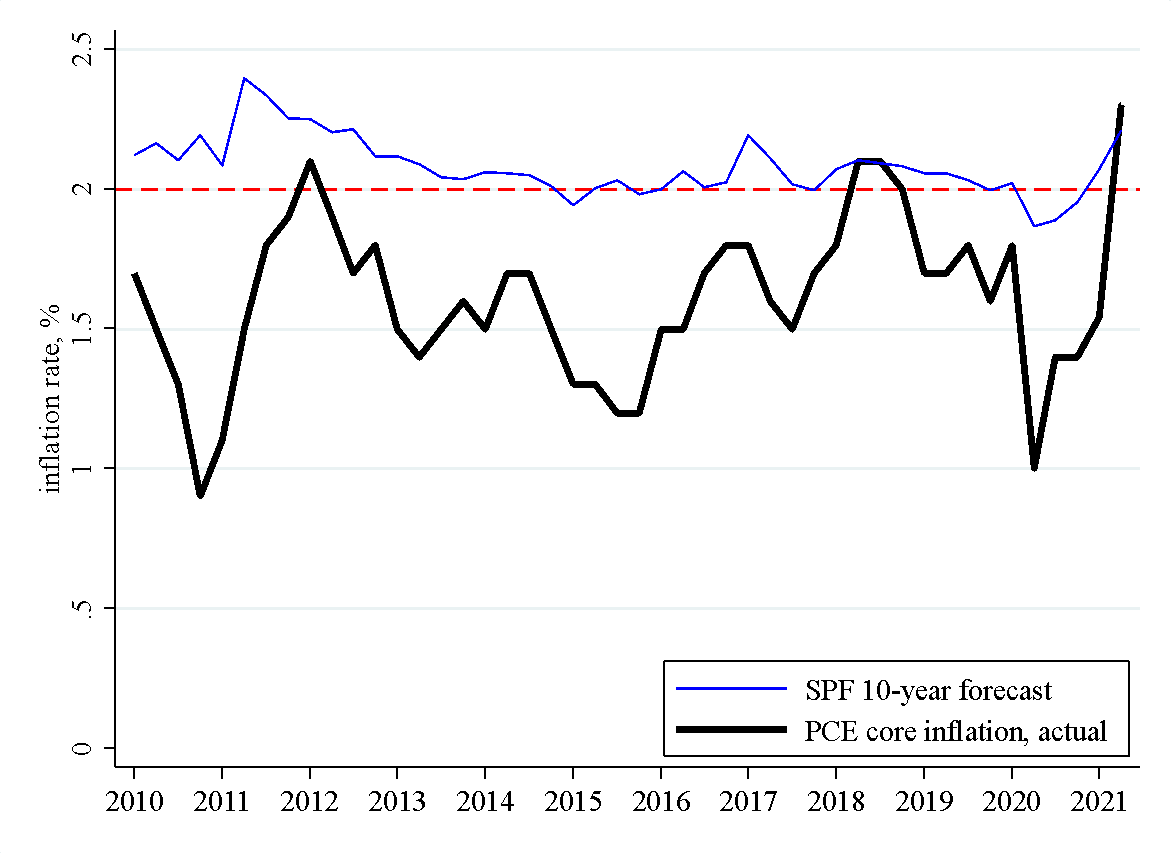
Notes: actual inflation is from the FRED database. Professional forecasts are from the Survey of Professional Forecasters (SPF) run by the Federal Reserve Bank of Philadelphia.
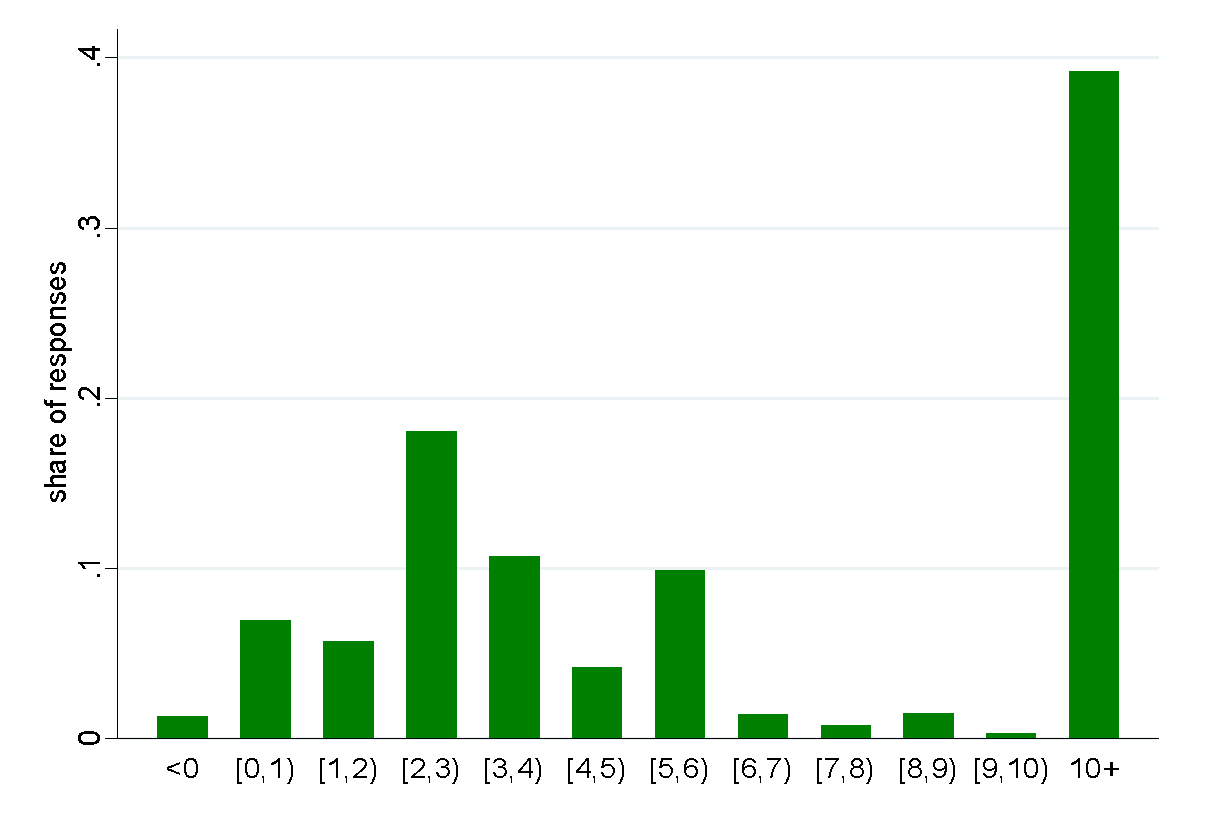
Third, one may be concerned that the US economy received too much stimulus from monetary and fiscal policy and households may think that the government will print money to pay for all the largesse. But the years of low and stable inflation pay off here. The vast majority of U.S. households do not pay attention to what the central bank is doing. Why should they? Inflation has been low and stable and how much difference does it make if it is 2.1% or 1.9%? As a result, most people don’t know the inflation target of the Federal Reserve: less than 20% can correctly state the target (see Figure 4). In a similar spirit, most people in the U.S. are unaware of fiscal deficits and government debt and don’t link current government debt or deficits to inflation. Expectations of CEO appear to have similar properties.
Figure 4. Households’ perception of the inflation target of the Federal Reserve.
Fourth, the Federal Reserve in the 1970s believed that inflation was cost driven and there is little the central bank can do to control inflation. Few people (if anybody) in the Federal Reserve share this view today. Instead, there is a firm belief that the Federal Reserve can and must control inflation to ensure price stability. Furthermore, the Federal Reserve uses careful language to avoid saying that they engineer inflation increases to help the economy. Instead, the communication emphasizes that the Federal Reserve cares about full employment. This brings us to the next point.
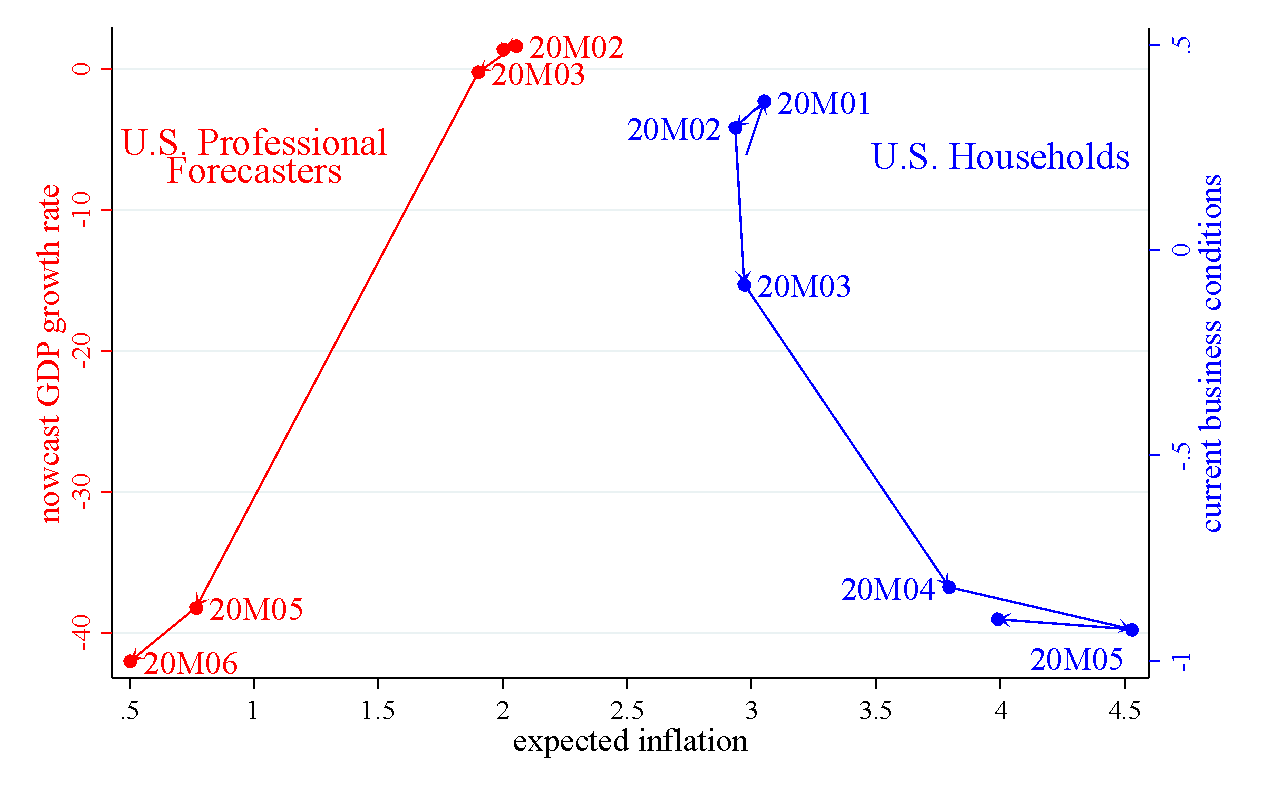
Fifth, unlike professional forecasters and macroeconomists, households view inflation as something bad. Specifically, households interpret inflation as a bad state of the economy, a state where unemployment is high. The COVID crisis illustrates this point clearly. As the pandemic was unfolding, professional forecasters downgraded their perception of output and reduced their inflation expectations, which is in line with basic macroeconomic theory (recall the Phillips curve). In contrast, households increased their inflation expectations as the economy collapsed. This means that households have a stagflationary view of inflation: high inflation and high unemployment go together. Why is this important? It is important because as the economy improves, households may revise their inflation expectations down thus lowering inflationary pressures in the economy.
Figure 5. Dynamics of inflation expectations and perceptions of current economic conditions.
Do these reasons mean that the U.S economy is in the clear and there is no inflation on the horizon? Forecasting is ungrateful business because so many things can happen in such complex systems as modern economies. For example, bottlenecks in the economy that raise prices today (lack of microchips, long delays in the shipment industry, people reluctant to return to the labor force because of COVID concerns, etc.) may be more persistent than many economists think. Firms may be forced to pass cost increases onto consumers. The boom in commodity prices is another source of concerns. Indeed, the price of gasoline is highly correlated with households’ inflation expectations (see Figure 6 for recent data). If commodity prices continue to stay high, this may “spook” consumers and raise their inflation expectations.
Figure 6. Price of gasoline and inflation expectations in the U.S.
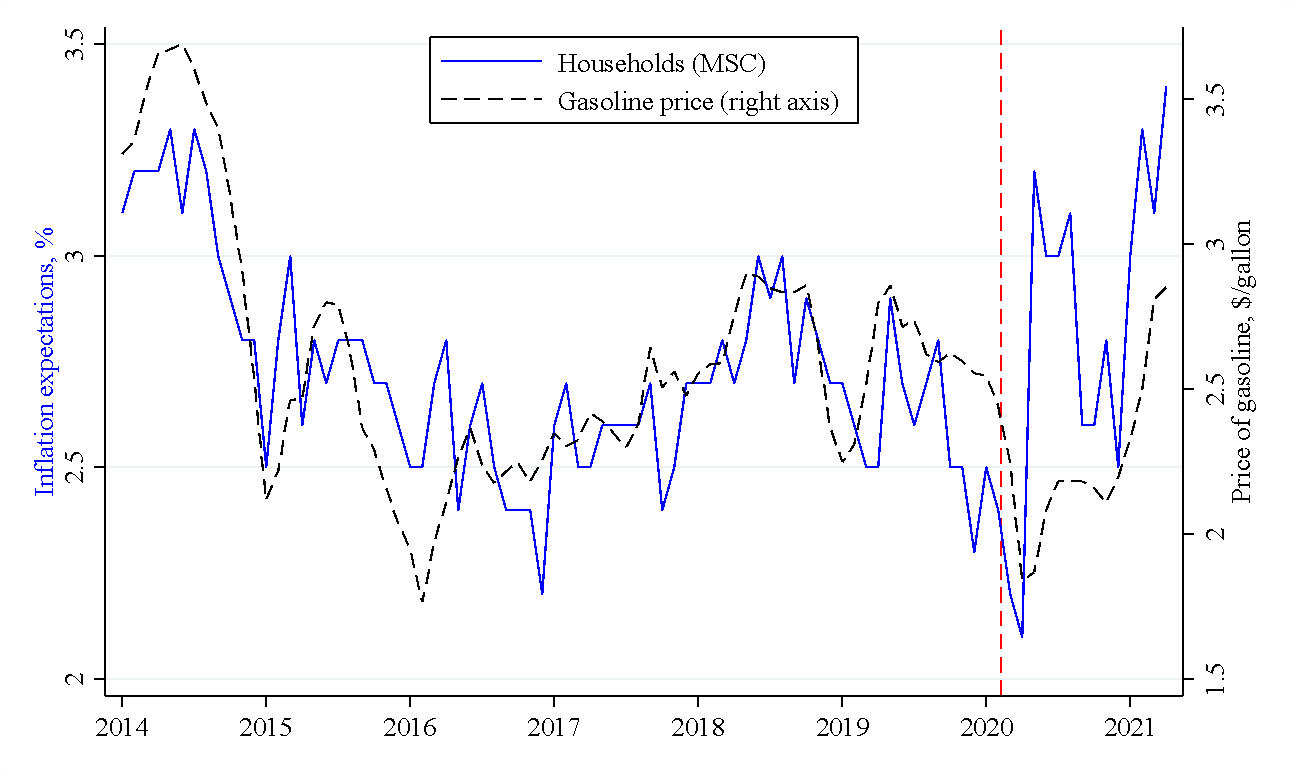
Notes: This figure updates the time series reported in Coibion and Gorodnichenko (2015). Households’ inflation expectations are from the Michigan Survey of Consumers (MSC). Expected inflation is for the one-year-ahead horizon.
In summary, the recovery from the COVID crisis is unique in many ways and we have little data to inform our forecasts on how the economy is going to behave in the short run. However, despite this uncertainty, it seems unlikely that one data point with high inflation can launch the U.S. economy onto the trajectory that leads to the 1970s. There is a lot of slack in the economy. Rational “players” such as financial markets and professional forecasters have anchored inflation expectations. Less informed players such as households and to some extent managers do not pay much attention to inflation. Improved economic conditions can lower inflation expectations of these players. The Federal Reserve has learned from its mistakes in the 1970s. These forces should be enough to keep inflation in check even if there are some headwinds. We are unlikely to be in the 1970s any time soon.

Attention
The author doesn`t work for, consult to, own shares in or receive funding from any company or organization that would benefit from this article, and have no relevant affiliations