Since the Maidan revolution and replacement of the government, Ukrainians hoped for quick reforms that would bring our country closer to the Western economies. However, for the first half of 2014 Ukraine has lost 2.5 points in the index of economic freedom and now stands at the last place by this indicator among 67 European countries (including Russia and Belarus). This article looks at the Index of Economic Freedom and its components to suggest the most urgent reform tasks.
Ukraine’s economic freedom score is 46.9 (1), making its economy the 162nd freest in the 2015 Index (2). Its score is 2.4 points lower than in the 2014 Index, due to decline of eight out of ten economic freedoms with especially grave deteriorations in property rights, management of government spending, and investment freedom. Ukraine is ranked last out of 43 countries in Europe, and its overall score is lower than the world average. Besides, Ukraine showed the second largest score decline among all countries included into the 2015 Index. Between 2013 and 2014 Ukraine’s economic freedom score increased by 1.1 points, with improvements in half of the 10 economic freedoms driven largely by gains in business freedom and monetary freedom [1].
Economic freedoms in Ukraine after the Maidan
One of the main tasks after the Euromaidan revolution remains unsolved: to dismantle the oligarchic politics and corruption within the government. That should stimulate business and economic development by making rules and regulations more transparent. But by looking at the index we can say that in the first half of 2014 there were no positive changes in such important indicator as property rights protection. Property rights protection in Ukraine remains poor, and even declined somewhat compared to 1998-2013 index (Figure 1). Pro-Western Ukrainians hoped that 2014 Euromaidan revolution would dismantle the oligarchic politics and deeply rooted cronyism that allowed large business owners to amass wealth by exploiting their access to those in power rather than through efficient management, but the judicial system remains weak, and contracts are poorly enforced [1].
There is some improvement in the freedom from corruption, but according to the Index, in 2014 the level of corruption returned to the 2009’s figure (the 2010 Index reflects 2009 data, i.e. pre- Yanukovych government). The minimal level of corruption in Ukraine was observed in 1995-1998 during the first Kuchma term. Also, in the period of Yushchenko presidency freedom from corruption increased gradually and reached the maximum in 2007. When the new (2016) index is published, we will be able to see whether 2014 increase was the beginning of a positive trend or whether it was a temporary spike, like in 2010, before the new government grasped the rent streams.
Figure 1. Rule of Law in Ukraine
![Source: [1]](https://voxukraine.org//wp-content/uploads/2015/09/fig1.png)
Source: [1]
Fiscal freedom increases when tax burden on individuals and businesses decline (Figure 2). In Ukraine in 2014, the total tax burden reached 38.9 percent of domestic income, and government spending amounted to 49 percent of GDP (government spending index is the highest for the entire period) [1]. The maximum value of fiscal freedom was observed right after the Orange revolution (2004-2005), while government spending as a share of GDP declined during 2000-2005 mostly due to rapid GDP growth. After 2007 fiscal freedom remained rather stable while the share of government spending in GDP constantly increased – mostly due to high social promises made by all Ukrainian governments.
Figure 2. Limited Government in Ukraine
![Source: [1]](https://voxukraine.org//wp-content/uploads/2015/09/fig2.png)
Source: [1]
Perhaps the most important for investors is the regulatory efficiency index, which includes three components: Business Freedom index measured by time and cost of procedures for opening and running a business, Labour Freedom index which reflects easiness of hiring and firing and general flexibility of labour market, and Monetary Freedom index which takes into account inflation and price controls. Contrary to expectations, Business Freedom index declined after 2003 and started rising since 2009. A similar, although less pronounced pattern is observed for monetary freedom index, whereas labour freedom has gradually declined during the last 10 years. We observe some decline in all three components between 2014 and 2015 indices, but it is too early to make conclusions about a trend. One thing is clear however – labour market regulation should be considerably liberalized (Figure 3).
Figure 3. Regulatory Efficiency in Ukraine
![Source: [1]](https://voxukraine.org//wp-content/uploads/2015/09/fig3.png)
Source: [1]
The last component of Economic Freedom Index is Open Markets (Figure 4), which includes three sub-indices: Financial Freedom (measured by the degree of the Central Bank independence and ability of the government to restrict or impact banking sector operations), Investment Freedom, which includes measures of equal treatment of foreign and domestic investors and investors’ rights protection, and Trade Freedom, which is a composite measure of tariff and nontariff barriers to trade.
Concerning these three indicators, we see a two-stage reduction in financial freedom after 2008 (from “strong government interference” to “extensive government interference”) connected to loss of Central Bank independence and increased state involvement into the banking sector (due to the bail-out of a few large banks after 2008 crisis).
Investment freedom has seen the largest decline in 2001 (probably related to the fight against capital flight and usage of offshores for tax evasion), and it further declined in 2008 and 2014, when FX and capital controls were introduced to fight the financial crises.
Trade freedom has been gradually increasing as Ukraine is implementing its WTO obligations.
Figure 4. Open Markets in Ukraine
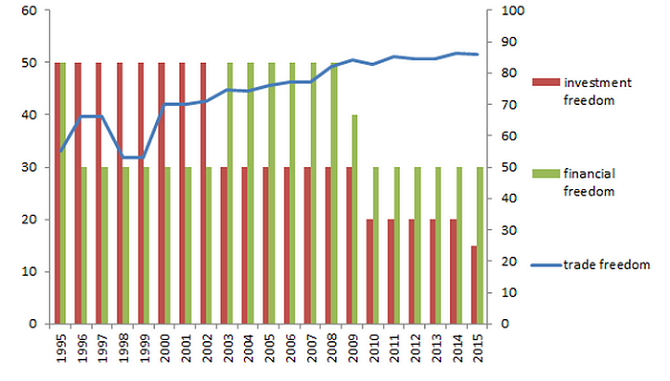
Source: [1]
Ukraine’s way compared to Georgia
As can be seen from the previous discussion, the Ukraine’s path to modernization implies a lot of difficulties and is far away from the ideal one. But maybe there is no easy and correct way on the path of reforms?
As the possible country for comparison here could be Georgia, where in 2004, after the “rose Revolution”, liberal reforms were implemented. The reforms in Georgia could be characterized as radical and rapid – they almost immediately started working and the results of the reforms were quite fast (Figure 5).
Figure 5. Comparison of changes in the indexes of economic freedom between Ukraine and Georgia 1995-2015
![Source: [1]](https://voxukraine.org//wp-content/uploads/2015/09/fig5.png)
Source: [1]
Since 2005 Georgia’s economy faced reaped the benefits of reforms implementation (2006 Index). To the contrast, in Ukraine after the Maidan economic freedoms declined (2015 Index compared to 2014). Of course, the results of the reforms will not be immediate, but the positive impact of Georgian reforms was observed already in 2005.
In 2004 after the Orange Revolution, there was a spike of Economic freedom in Ukraine, unfortunately followed by the gradual reduction. Figure 5 clearly shows the difference between missing a chance for modernization (as Ukraine did after the Orange revolution) and using it to the greatest extent, as in Georgia. A small spike in the Freedom Index for Ukraine in 2014 (reflecting the data for 2012-2013), was followed by a decline caused by worsened property rights protection, increased government spending, and deteriorating investment and labour freedom (these last indicators in 2015 Index are the lowest since 1995).
Georgia’s radical reforms first of all were successful in the protection of the property rights and fighting corruption (Figure 6). That success was possible because of the rapid and radical reforms in the government sector. Georgia sharply reduced the number of government units and the number of officials with a substantial increase in salaries of civil servants and punishment of corruption. One of the most radical reforms was a complete replacement of state traffic police staff.
Ukraine is also trying to fight corruption and replicate Georgian police reform but it does so slowly. A large drop in 2015 property rights index can be explained by expropriation of some property of former officials after the Maidan Revolution, and also by changes in the court system in early 2014, which made the system practically inoperational. If the reforms continue, we will see some improvement in the property rights protection index in Ukraine (in Georgia, improvement in the protection of property rights was observed only in 2007 – three years into the reform process). In Ukraine, freedom from corruption index somewhat increased after 2004, and then dropped again, as bureaucracy and business realized that the new government is quite tolerant to it. Currently it is too early to make any predictions on the long-term anti-corruption trend, since we observed a small improvement in corruption freedom index each time a new government took the office (this is probably the time when “old” rent-seekers are replaced with the “new” ones).
Figure 6. Comparison of changes in property rights and freedom from corruption in Ukraine and Georgia 1995-2015
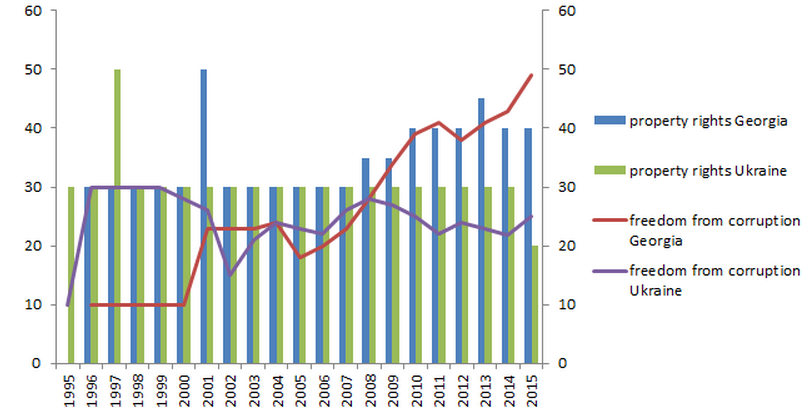
Source: [1]
One of the most important reforms in Georgia were implemented in the sphere of business freedom (Figure 7).
Figure 7. Comparison in business freedom index in Ukraine and Georgia 1995-2015
![Source: [1]](https://voxukraine.org//wp-content/uploads/2015/09/fig7.png)
Source: [1]
Georgian’s reformers have simplified bureaucratic procedures for the business and reduced state control. They “purged” the tax service thus starting the new relationships between taxpayers and tax authorities. In addition, the number of taxes and their rates were noticeably reduced.
Figure 7 shows that business freedom indices moved in the opposite directions in Georgia and Ukraine. Interestingly, the easiness of doing business improved under Yanukovych, slightly exceeding the pre-2004 level, but this was “compensated” by poor property rights protection and a rise in corruption.
An important part of Georgian reforms was improvement of investment legislation, which has led to an increase of the volume of investment into the economy (Figure 8). Before that, Georgia has imposed few formal restrictions on investments and as a result, the investment freedom dropped during second half of 2003 – first half of 2004. During that time also opaque regulations had been complicated by the administrative procedures and frequent requests for bribes.
In Ukraine, due to political instability at the end of 2013 – first half of 2014 the inflow of foreign direct investment fell practically to zero. In 2009 it fell down because of the Financial Crisis and in 2002 because of some constraints on the flow of investment capital – hidden import barriers and increased costs of importing.
Figure 8. Comparison in investment freedom index in Ukraine and Georgia 2000-2015
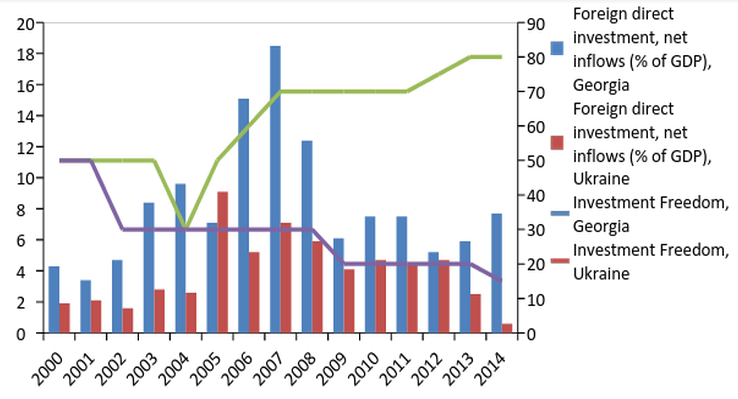
Source: [1]
Explanation of the difficulties of implementation of reforms in Ukraine
During the last year and a half, more economic reforms as classified by Melzig et al. (2005) (3) have been introduced while democratic reforms, namely, the rule of law and public governance are lagging behind. Melzig et al (2005) show that economic and democratic reforms reinforce each other, although economic reforms have greater impact on democratic reforms than vice versa (Figure 9). Still, at some point lack of democratic reforms (mainly the rule of law and corruption intolerance) becomes a major impediment for further development of economic changes.
Figure 9. Empirical evaluation of causal interrelations between economic growth and democratic/economic reforms (4)
![Source: [4]](https://voxukraine.org//wp-content/uploads/2015/09/fig9.png)
Source: [4]
The importance of institutions has been stressed also by Acemoglu et al. (2005), who have stated that existing political institutions and distribution of resources allocate “de jure” and “de facto” political powers, which, therefore, could stimulate changes in existing economic rules (Figure 10).
Figure 10. Impact of political power distribution on the economic development
![Source: [5]](https://voxukraine.org//wp-content/uploads/2015/09/fig10.png)
Source: [5]
Unlike Ukraine, Georgia could fight corruption at all levels of the government and thus implement effective economic reforms.
Where to go?
The main success in Georgia and the possibility for implementation of reforms was caused by the fact that the new government in 2004 could prosecute corrupt bureaucrats and ex-officials. 2004 year in Georgia was characterized by the series of arrests of the most corrupt senior government officials and, in exchange for softer sentences, return of hundreds of millions of dollars to the treasury. This experience has been borrowed from the arsenal of methods of combating the Mafia in Italy and the United States.
Has the new Ukrainian Government arrested some corrupt ex-officials? Unfortunately, in Ukraine the connections between the government and business remain tight, and vested interests are stronger than the desire for reform.
Figure 11 shows the major results of reforms in Ukraine and Georgia between 1995 and 2015.
Figure 11. The major achievements of Ukraine (upper table) and Georgia (lower table) in reforms during 1995-2015
![Source: [1]](https://voxukraine.org//wp-content/uploads/2015/09/fig11.png)
Source: [1]
The main attention should be paid to the improvement of property rights protection because well protected property rights in a country are absolutely necessary for business development and investment. Georgia reformed its judicial system, penitentiary system, criminal legislation to strengthen the property rights protection.
To improve the Investment Freedom, Ukraine could also use Georgian experience: elimination of restrictions on foreign investments, open and non-discriminatory trade relations with the rest of the world, equal status of foreigners etc.
Fiscal Freedom could be strengthened by reducing of the number of taxes and tax rates.
Deregulation is necessary for the Business Freedom improvement.
The participant of MindSketch July Competition
Notes
1.The Index of Economic Freedom is an annual index and ranking created by The Heritage Foundation and The Wall Street Journal in 1995 to measure the degree of economic freedom in the world’s nations. The Index of Economic Freedom measures 10 factors: Rule of Law (property rights, freedom from corruption); Limited Government (fiscal freedom, government spending); Regulatory Efficiency (business freedom, labor freedom, monetary freedom); and Open Markets (trade freedom, investment freedom, financial freedom all). All the factors are equally weighted in order not to bias the overall score toward any one factor or policy direction. The index scores use statistics from organizations like the World Bank, the International Monetary Fund, the Economist Intelligence Unit, the Transparency International and other [2]
2.For the 2015, most data covers the second half of 2013 through the first half of 2014. To the extent possible, the information considered for each factor was current as of June 30, 2014.
3.The economic reform indicators are: (1) price liberalization; (2) trade and foreign exchange liberalization; (3) small-scale privatization; (4) large-scale privatization; (5) enterprise governance reforms; (6) competition policy; (7) bank reforms; (8) non-bank financial reforms; and (9) infrastructure reforms. The democratic reform indicators are: (1) electoral process; (2) civil society development; (3) independent media; (4) anti-corruption measures; (5) rule of law; and (6) public governance
4.Here: “+”- the impact empirically had been found, “-“ – the impact empirically hadn’t been found
References
[1] Index of economic Freedom (2015)
[2] Beach, W.W., Kane, T. (2008), “Methodology: Measuring the 10 Economic Freedoms”
[3] Foreign direct investment, net inflows (% of GDP)
[4] Melzig R, Pleva, P. and Sprout, R. (2005), “Economic Reforms, Democracy and Growth in Eastern Europe and Eurasia”, USAID/E&E/PO Working Paper Series on the Transition Countries September 2006.
[5] Acemoglu, D., Johnson, S., and Robinson, J.A. (2005), Institutions as a Fundamental Cause of Long-Run Growth. In: Handbook of Economic Growth, ed. by Philippe Aghion and Stephen Durlauf, Elsevier, Amsterdam.

Attention
The author doesn`t work for, consult to, own shares in or receive funding from any company or organization that would benefit from this article, and have no relevant affiliations