Commodity price spikes at the outset of Russia’s full-scale invasion of Ukraine significantly contributed to global inflation in 2022-23, which caught many policymakers off guard in both its intensity and persistence. This column relies on a nonstationary competitive storage model to demonstrate that, beyond temporary surge, the war-induced reduction in Ukraine’s acreage caused an upward shift in grain price trends.
The results imply that corn and wheat prices may remain above their pre-invasion trajectories. Incorporating these dynamics into forecasting models can improve predictive accuracy, offering a clearer basis for policy responses, especially in emerging markets.
Between 2021 and 2023, headline inflation surged to multi-decade highs in both advanced and developing economies, defying earlier forecasts that had expected only a temporary spike. One of its key drivers was Russia’s invasion of Ukraine, which triggered a sharp rise in commodity prices, largely not reflected by commodity futures markets (Arce et al., 2023; Chahad et al., 2023; Blanchard and Bernanke, 2023). The war brought severe logistical disruptions, hindering Ukraine’s ability to export grains. Alongside territorial losses, this led to a drop in the area planted, reducing global grain availability in a way that persists to this day.
In a recent paper (Bondarenko, 2025), I analyze these medium-term shifts using a partial equilibrium competitive storage model that endogenizes price trends. The findings confirm that prices not only jumped on impact but that the underlying trend also moved higher. This implies that the invasion shock had both transitory and persistent effects, calling for a more robust policy response from central banks. In an era of geoeconomic fragmentation and climate change, the frequency and severity of such shocks, whether from wars or climate-related disasters, could increase. Policymakers will therefore need to engage in deeper analysis of commodity markets to make better-informed policy choices.
Europe’s breadbasket with global reach
With rich black-soil farmland and large-scale grain agriculture, Ukraine regularly produces roughly three to four times as much grain as it consumes. Thus, despite Ukraine’s share of global production being relatively modest – in the range of 3% of the world’s wheat and corn, – it ranks among the world’s largest exporters. Between the 2016/17 and 2020/21 marketing years (MY), around 10% of global wheat and 14% of corn exports originated from Ukraine, making it the top-five wheat and top-four corn exporter.
This export focus means dependence overseas. Many developing countries in Africa, the Middle East and Asia rely heavily on Ukraine’s grain, with 92% of Ukraine’s wheat exports going to these countries in 2016–2021. Ukraine supplied over 20% of wheat imports for Tunisia, Libya, Lebanon, Thailand, Bangladesh, as well as large wheat importers Egypt and Indonesia. Similarly, Israel, Tunisia and Libya each sourced more than half of their corn from Ukraine, and Egypt about 30%. In short, as only a fraction of Ukraine’s harvest stays at home, any production shortfall almost entirely affects exports, translating quickly into higher prices and shortages for vulnerable importers (McGuirk and Burke, 2022).
Figure 1: Shares in world production by country in 2016/17 – 2020/21 MY
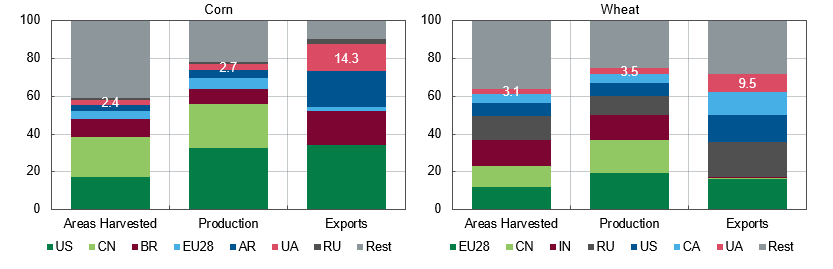
Source: USDA PSD, own estimates.
Unsurprisingly, when the full-scale war almost halted trade with Ukraine[1] (Djankov and Blinov, 2022), wheat prices had surged by 40% by May 2022, surpassing $500 per ton, and corn prices had risen by 25%. However, Ukraine’s 2021/22 MY harvest was mostly saved: by early 2022, Ukraine had already harvested and even shipped the bulk of it (about 75%, or 18 Mt, of wheat and 57%, or 19 Mt, of corn). Accordingly, once the remaining grain began to move – initially via the EU’s overland “solidarity lanes” and later through the Black Sea Grain Initiative – wheat prices fell 27% from their May peak by August, while corn prices declined by 15% over the same period.
Nevertheless, the overall price level for the 2022/23 MY remained close to that of 2021/22, despite a gradual decline in prices throughout the year. Not only uncertainty about the durability of both land and sea export routes persisted[2], but the overall availability of grains from Ukraine declined. About 20% of winter wheat, planted in the fall of 2021, was trapped under Russian control or in zones of active combat, where it could not be farmed. Spring planting was delayed and reduced as well. Facing high input and transportation costs, producers partly shifted from grains, especially corn, to oilseeds (profitable and crushable at home) or crops consumed locally. As a result, Ukraine’s wheat and corn trend areas[3] contracted by approximately 25%, translating into a 0.7–0.8% reduction in global planted area. Meanwhile, according to USDA estimates, trend yields were unaffected by the invasion, with the entire impact absorbed through reduced acreage.
Overall, Ukraine’s trend wheat and corn areas remained nearly one-fourth below its pre-war trajectory three years after the beginning of the full-scale war. This decline already reflected both the physical toll of war and disruptions to export infrastructure. Yet, if Ukraine’s ports had remained fully non-operational beyond the first few months of the invasion, the drop in grain-planted areas could have been far more severe (more than 60%). Alternative export routes via EU “solidarity lanes” and Danube ports could carry, at best, just over half of Ukraine’s normal grain exports and about a third in an average month. Were it not for the sequence of successful operations of Security and Defense Forces of Ukraine that allowed ports to resume operations, world harvested areas could have declined by about 2%.
Evidence from a commodity storage model
To quantify the impact of these structural shifts, I apply an extended commodity storage model to global wheat and corn markets. Unlike the standard supply–demand framework, the storage model includes a competitive inventory holder who smooths prices over time by buying grains when prices are low and selling them when prices are high. I further extend the model by incorporating trends in key structural variables, namely consumption, acreage, and yields. This setup enables the estimation of endogenous price trends, offering a more grounded and interpretable view of trend movements than traditional statistical filters.
Figure 2: Actual and trend real grain prices

Source: own estimates
When applied to 1987–2024 data, this framework not only replicates key empirical features of wheat and corn prices (first‑ and second‑order autocorrelations and coefficient of variation) but also helps in scenario analysis. Since trend dynamics evolve only with actual production shifts, the model does not show any price‑trend impact until the 2022/23 MY, when Ukraine’s grain area declined by about 25%. In that first post‑invasion MY, the corn price trend edged up less than 0.6% versus a no‑war counterfactual while wheat saw a somewhat larger initial increase of about 3.3%. However, as Ukraine’s acreage shortfall persisted, these trend divergences widened to approximately 1.4% for corn and nearly 5% for wheat by 2024/25 MY. These shifts are expected to linger, despite the stabilization of spot markets.
Even so, these shifts are modest compared with the hypothetical outcome had Black Sea exports remained fully blocked. Since cuts in planted areas are deeper in such a scenario, the model sees trend prices soaring by as much as 14% for corn and 22% for wheat by the war’s third year. These results illustrate that structural shocks to production in major exporting countries can have disproportionate effects on global price trends. Ensuring their continued access to global markets, particularly Ukraine’s, is therefore a matter of global food security.
Outlook and policy recommendations
Beyond retrospective analysis, the structural storage model developed in Bondarenko (2025) can generate trend price forecasts, based on trend production and consumption growth. As an illustration, the paper uses production and consumption projections from the OECD-FAO Agricultural Outlook 2024-2033. Ukraine’s post-2022 acreage shortfall is embedded in these inputs, ensuring the model reflects the ongoing supply disruptions caused by the war.
Model-based projections show that the effects of the invasion on trend prices indeed persist throughout the forecast horizon. Although the gap between pre- and post-invasion trends gradually narrows as the relative size of Ukraine’s acreage shortfall to global totals diminished, the upward shift in price trends remains. For policymakers, this highlights the importance to look beyond short-term price volatility and account for lasting structural changes in agricultural fundamentals.
One practical application lies in improving price forecasts. When trend estimates from the storage model are used in a calibrated AR(1) model, the predictive accuracy improves by more than 19% over a random walk at both 24-month and 36-month horizons. This improvement is notable, especially when compared to futures prices, which often show similar or worse performance relative to a no-change forecast beyond a one-year horizon (see also Alquist et al., 2013). If the AR(1) model uses a constant mean or a linear trend instead of the CSM trend, its predictive accuracy deteriorates by approximately 7% to 13%.
Table 1. RMSE of calibrated AR(1) models relative to random walk
| Corn (07.2016 – 06.2021) | Wheat (07.2011 – 06.2021) | |||||||
| Futures | Mean | Linear trend | CSM trend | Futures | Mean | Linear trend | CSM trend | |
| 1 | 1.06 | 1.00 | 1.00 | 0.99 | 0.95 | 1.00 | 0.99 | 0.99 |
| 2 | 1.04 | 0.99 | 1.00 | 0.97 | 0.95 | 0.99 | 0.99 | 0.97 |
| 6 | 1.03 | 0.96 | 0.97 | 0.92 | 0.96 | 0.97 | 0.97 | 0.94 |
| 12 | 1.14 | 0.95 | 0.95 | 0.87 | 1.03 | 0.95 | 0.97 | 0.93 |
| 24 | 1.07 | 0.91 | 0.89 | 0.79 | 0.98 | 0.85 | 0.90 | 0.81 |
| 30 | 1.06 | 0.86 | 0.85 | 0.77 | 0.96 | 0.81 | 0.87 | 0.77 |
| 36 | 0.84 | 0.83 | 0.79 | 0.78 | 0.84 | 0.73 | ||
Assumes that real monthly prices pt follow a simple AR process of the form pt–t=ρpt-1–t-1+t, where t represents the trend component, which can be specified as a constant mean, a linear trend, a CSM trend, and is a calibrated parameter. The CSM trend is re-estimated for the July–June periods using the method of simulated moments on the data from the archived OECD-FAO Agricultural Outlooks. The out-of-sample testing period for corn is shorter, as production and consumption data are absent in earlier editions of the Outlook. Futures are adjusted by actual U.S. CPI to ensure comparability.
Source: own estimates, Bloomberg.
These accuracy gains over traditional forecasting approaches are relevant for central banks, which must produce reliable inflation forecasts to anchor inflation expectations. For example, a 1% increase in food inflation translates into a 0.1–0.2 percentage point rise in headline inflation in advanced economies and as much as 0.4–0.5 points in emerging markets (EM), where food comprises a higher share of the CPI basket . In EM countries, the foreign exchange (FX) market adds another layer of vulnerability. For food exporters like Ukraine, where grains accounted for almost 23% of total exports in 2024 (up from 18% in 2021), price swings threaten vital foreign currency earnings. Meanwhile, in food-importing countries, rising import bills can trigger currency depreciation, amplifying inflation. In both cases, more accurate forecasts reduce uncertainty around external balances, making it easier to manage FX volatility and reserves.
Conclusions
The inflation surge of 2021–2023 has reminded policymakers that commodity prices can still exert a disproportionate influence on headline inflation, even in advanced economies (Goujard and Beynet, 2022; Soldani et al. 2023). While Russia’s invasion of Ukraine was an extraordinary shock, future disruptions may arise from extreme weather events, such as floods or droughts, which are becoming increasingly frequent due to climate change (IPCC, 2021). In such circumstances, overreliance on agnostic assumptions, such as futures-implied prices, creates a risk of significant inflation forecast errors.
Although monetary policy cannot meaningfully influence agricultural supply or demand in the short run, recurrent or persistent forecast errors can undermine policy credibility and de-anchor inflation expectations. Policymakers should therefore work on extending their analytical toolkit with models better suited to capture dynamics in commodity markets.
[1] Uncertainty about sanctions on trade with Russia – another major grain exporter – likely contributed to the initial price spike. However, despite numerous claims by Russia, the sanctions never directly targeted international trade in agriculture; they applied only to Russia’s trade with sanctioning countries and regions, such as the U.S. and the EU.
[2] Russia repeatedly obstructed the Black Sea Grain Initiative, and protests over grain imports also began to emerge in neighboring countries.
[3] Trend area is the medium-term variation in areas planted, estimated with the HP filter. The estimation period for Ukraine spans from the 1987/88 to 2021/22 MY. The trend is then manually adjusted to reflect the abrupt drop observed in the actual data.
Photo: depositphotos.com/ua

Attention
The author doesn`t work for, consult to, own shares in or receive funding from any company or organization that would benefit from this article, and have no relevant affiliations