Ukraine’s port tariffs[1] are 2 to 3 times above those at comparable ports in the region and at competing export ports elsewhere, and there is a substantial scope for their reduction[2]. On one hand, overly high port tariffs essentially deprive Ukraine’s exporters and domestic producers of additional revenues and put an additional burden on consumers in the form of higher consumption prices. On the other hand, they are an important source of revenues for the Government of Ukraine, as 75% of net profits generated by the Ukrainian Sea Port Authority (USPA) port charges are transferred to the State Budget in the form of dividends, along with the profit tax.

On September 6th, 2017 the Government of Ukraine made a decision to cut state regulated port tariffs by up to 20% as of January 1st, 2018[3]. At the same time, the dividends will be reduced from 75% to 50% of net profits. A parallel work on the New Methodology of Calculating Port Tariffs is underway. This methodology will introduce best practices in establishing port tariffs and it is expected to further reduce port tariffs in Ukraine. In this paper we analyse and quantify economic and fiscal impacts of the proposed reductions in dividends for a range of feasible port tariffs cuts on the Ukrainian economy, and show that port tariff cuts can generate up to 1% GDP growth and substantial fiscal gains for Ukrainian economy.
Scope for reduction of sea port tariffs and scenarios description
Our analysis is based on the seven state regulated sea port tariffs (port tariffs in the following) that are the subject of the Methodology and of the Government decision mentioned above. They include tonnage dues, light dues, berth dues, canal dues, anchorage dues, administration dues and sanitary dues. These tariffs are established and regulated by the Ministry of Infrastructure/Ukrainian Sea Port Authority (USPA) and are paid mainly to the USPA[4] and they dominate in the structure of the vessel call costs, i.e. 60% to 70%. Vessel call costs in Ukraine are way too high in international comparison (see Figure 1), thus increasing trade costs for Ukraine and making Ukrainian ports uncompetitive.
Figure 1 Comparison of Iron Ore Vessel Costs for a Cape Size Dry Bulk Carrier
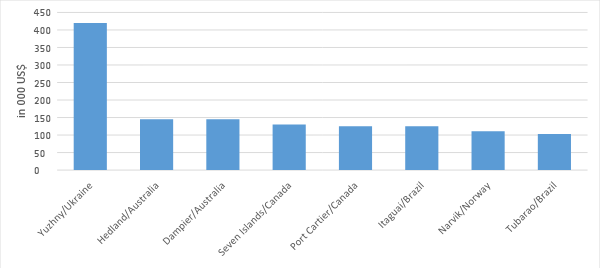
Source: data of the major iron ore exporter
The most widely used approach to port pricing is based on port costs, i.e. port tariff revenues should be in line with their costs. That is why the best starting point for understanding why Ukrainian port tariffs are high is the Financial Statements of the Ukrainian Sea Port authority (USPA), which show revenues from sales in 2016 at UAH 7.3 billion compared with reported costs of only UAH 2.6 billion[5]. The share of revenues generated by the state regulated port tariffs (4.9 billion UAH) reached almost 70% of the USPA’s total revenues (7.3 billion UAH).
Both sets of revenues, however, are about 2.7 times as high as their respective costs. The reduction in port tariffs that would be necessary to bring them in line with costs (i.e. to make them ‘cost-based’) can therefore be calculated at 63%. In the paper we also look at other port tariffs cut scenarios, ranging from 10% to 70% to incorporate other reform alternatives mentioned above.
Table 2 USPA Income statement and Port Tariffs Revenues and Costs, 000’UAH
| Income statement, 000’UAH | 2014 | 2015 | 2016 |
| USPA revenue | 4,002,291 | 6,810,663 | 7,297,604 |
| Costs | 1,396,365 | 1,946,733 | 2,633,760 |
| Gross profit (loss) | 2,605,926 | 4,863,930 | 4,663,844 |
| Ratio of Revenues to Costs | 2.87 | 3.50 | 2.77 |
| Port tariffs: Revenues and Costs | |||
| Revenues accrued from port tariffs | 2,706,558 | 4,918,959 | 4,946,145 |
| Costs | 1,517,993 | 1,326,079 | 1,835,063 |
| Gross profit on Port Tariffs | 1,188,565 | 3,592,880 | 3,111,082 |
| Ratio of revenues to costs | 1.78 | 3.71 | 2.70 |
Source: Own presentation using USPA data
Benefits to the Ukrainian Economy
A starting point in quantification of economic benefits is the current average port tariff, which is $1.47/tonne. It is based on port tariffs revenues of $198 mln (UAH 4.95 bn) and port traffic of 131 million tonnes in 2016[6]. Then the list of the main economic impacts of the proposed reductions in tariffs to the Ukrainian economy includes:
1. Injection of additional income into economy. Port tariffs are nothing else than trade costs and each US$ we cut on port tariffs/trade costs will be injected back into the economy in the form of higher revenues to exporters or producers (farmers, mining companies, etc.). These benefits would then be passed on to circulate in the economy in the form of:
- additional profits and investment (see next paragraph) by exporters, traders, farmers, miners and producers;
- additional government income and expenditure via higher taxes on the additional money in circulation;
- additional wages/lower import prices and therefore consumer expenditure.
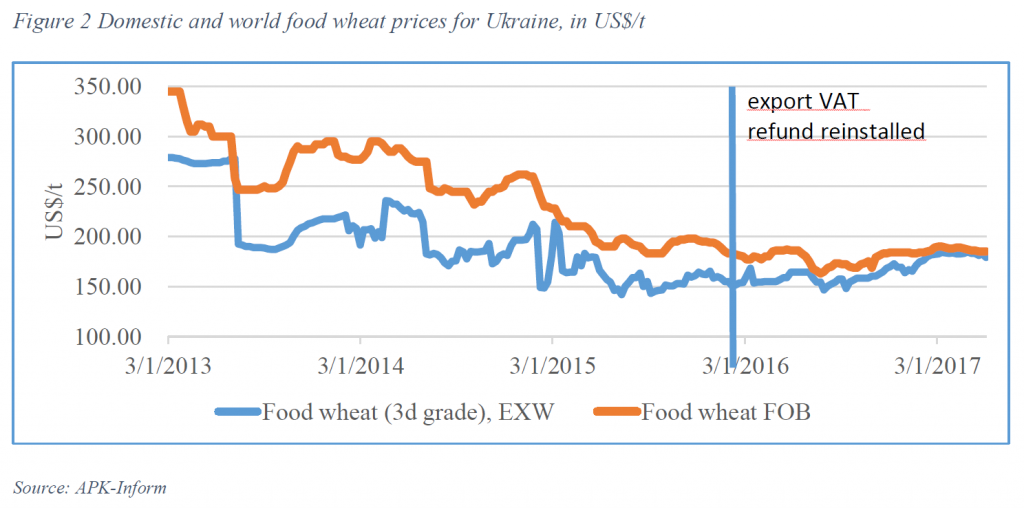
The distribution of the gains in the supply chain due to lower port tariffs will depend on the structure of the supply chain, i.e. market power of supply chain participants. In the agricultural supply chain, however, especially in the grains supply chain, the chances are that the farmers will end up as the ultimate beneficiaries. Grain trading is a very competitive sector, wherein the largest traders are able to export no more than 10% of total exports[7]. That means that the competitive forces will price in the additional savings in the supply chain into the farm-gate prices. A recent case with the grain export VAT nicely demonstrates this fact (see Figure 2). Until the beginning 2016, Ukrainian exporters of grains did not receive VAT refund on the grain they exported[8]. These were additional costs for the exporter so they simply rolled back this burden over the farmers’ shoulders in the form of lower farm-gate prices, which is reflected in the gap between the domestic and export prices for food wheat in the Figure 1. In 2016 the export VAT refund resumed and prices reacted accordingly by decreasing the gap between domestic and export prices, and producers reaped the benefits of reduced trade costs.
2. Additional investments and resulting additional export volumes. Some of the windfall discussed above would be used either to invest in, or to improve operations, in the export industries, and agricultural and mineral exporters confirmed that they would do so – i.e. they would expect to invest part of their windfall to expand their production. There is no basis on which to forecast their investments with precision, but around 15% of the money in circulation in the Ukrainian economy is saved and/or invested[9]. It will therefore be assumed that the exporters will be typically spending 15% of their additional revenue on investment. The returns on investment in Ukraine will of course vary. They are generally high in agribusiness, while in mining they can vary widely, depending on the constantly changing c.i.f prices. The assumption made here is that the average return to investment in the bulk exports would be around 25%. And assuming that export volumes and therefore revenue would rise in line with this rate of return, this would bring additional value of exports. Just to illustrate, an additional US$ for the economy as a result of lower port tariffs will result in additional US$0.0375 (=US$1*0.15*0.25) of exports.
3. Multiplier effect. The multiplier measures the additional incomes from the future rounds of spending that follow an initial cash injection into the economy – i.e. the knock-on effects of increased export revenues and additional domestic purchasing power.
Because “one person’s spending is another’s income”, the first set of incomes created by lower port charges will lead on to additional rounds of expenditures. For example, after some of the first set of incomes is spent on, say, sports coaches, the latter would in turn go on to spend some of their incomes in shops, hotels, and on general services. And so on. But they will not spend all their incomes in the following rounds, because there will be leakages – the three most important of which will be in
- tax,
- savings,
- imports.
If these leakages are in line with expenditure patterns shown in the Ukrainian national accounts they would total 68%[10], leaving 32% to continue circulating in further rounds. There is a large amount of literature on this subject[11]. It is not consistent, but the most frequently held view is that multipliers may typically be around 1.5, and this could be applicable in Ukraine as well. This multiplier will be applied to the benefits we described above.
4. Possible additional port traffic. Lower port tariffs might generate additional port traffic that might be attracted by lower c.i.f. prices. To reflect this option, we run two scenarios: ‘Base Scenario’ reflects the situation of NO additional port traffic and ‘High Case Scenario’ includes the effect of additional port traffic. For this scenario, we performed an econometric analysis of individual ports traffic data and port tariffs for 2006-2016. The exercise examined the roles of not only the tariff increase but also other traffic determinants such as GDP, household consumption expenditures in the country, world market prices and quality of infrastructure. The analysis was performed for liquids, dry bulks and general cargo aggregates; and for export, import and transit routes. The results were variable, but the most statistically significant were those for Ukraine’s most important cargoes – exports of dry bulks and transit of dry bulks. They indicated that if port tariffs were cut by 63%, the dry bulk exports would increase by about 5.6%, and the transit traffic would increase by 6.4%.
The quantifiable benefits for a range of a possible port tariff cuts is shown in the Table 4. One can note that although the tariff cut of $0.93 per tonne (under the 63% cut assumption) seems low, the total benefit of $166 million p.a. would be a significant injection of income into the economy of Ukraine, which is equivalent to 0.17% of GDP. If additional traffic in the High Case Scenario is accounted for, the benefit soars to $825 million p.a., or additional 0.88% of GDP.
Table 4 Quantifiable Economic Benefits ($ million p.a.) of reducing port tariffs
| Assumed reduction in port charges, % | 10 | 20 | 30 | 40 | 50 | 63 | 70 |
| Current average tariff, $/t | 1.47 | ||||||
| New average port charge, $/t | 1.32 | 1.18 | 1.03 | 0.88 | 0.73 | 0.54 | 0.44 |
| Higher export revenues as a result of lower port costs, $ mln | 14.7 | 29.4 | 44.2 | 58.9 | 73.6 | 92.7 | 103.0 |
| Increased exports financed by availability of additional funds for investment and improvement of product quality by exporters, $ mln | 0.6 | 1.1 | 1.7 | 2.2 | 2.8 | 3.5 | 3.9 |
| Higher disposable consumer income due to lower prices of imports, $ mln | 2.4 | 4.7 | 7.1 | 9.4 | 11.8 | 14.8 | 16.5 |
| Sub-total, $ mln | 17.6 | 35.2 | 52.9 | 70.5 | 88.1 | 111.0 | 123.4 |
| Multiplier | 1.5 | 1.5 | 1.5 | 1.5 | 1.5 | 1.5 | 1.5 |
| Total Income Injected into Economy: Base Case Scenario, $ mln | 26.4 | 52.9 | 79.3 | 105.7 | 132.2 | 166.5 | 185.0 |
| – as % of GDP | 0.03 | 0.06 | 0.09 | 0.11 | 0.14 | 0.18 | 0.20 |
| Additional (bulk) exports and transit, $ mln | 69.7 | 139.4 | 209.1 | 278.8 | 348.5 | 439.1 | 487.9 |
| Multiplier | 1.5 | 1.5 | 1.5 | 1.5 | 1.5 | 1.5 | 1.5 |
| Total Income Injected into Economy: High Case Scenario, $ mln | 131 | 262 | 393 | 524 | 655 | 825 | 917 |
| – as % of GDP | 0.14 | 0.28 | 0.42 | 0.56 | 0.70 | 0.88 | 0.98 |
Consequences for the State Budget
USPA generates revenues from port tariffs as well as from other charges/sources, but as Table 5 shows almost 70% of USPA’s total revenues of 7.3 billion UAH in 2016 consisted of port tariff revenues. The USPA surpluses are then taxed with an 18% corporate tax and a 75% tax on dividends. In 2017 USPA plans to pay UAH 4.4 bn (i.e. US$ 176 mn) of its surplus into the State Budget, making USPA one of the top taxpayers in Ukraine[12]. The losses to the State Budget will come from two sources: 1) reduced profit tax and dividends collected from the USPA port tariffs revenues, and 2) reduced dividends from the total USPA net profit.
The losses to the government due to port charges cut could be recovered in two main ways.
- Via taxes on new income injected into the economy. Although the initial beneficiaries of the money that would be diverted from the government budget to port users would be consumers, investors and firms, they would pay taxes on their incomes – mainly VAT, personal income tax, excise taxes and corporate income tax. These taxes, which amounted to US$776 bn in 2016, are equivalent to one third of GDP (which was 2,350 billion UAH). So in our case 33% of the additional income injected into economy as a result of port tariffs should be transferred back to the government as various taxes.
- Multiplier effect. Secondly, the multiplier of 1.5 should increase the incomes and taxes generated by the new money in the economy by 50%. If so, this would raise the percentage of the initial increase in port users’ incomes that would be paid back in taxes to about 50% (i.e 33%*1.5).
So under the Base Case Scenario (see Table 5), i.e. when additional export and transit traffic due to tariffs cut is not accounted for, one can expect the government will not be able to recover the fiscal losses due to port tariffs cuts, i.e. the shortfall ranges from US$0.95 mn to US$6.68 mln under the assumed port tariffs cuts. Dividends’ cut is expected to increase the shortfall further to US$23-44 mn, respectively (see Table 5). Putting this shortfall in perspective, however, the resulting fiscal gap is considerably lower than the economic benefits in relation to GDP. Under 20% tariffs cut scenario, economic benefits outweigh fiscal losses (as % of GDP) by a factor of two, and it increases to 4 under the 63% cut scenario. On the other hand it would require exports of bulks to increase by only 1-2% to compensate the Ministry of Finance for their losses under various port tariffs cut and dividends’ – a target that is not difficult to achieve for Ukraine’s economy.
Table 5 State Budget Losses and Incomes resulting from Port Charges and Dividends Cuts: Base Case Scenario
| Assumed reduction in port charges, % | 10 | 20 | 30 | 40 | 50 | 63 | 70 |
| Tax losses due to tariffs reduction, $ mln | 9.68 | 19.36 | 29.04 | 38.71 | 48.39 | 60.98 | 67.75 |
| Tax recovered, $ mln: | 8.72 | 17.45 | 26.17 | 34.89 | 43.62 | 54.96 | 61.07 |
| Shortfall, $ mln | -0.95 | -1.91 | -2.86 | -3.82 | -4.77 | -6.02 | -6.68 |
| Additional tax losses due to dividends’ cuts (from 75% to 50%), $ mln | 42.70 | 47.69 | 52.68 | 57.67 | 62.66 | 69.15 | 72.65 |
| Additional tax recovered, $ mln: | 21.14 | 23.61 | 26.08 | 28.55 | 31.02 | 34.23 | 35.96 |
| Shortfall Total, $ mln | -22.52 | -25.99 | -29.47 | -32.94 | -36.42 | -40.94 | -43.37 |
| Shorfall Total, % of bulk exports | 0.93% | 1.07% | 1.21% | 1.35% | 1.50% | 1.68% | 1.78% |
| Shorfall Total, % of GDP | 0.02% | 0.03% | 0.03% | 0.04% | 0.04% | 0.04% | 0.05% |
Furthermore, the shortfall is easily eliminated under the more optimistic or High Case Scenario, whereby Ukraine could sell more exports and increase transit. As it was discussed above, 33% of these additional exports and transit revenues would end up as the government’s tax gain. Table 6 demonstrates that these additional government tax gains are more than enough to offset the shortfall of the State Budget revenues in the Base Case and end up in a significant surplus.
Table 6 State Budget Losses and Incomes resulting from Port Charges and Dividends Cuts: High Scenario
| Assumed reduction in port charges, % | 10 | 20 | 30 | 40 | 50 | 63 | 70 |
| Tax losses, $ mln | 9.7 | 19.4 | 29.0 | 38.7 | 48.4 | 61.0 | 67.8 |
| Tax recovered, $ mln: | 43.2 | 86.5 | 129.7 | 172.9 | 216.1 | 272.3 | 302.6 |
| Surplus, $ mln | 33.5 | 67.1 | 100.6 | 134.2 | 167.7 | 211.4 | 234.8 |
| Additional tax losses due to dividends’ cuts (from 75% to 50%), $ mln | 42.7 | 47.7 | 52.7 | 57.7 | 62.7 | 69.2 | 72.6 |
| Additional Tax recovered, $ mln: | 21.1 | 23.6 | 26.1 | 28.5 | 31.0 | 34.2 | 36.0 |
| Surplus Total, $ mln | 12.0 | 43.0 | 74.0 | 105.1 | 136.1 | 176.4 | 198.2 |
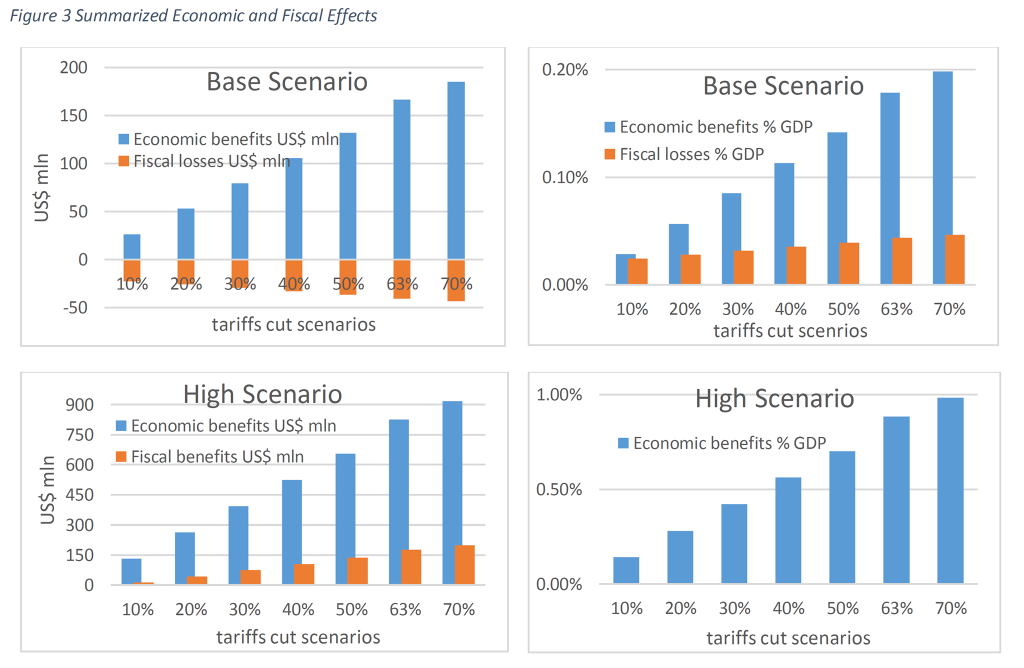
To summarize, we put together in a graphical manner all major pieces of information from tables above. Figure 3 summarizes that in the Base Scenario (i.e. when no additional port traffic is assumed), reduced port tariffs will generate some economic growth (up to 0.2% under 63% tariffs cut scenario), but it will not be enough to compensate the State Budget for expected fiscal losses due to the tariff cuts. In relation to GDP, however, economic benefits by far and increasingly outweigh fiscal losses. In the High Case Scenario, port tariff cuts can generate substantial economic growth (up to 1%) and fiscal gains.
Consistency with the empirical literature and countries’ experiences
In this section, we check the plausibility of the above economic and fiscal results with evidence from other countries.
The maritime literature and trade press show only a few cases of reductions in port dues, and no detailed examples of reductions were found for former soviet bloc countries, including Bulgaria, Romania, the Baltic States or Russia.
The best covered cases were found to be those of the reductions, or freezing, of tariffs in Europe during the worldwide recession following the financial crisis of 2008-9. Container traffic volumes in North West Europe had fallen sharply in 2009, and Rotterdam reacted by reducing its tariffs by 7%. It was the first reduction they had made in over 20 years. They were followed by the two other top ports, Antwerp and Hamburg, who froze their tariffs (previously they had increased them in line with inflation) for the next three years. The traffic volumes in the years that followed increased at all three ports in the years of the tariff freeze. However, it cannot be inferred that the traffic revival was primarily a result of the tariff concessions. The primary cause was undoubtedly the revival of GDP growth in all three countries – and indeed in the world.
An examination of another example leads to broadly similar conclusions. Ten years ago the World Bank had found that the Karachi Port Trust’s port dues in Pakistan were the most expensive in the region and persuaded the port to cut them by 15% in 2006 and another 20% in 2009. The traffic volumes indeed increased significantly after the cut, but the reality is that there were much greater influences on port traffic growth than tariffs. They include the high GDP growth, the China-led boom in world trade in the period from 2004 to 2007, and then the world recession that started in 2007.
The traffic volumes in the years that followed increased at all three ports in the years of the tariff freeze. However, it cannot be inferred that the traffic revival was primarily a result of the tariff concessions.
Although these cases are consistent with the principle that lower costs increase trade they do not prove it because of the other determinants involved.
Given the difficulties of establishing statistical connections between large items such as port traffic and minor determinants such as port dues, it is suggested that the general economic rule that ‘reductions in costs (whether transport costs, import export tariffs, or others) stimulate trade’ is best demonstrated via the ‘big’ numbers – i.e. the impact of trade tariffs on global trade and incomes. Table 4 demonstrates that the average port tariff in Ukraine was US$1.47/t in 2016, and it is the average for all types of exports. 60% of these exports, however, consisted of only two cargoes – cereals and iron ore, and both have higher port tariffs. Using the data from Laing and Nivievskyi (2017) one may estimate the average port tariff for cereals at about US$3/t, or about 2% of the current grain fob price. Average port tariff for iron ore is higher, i.e. about US$5/t or about 8% of the export price. This is comparable or even higher than the current Ukraine’s import and export duties. Export duties in Ukraine are zero for all the product lines, but sunflower oil (10%) and live animals (50%). The trade weighted import tariff in Ukraine is 2.5%: 5.4% – for agricultural products and 2.3% – for non-agricultural ones[13].
There is considerable literature on the effect of trade tariffs and costs on trade flows and country incomes. Although it is not very consistent, much of it draws the expected conclusion that WTO tariff reductions had a major impact on worldwide trade volumes[14], while others question the link (see Rose 2004). The WTO report “Trade and Tariffs: Trade Grows as Tariffs Decline”[15] , however, summarized the bottom line figures for the period 1993-2013, i.e. international trade almost quadrupled, with an average growth rate of 7.6%, while the average tariff applied by WTO members fell by 15%.
Despite a considerable fall of tariffs over the past decade, shipping costs have even risen slightly overall in ad valorem terms and the effect of this is stunning.
Despite a considerable fall of tariffs over the past decade, shipping costs have even risen slightly overall in ad valorem terms and the effect of this is stunning. Korinek and Sourdin (2009) analysed bilateral trade flows for 50 countries for 2003-2007 and found that at the aggregate level a doubling of bilateral maritime transport costs (USD/t) is associated with between 42% and 43% decline in the value of agricultural trade between two given countries, other things being equal. This finding is especially interesting if one considers the fact that worldwide maritime transport costs (i.e. ship charter rates) in the period 2003-2007 doubled because of increasing Chinese imports of raw materials, especially minerals which dominated the charter market in this period. That is to say, agricultural trade was ‘squeezed’ by the surge of imports of minerals to China that drove ship charter costs up. Another study (Radelet and Sachs, 1998) shows that high shipping costs reduce the rate of growth of both manufactured exports and GDP per capita. They suggest that doubling the shipping cost (e.g. from an 8% to 16% CIF) reduces GDP grows by about 0.5 p.p. – this is the result consistent with the Table 4, wherein port tariff reduction scenario bring about comparable results.
Empirical literature is also very vocal on the relationship between transport/trade costs and economic growth. A comprehensive review of BMW Group (2007) shows that declining trade costs imply high competition and increased industry productivity and increase in the incentives to innovate. This then translates into higher GDP growth rates. This is exactly the link observed in Ukraine after it started reducing its trade tariffs in 2001 in preparation to the WTO membership. Burakovskyi et al (2012) demonstrated that as average tariffs in manufacturing industry declined from 8.54% to 6.15% over 2001-2009, labor productivity increased by 92% and total factor productivity increased by 26%.
Conclusions
Ukraine’s port tariffs are 2 to 3 times above those at comparable ports in the region and competing export ports, and there is a substantial scope for their reduction (see Laing and Nivievskyi, 2017). High port tariffs essentially tax Ukraine’s economy and leave the country overall poorer. On the other hand, port tariffs are an important source of revenues for the Government of Ukraine, as 75% of net profits generated by the Ukrainian Sea Port Authority (USPA) port charges are transferred to the State Budget in the form of dividends, along with the profit tax. In this paper we analyse and quantify economic and fiscal impacts of the proposed reductions in dividends for a range of feasible port tariffs cuts (from 10% to 70%) to the Ukrainian economy.
Ukraine’s port tariffs are 2 to 3 times above those at comparable ports in the region and competing export ports, and there is a substantial scope for their reduction.
In the paper we introduce Base and High scenarios. In the Base scenario we account only for a windfall that the private sector receives from port tariff reductions that could be then used for additional investments with a resulting additional output, and a 1.5 multiplier effect. In the High scenario, additionally to the Base Scenario, we also assume that port tariffs cuts will generate additional export and transit cargo flows. The resulting figures show that relatively small tariff cuts in absolute terms (e.g. $0.93/t under the 63% cut assumption) might generate significant total benefits to the economy (e.g. $825 million p.a., or additional 0.88% of GDP in the High Scenario case). The magnitude of the effect is generally speaking consistent with what is available in the empirical literature.
This additional benefit to the economy might not generate enough tax revenues for the Government to compensate for the expected fiscal losses due to the tariff cuts in the Base Scenario. The resulting fiscal gap, however, is considerably lower than the economic benefits as a percentage of GDP. Under 20% tariffs cut, economic benefits outweigh fiscal losses (as % of GDP) by a factor of two, and it increases to 4 under the 63% cut scenario. On the other hand, fiscal gap could easily be covered with 1-2% increase in bulk exports. Under the High Scenario the additional benefits to the economy will generate far more fiscal revenues to the Government than losses and almost 1% GDP growth in case of 63% tariffs cut scenario.
Literatures
- Korinek, J. and P. Sourdin (2009), “Clarifying Trade Costs: Maritime Transport and its Effect on Agricultural Trade”, OECD Trade Policy Papers, No. 92, OECD Publishing, Paris. http://dx.doi.org/10.1787/220157847513
- Steven Radelet, Jeffrey D. Sachs, 1998, Shipping Costs, Manufactured Exports, and Economic Growth, Columbia University Academic Commons, https://doi.org/10.7916/D8J39081.
- BMW Group (2007). Transport, Trade and Economic Growth — Coupled or Decoupled?: An Inquiry into Relationships between Transport, Trade and Economic Growth and into User Preferences concerning Growth-oriented Transport Policy Institute fuer Mobilitaetsforschung
- Igor Burakovsky, Veronika Movchan, Konstantin Kravchuk et al. (2012): “Membership of Ukraine in the WTO: Institutional and Economic Effects” Institute for Economic Research and Policy Consulting
- Laing, T. and O. Nivievskyi (2017): What is Wrong with Port Tariffs in Ukraine and How to Make them Competitive. https://voxukraine.org//2017/09/01/what-is-wrong-with-port-tariffs-in-ukraine-and-how-to-make-them-competitive/
- Rose, A. K. 2004. Do We Really Know That the WTO Increases Trade? American Economic Review 94 (1):98-114, https://issuu.com/wtopublications/docs/wto_20_brochure_tariffs_e
- World Bank Port Reform Toolkit, 2nd Edition: http://ppp.worldbank.org/public-private-partnership/library/port-reform-toolkit-ppiaf-world-bank-2nd-edition
- De, P. (2007): Impact of trade costs on trade: Empirical evidence from Asian countries, pp. 281-307, Chapter IX in ESCAP, Trade facilitation beyond the multilateral trade negotiations: Regional practices, customs valuation and other emerging issues – A study by the Asia-Pacific Research and Training Network on Trade, (United Nations, New York).
Notes
[1] The port tariffs covered in this paper are those charged on vessels entering Ukrainian ports. They include tonnage dues, light dues, berth dues, canal dues, anchorage dues, administration dues and sanitary dues – but not cargo or container handling charges.
[2] See Laing and Nivieskyi (2017)
[3] http://www.kmu.gov.ua/control/uk/publish/article?art_id=250247180&cat_id=244276429
[4] The exceptions are light dues which are paid to the State Enterprise Derzhhidrografia and administration dues which are paid to the State Budget of Ukraine.
[5] See Laing and Nivieskyi (2017)
[6] The port traffic was dominated by exports which accounted for 76% of the total, with imports accounting for 12% and transit traffic for only 8% in 2016.
[7] See http://agravery.com/uk/posts/show/top-10-kompanij-eksporteriv-zernovih-z-ukraini
[8] This is a standard practice when exporters receive back VAT they paid on their inputs (grain from farmers in this cases) to avoid a double taxation with import VAT in the importing country.
[9] According to the national accounts, 52% of the national income is spend on consumers expenditures, 33% on various taxes, and 15% on savings/investments
[10] 15% of the national income is spend on savings at each round of consumption expenditures, 33% is on taxes and 20% is on imports
[11] E.g. https://www.tutor2u.net/economics/reference/multiplier-effect, http://xplaind.com/544502/tax-multiplier; http://econlog.econlib.org/archives/2013/01/when_is_a_spend.html
[12] USPA placed 14th in the top 100 taxpayers in Ukraine in the 1st half of 2017 (Digest of the State Fiscal Service of Ukraine, is 3-4/2017)
[13] http://stat.wto.org/TariffProfiles/UA_e.htm
[14] E.g. The Old and the New: The Effects of the WTO on International Trade, by Soo Yeon Kim, Niehaus Center for Globalization and Governance, Woodrow Wilson School of Public and International Affairs
[15] https://issuu.com/wtopublications/docs/wto_20_brochure_tariffs_e; De (2007) paper on the „Impact of Trade Costs on Trade: Empirical Evidence from Asian Countries” shows, inter alia, that a reduction in tariffs and transport costs by 10 percent would increase bilateral trade by at least 2 percent .
Main photo: depositphotos.com/ Nightman 1965


Attention
The authors do not work for, consult to, own shares in or receive funding from any company or organization that would benefit from this article, and have no relevant affiliations