Discussions around agricultural tax exemptions have been in the focus of a hot political fight between the Ministry of Finance and agrarian lobby for more than a year. More than UAH 20 bn of forgone budget revenues is at stake. On the New Year eve, some compromise was reached, whereby agricultural lobby and the sector lost a great deal of its tax benefits. Agricultural lobby, however, does not give up and prepares for a revenge.
Despite high stakes, however, this fight has not been underpinned by empirical evidence, but just opinions. In this paper I demonstrate some of the empirical evidence showing no impact of tax benefits on agricultural sector productivity growth.
State agricultural support in Ukraine
State agricultural budget support in Ukraine is characterised by modest levels of public expenditures and quite generous tax benefits (see Figure 1).
Figure 1. Agricultural State Support in Ukraine (nominal), mln UAH

Source: own presentation based on the OECD PSE data for Ukraine
Budget subsidies to farmers (‘Subsidies’ category in the Figure 1) are mainly sub-sectors specific (field crops, pigs, cattle), primarily through payments based on area or animal numbers, payments based on commodity output, a large concessional credit programme. This category of public subsidies combines outlays related to production, output and inputs (very thin since 2013). ‘General services outlays’ category includes financing such public services as infrastructure, education, research and development, sanitary and phytosanitary control, food security measures, agricultural insurance etc. Tax benefits made up about 90% in total budget transfers to farmers in 2011-14 (see Figure 1).
Tax benefits accrue from two sources: a Single tax (called Fixed Agricultural Tax before 2015 – FAT) and a special value-added tax regime in agriculture (AgVAT). The FAT is a flat rate tax that replaces a number of taxes and duties, including profit and land taxes. Its rate varies from 0.09% to 1.00% of the normative value of farmland, depending on farmland’s type and location. In 2010, the FAT resulted in an average tax payment of only roughly 6 UAH/ha (0.75 US$/ha) of arable land that basically left farm profits in Ukraine essentially untaxed. In 2015, due significant increase of the normative value of land, FAT liabilities increased to roughly 200 UAH/ha (or roughly $US9/ha), which is also very low compared to what the farmers would pay on the general tax system. In 2014 (according to OECD PSE estimates, see http://www.oecd.org/agriculture/agricultural-policies/producerandconsumersupportestimatesdatabase.htm), the benefits from the FAT accrued to UAH 3.8 bn.
According to the AgVAT regime, farmers are entitled to retain the VAT received from their sales to recover VAT on inputs and for other production purposes at the discretion of farmers. In 2014, the benefits from the AgVAT accrued to UAH 14 bn. From 2016 the AgVAT system was changed and a great deal of tax benefits for agriculture are now gone. Now the question is how this system of agricultural tax benefits (that has been in place since 1999) affected agricultural sector until today.
Agricultural Productivity
From the government perspective, improving agricultural productivity has always been a goal of the state agricultural policy. So let us focus on how agricultural tax benefits are associated with the agricultural productivity growth in Ukraine.
Productivity can be measured in different ways. There are partial productivity (output per unit of a specific input) or total productivity (output per unit of aggregated input) measures. For example, yields (tons per hectare, milk per cow) are commonly used as partial indicators of productivity. Partial measures of productivity, however, can be misleading because they only consider one input in isolation, while farms use a variety of inputs to produce more than one output simultaneously. The ‘Total Factor Productivity’ (TFP) is considered as the most informative measure of agricultural productivity because it measures the relationship between a farm’s aggregate input use and its aggregate output. TFP takes into account all of the land, labor, capital, and material resources employed in farm production and compares them with the total amount of crop and livestock output. If aggregated output is growing faster than aggregated inputs, one observes an improvement in total factor productivity (“factor” = input), or TFP growth. TFP growth encompasses the changes in the efficiency (e.g. better management practices), in technologies (better agricultural machines, seeds’ varieties, etc) and in the scale of operation.
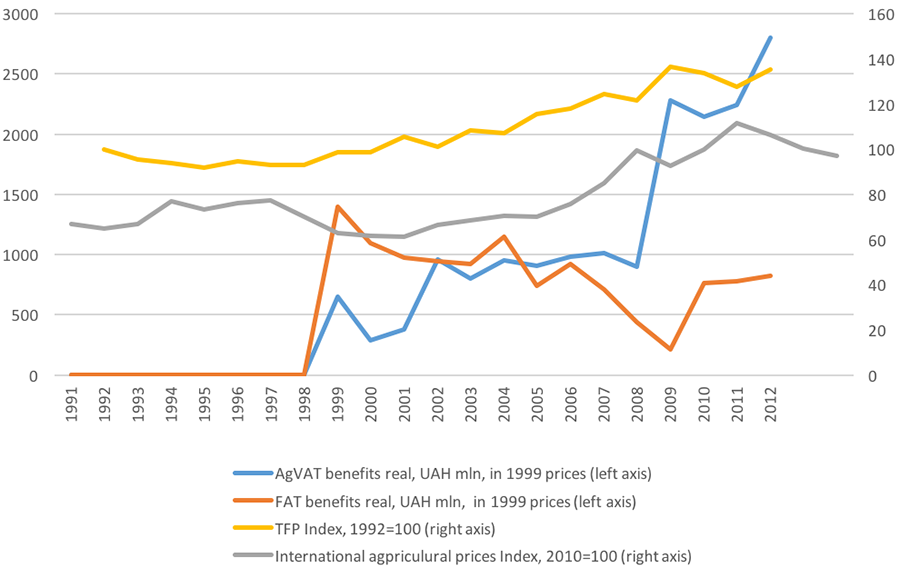
Luckily for the purpose of this analysis, the Economic Research Service at the US Department of Agriculture (ERS USDA, http://www.ers.usda.gov/data-products/international-agricultural-productivity.aspx) produces internationally comparable and consistent TFP growth rates (not TFP levels) using so-called “growth accounting” method. Most of the data on production and input quantities comes from FAOSTAT database of the United Nations Food and Agriculture Organization (FAO). In some cases FAO input and output data are supplemented with data from national statistical sources. Figure 2 shows how Ukraine’s agricultural TFP improved since independence. Since 1992 till 2012, for example, the TFP cumulatively increased by 35.3%. Real benefits from the AgVAT and FAT (using OECD PSE data for Ukraine and deflated by 1999 consumer price index) are also demonstrated on the same plot. From the visual inspection of the Figure 2, however, it is difficult to conclude about the association between the TFP growth and tax benefits, moreover we cannot get it in a measurable way. So the next step is to measure this association statistically.
Figure 2. Agricultural Total Factor Productivity (TFP) growth index, international agricultural real prices, and real tax benefits in Ukraine
Statistical analysis of agricultural TFP growth and tax benefits
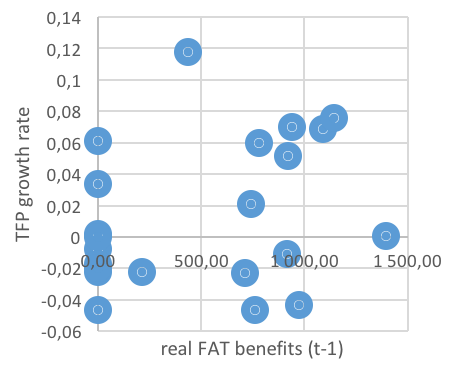
To start with I first consider the mechanism of how tax benefits might affect TFP growth rates. From the section describing the tax benefits one may conclude that tax benefits generate extra profits for farmers to finance next period working capital (purchase of seeds, agrichemicals, fuel, feed etc). Also various professional literature sources in the field confirm this. So, for example, if a farmer used this year tax benefits to purchase more productive seeds varieties to plant in the next season, this might bring an improvement in TFP. In statistical language in the following we look at how one period lagged tax benefits affected TFP growth rate, or how tax benefits in time (t-1) affected TFP growth in time t. Figure 3 and Figure 4 show the scatter plots of TFP growth rates versus the one period lagged real VAT and FAT benefits. Visual inspection of these two graphs does not allow inferring any clear patterns of the impact of tax benefits on TFP growth rates.
In fact a linear statistical model that I used also does not detect the pattern. I also tried various non-linear patterns of how tax benefits could affect TFP growth rates, but with the same result. Also the model cannot confirm that the introduction of tax benefits in 1999 changed the distribution of TFP growth rates. In other words, I do not find the empirical evidence that the introduction of tax benefits in 1999 affected agricultural productivity growth in Ukraine. All the data and model specifications/results are easily available upon the request.
Figure 3. TFP growth rate versus lagged real VAT benefits
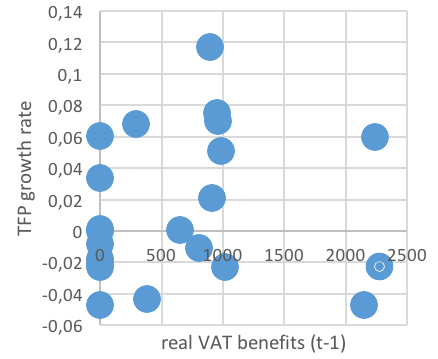
Figure 4. TFP growth rate versus lagged FAT benefits
Some open questions
When thinking about the above results one should remember following issues, however:
- the analysis was performed on the aggregate sector level data. If individual farm-level data is employed over a significant period of time, the analysis might produce some different results
- the analysis was performed just on 20 observations, so longer time periods would be generally speaking desired to get more statistically robust estimates
- as the famous statistician George Box once said, ‘all models are wrong’, including the ones mentioned in this paper. So if someone comes up with a better specification, more rich data set, more disaggregated model, I would be happy to discuss the results.

Attention
The author doesn`t work for, consult to, own shares in or receive funding from any company or organization that would benefit from this article, and have no relevant affiliations