While the experts’ forecast is the most accurate among private-sector expectations in Ukraine, all surveyed groups have expectations consistently overshooting or undershooting future realized inflation. However, the bias has decreased over time. Moreover, inflation expectations became less dependent on exchange rate expectations. This suggests that the NBU communications are effective as an implementation tool of inflation targeting.
Today Central Banks communication is an essential tool of monetary policy
Until the 1990s, Central Banks were saying as little as possible aiming to surprise the markets with monetary policy decisions. For example, before February 1994, the Federal Open Market Committee did not disclose information on the key interest rate. Today decisions on monetary policy are communicated far ahead. To achieve stability, a central bank (CB) has to make sure that the public is aware of the monetary policy strategy (Weidmann 2018). In this context, information transmission becomes essential.
Independence obliges CB to be accountable to the public, and communication ensures its transparency which is a prerequisite for accountability. CB communicates to explain its monetary policy and build public confidence in its commitment and ability to ensure price stability. Also, communication serves as a monetary policy instrument that guides expectations.
Inflation expectations influence all prices in the economy, including wages. Investment and saving decisions are also affected by inflation expectations. Moreover, inflation expectations can be self-fulfilling – that is, if firms expect high inflation, they will raise prices, and workers will demand higher wages thus generating high inflation. Therefore, it is crucial to anchor agents’ expectations.
Has the NBU been successful in anchoring inflation expectations?
The National Bank of Ukraine adopted inflation targeting in 2016, and inflation gradually decreased from over 40 percent in 2016 to 4.1% in 2019. How has this changed inflation expectations of Ukrainians? We look at four types of economic agents for which expectations have been measured – households, banks, firms and professional forecasters.
Data
To assess inflation expectations, NBU has been running surveys of firms, banks, households and experts since 2006, 2011, 2011 and 2014 respectively.
The survey of firms includes about 700 non-financial sector enterprises selected by the quota principle. The sample of banks represents at least 90% of the banking system’s assets and consists of banks that are not insolvent and are not in the process of liquidation. Firms and banks are surveyed quarterly. The household survey is run monthly by the GfK Ukraine. The sample includes 1000 households selected by quotas.
The survey of experts is conducted by the NBU. In July 2014-September 2019 it was run monthly, and since November 2019 – six times a year. Professional forecasters provide point estimates of their expected inflation, and expert forecast is a simple average of these estimates. Banks, firms, and households are provided with the current level of inflation computed by the State Statistics Service of Ukraine. Then they choose an interval of expected inflation for the next 12 months. The resulting estimate is the weighted average of middle points of those intervals.
Inflation expectations of the four surveyed groups and realized inflation 12 months ahead are plotted in Figure 1. A spike in the CPI in 2014-2015 is caused by several factors. The military conflict in the Donbas region and Russia’s illegal annexation of Crimea in 2014 caused an economic crisis (a loss of a large share of GDP and export revenues). Panic in the foreign exchange market in the first quarter of 2015 put an additional upward pressure on inflation. Another factor was a sharp increase in household utility tariffs since April 2015 which was a necessary precondition for energy market reform. These were external shocks that could not be anticipated. Therefore, I exclude the period before March 2016 from the analysis of forecast accuracy.
Figure 1. Inflation expectations and realized inflation in 12 months, %
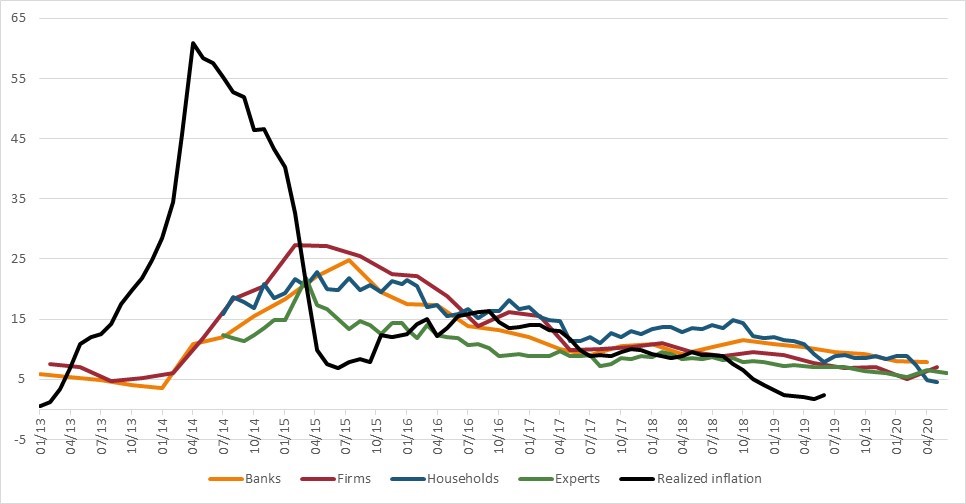
Source: NBU data
How do people and firms form expectations?
We use a hybrid model of expectations formation (Łyziak 2014). We assume that expectations are formed based on previous experience (backward-looking factors) and the best guess about the future (forward-looking factors). Why does the central bank care about the way expectations are formed? The more forward-looking expectations are, the easier it is for the central bank to achieve its inflation target simply by providing economic agents with information about it.
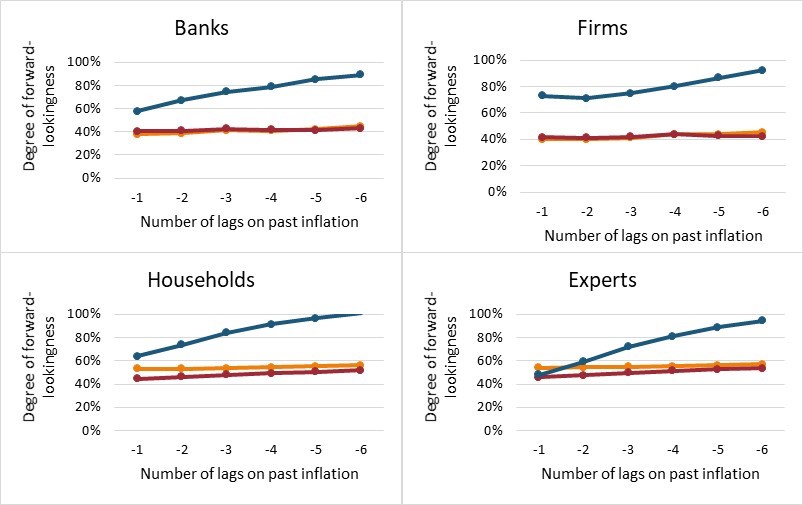
To estimate the role of each of these factors in forming expectations, I regress the expected inflation level on the realized inflation in 12 months and lagged inflation. Figure 2 reports the weight of forward-looking factors in expectations for specification from 1 to 6-months lag for the whole period and 2 subperiods (January 2013- March 2016 and April 2016 – June 2019). The NBU de-facto started inflation targeting in early 2016, and since then expectations became more forward-looking for all surveyed groups. This is partly explained by the fact that the economy came out of the crisis when high inflation until March 2016 fueled inflation expectations. However, it is also a sign of anchored expectations, as the forecast depends less on the current situation.
Figure 2. Forward-lookingness of inflation expectations
![]()
Note: Each figure plots the estimated coefficient on future inflation level in the regression of inflation expectations on lagged inflation (only one lag is included, and the number of this lag is indicated along the X axis) and future realized inflation.
Source: own calculations
How are inflation expectations related to exchange rate?
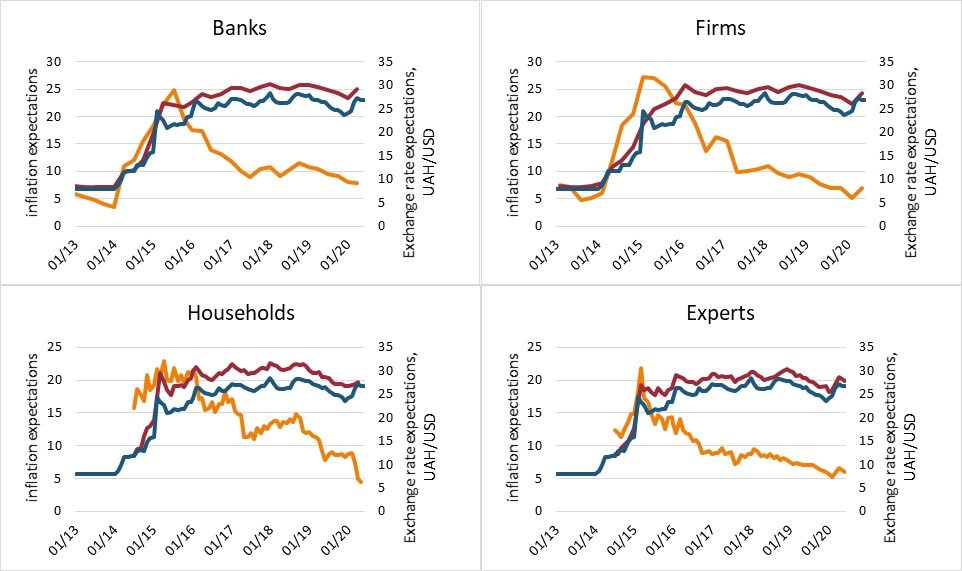
Gorodnichenko and Coibion (2015) report a strong connection between inflation and exchange rate expectations for consumers, firms, and professional forecasters in Ukraine. Figure 3 displays the expectations of four surveyed groups on inflation (right axis) and exchange rate (left axis). Indeed, for the period until the first quarter of 2015, the correlation between expected inflation and expected exchange rate is 0.95 for banks, 0.98 for firms and financial analysts, and 0.75 for households.
However, since then the dynamic of two series of expectations has changed significantly. Despite the existence of the exchange rate pass-through effect (Faryna, 2016), after the first quarter of 2015 expectations of inflation and exchange rate do not move in the same direction. The correlation coefficient is -0.77 for banks, -0.36 for firms, -0.03 for households, and -0.49 for professional forecasters. One of the possible explanations is an understanding of market participants that the exchange rate does not fully represent the state of the economy. In Ukraine, the exchange rate is floating, and foreign exchange interventions are an auxiliary instrument of the NBU used to accumulate international reserves, smooth excessive exchange rate fluctuations, and support the transmission mechanism of the key policy rate.
Figure 3. Inflation expectations, %, and exchange rate expectations, UAH/USD
![]()
Source: NBU data
How good are firms, banks and people at telling the future?
One of the indicators of forecast accuracy is the bias of the forecast. It is calculated as an average forecast error where the error is the difference between expected and realized inflation in 12 months. Therefore, even imprecise forecasts can have a low bias if positive errors offset negative. This issue is addressed by other measures of forecast accuracy (Table 1).
Table 1. Measures of forecast accuracy
| Measure | Calculation | Advantages | Drawbacks |
| Bias | Average of errors | The most intuitive | Positive and negative errors average out |
| Mean Absolute Error (MAE) | Average of absolute errors | Robust to outliers | Greater errors are not penalized |
| Mean Absolute Percentage Error (MAPE) | Sum of the absolute errors, each divided by the realized value | High errors for low realized levels of inflation have a higher weight | Undefined if one of the realized values is zero |
| Root Mean Squared Error (RMSE) | Square root of the average squared error | Correct on average (unbiased) | Sensitive to outliers |
Calculated measures of forecast accuracy are presented in the radar chart below. The closer a measure is to zero, the more accurate is forecast in that dimension. The forecast of financial analysts is the most precise across different measures, while three other groups, and in particular households, tend to overestimate future inflation. Inflation expectations of firms display a lower magnitude of errors compared to banks and are close to those of financial experts.
Figure 4. Forecast accuracy for the period of March 2016 – June 2019
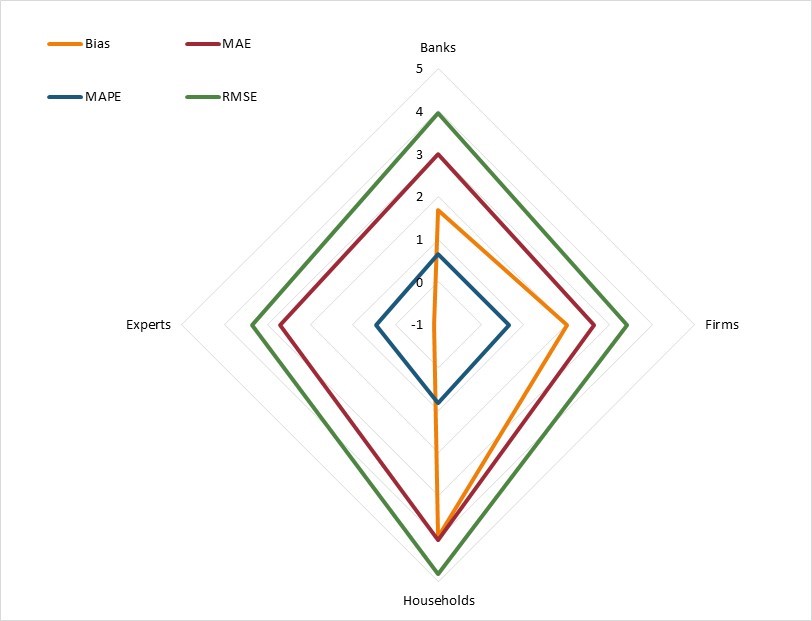
Note: the period before March 2016 was excluded from the analysis of forecast accuracy due to external shocks in 2014-2015 that both resulted in high inflation and could not be predicted.
Source: own calculations
Are the expectations rational?
Expectations of a particular variable are rational if they take into account all the existing information (formally speaking, if they are identical to the mathematical expectation of this variable). How to formally test this? If there is no bias, the slope coefficient in the regression of expected inflation on the realized inflation is equal to one and intercept – to zero, which is tested using F-statistics (Friedman, 1980). The test results are presented in Table 2. For every group, a constant term is significant, indicating systematic errors. On average, expectations are not equal to realized inflation concerning which they are formed. However, a decrease in F-statistics indicates that expectations become less biased.
Table 2. F-statistic for hypothesis of unbiasedness
| F Statistic | Banks | Businesses | Households | Financial analysts |
| Whole period | 109.76*** | 51.32**** | 393.37**** | 523.47*** |
| Before 2016 | 101.31** | 53.39** | 2302.2*** | 1650.3*** |
| After 2016 | 2.36 | 0.59 | 231.63** | 65.46** |
Note: Control variable and its interaction with a realized inflation are added for subperiod after March 2016. Because of quarterly frequency for firms and banks, I perform F-test for the whole period as well.
Conclusion
We investigated the inflation expectations of households, businesses, banks and professional forecasters between January 2013 and June 2019. In the middle of this period (early 2016) inflation targeting regime was de-facto introduced. After the introduction, inflation expectations of all the groups became closer to the future inflation. This implies that the NBU’s forward guidance works.
As expected, financial analysts are the most accurate in predicting future price movements, while business slightly outperforms banks’ forecasters in the period after March 2016. Prior to that forecast mistakes of all the groups were very high because in the 2014-2015 the economy was hit by external shocks.
After the first quarter of 2015, there is no clear relationship between expectations on inflation and exchange rate while before that there was a strong positive correlation between the two. This again suggests that communication of the central bank about inflation targeting was quite effective.
References
Friedman, B. 1980. “Survey Evidence on the Rationality of Interest Rate Expectations.” Journal of Monetary Economics 6: 453-465.
Gorodnichenko, Y., and O. Coibion, O. 2015. Inflation Expectations in Ukraine: A Long Path to Anchoring? Visnyk of the National Bank of Ukraine 223.
Łyziak, T. 2014. “Inflation expectations in Poland, 2001–2013. Measurement and macroeconomic testing”. NBP Working Papers 178.
Weidmann, J. “Central bank communication as an instrument of monetary policy” Lecture, Centre for European Economic Research, Mannheim, May 2, 2018.

Attention
The author doesn`t work for, consult to, own shares in or receive funding from any company or organization that would benefit from this article, and have no relevant affiliations