Action novel in 3 parts with prologue and epilogue
Part 1
Part 2: The Dangerous Present
Over the last ten years, the growth of the consumer price index (CPI) was quite high – over 11.3% per year. As we already noted in Part 1, this was the result of soft fiscal and monetary policies. This year the average annual CPI is likely to reach its highest levels since the year 2000, climbing to nearly 50%. At the same time, the current agreement with the IMF calls for cutting the budget deficit and notably limiting the money supply – measures which clearly have an anti-inflationary impact.
Currently, the list of goods and services that are used for CPI calculation has 335 items. Price information on those goods is collected monthly by the State Statistics Service of Ukraine (SSSU) in all regions of the country. However, the majority of people do not follow official numbers and instead pay attention to sharp upsurge in prices on selected products (usually by 20-100%), which they then extrapolate to the whole economy. This could happen even when the weight of the item in household spending is small (e.g. Subway tokens). This creates a concerning trend in which many Ukrainians have lost faith in the official inflation figure.
There may be a grain of truth in assumption that ‘true’ inflation is higher than officially reported figures. In 1991, Ukraine adopted a law on (partial) indexation of personal income, i.e. wages, pensions, other regular income should be increased if price level increased. It states that the latter should be indexed (by a fraction, the higher is regular income figure the less it bise indexed) in the case of a price level increase of 1% or more since the last change of income. There was an important amendment earlier this year that states that the indexation is made only within limits of resources of public budgets. Nevertheless, it can be expected that the government is interested in lowering inflation figures because they allow for no or minimal indexation, which over time would lead to massive accumulated unreported inflation, notably affecting other data about the economy. The SSSU is financed by the state and it can be in theory pressed by the government to manipulate figures, although there is no hard evidence that such pressure has ever been exercised.
In order to check whether official inflation figures are in line with reality, one should find other sources of data as comprehensive as the SSSU’s. A number of alternatives exist. First, Tom Coupe from the Kyiv School of Economics compared data on food prices in major Ukrainian supermarkets. [1] His findings showed that while monthly price changes may slightly differ, cumulative growth for several months is in line with official figures. The difference is likely to be caused by sample composition and schedule of data collection used by the SSSU. For instance, price data for 13 goods are collected daily up to the last day of the month, while the remaining prices are checked during the last ten days of each month.
The second approach is to use a SSSU calculated price index which does not affect public spending. The first candidate with these properties is the producer price index (PPI) that accounts for changes in prices of intermediary goods. If we take its cumulative growth over a significantly long period (e.g. 10 or 20 years), its overall dynamics should be in line with the CPI, because produced goods should be consumed. If we take cumulative data from 1997 (in September 1996 hryvnia was introduced, and 1997 can be seen as a year of relative stability) to the end of 2014 then we observe that the CPI increased 5.7 times while the PPI increased 8.7 times. If we restrict our sample to include data starting from 2000, when Ukraine enjoyed economic growth with a relatively stable UAH/USD exchange rate, the CPI increased 3.6 times, the PPI increased 5.3 times (see Figure 1). However, Figure 1 also shows that between 1997 and 2003 the cumulative growth of both indices was quite similar. In 2003 the trends diverged following an uptick in world commodity prices. Commodity prices affect PPI because the index includes a large share of ferrous metals (19.2% of the total PPI plus 6.1% for iron ore) and other predominantly export commodities.
Figure 1
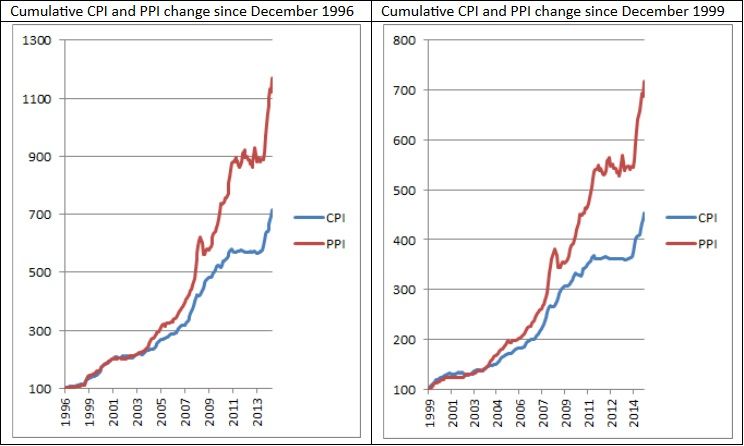
Source: the State Statistics Service of Ukraine, author’s calculations
If one takes an industry in the PPI that produces goods from the CPI list then the dynamics are similar (see Figure 2 for sugar). Another difference between the two indices is that the PPI gives ex-works net prices without accounting for VAT or excise taxes, as well as transportation costs and retail markup.
Figure 2
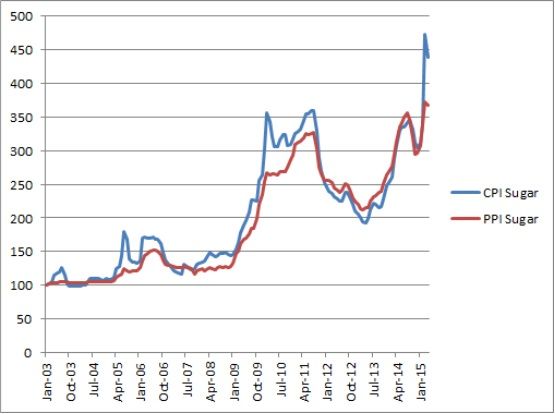
Source: the State Statistics Service of Ukraine, author’s calculations
The third broadly used alternative entails employing data from the system of national accounts (SNA), namely gross domestic product (GDP) deflator or more narrowly the final consumption expenditure of households deflator. Ukraine adopted SNA (its 1993 revision) in 2001, and one can compare quarterly figures from the year 2002 with the corresponding CPI figures (see Figure 3).
Figure 3

Source: the State Statistics Service of Ukraine, author’s calculations
In terms of annual growth rate, both indexes follow each other closely. While the the positive and negative trends of the two indexes are similar, during inflationary peaks there is a divergence: the consumption deflator exceeded annual CPI in 2005 but was lower in 2008, thus there are important temporary variations during this period. As of 2014 the cumulative growth of deflator, covering the period between 2002-2014, was 11% higher than the cumulative CPI growth. These differences are caused by the following::
- The consumption deflator and CPI use different weighting structures for their respective basket of goods
- Broader range of data used to calculate the consumption deflator
The weights of goods in services in the CPI are held constant so that inflation data can be compared from period to period. The weighting of the CPI was revised four times between 1991 and 2006 and slight revisions have been made annually since 2007. Moreover, the CPI is composed of a ‘poor man’s basket of goods.’ This basket of a goods is a holdover from the 1990s, when the CPI was heavily weighted towards foodstuffs. At the time, foodstuff accounted for roughly half of the bundle, while transport (includes prices of cars and fuel) was just a few percentage points (the comparison of weights is in Table 1). Furthermore, the CPI may be calculated for one specific commodity or service e.g., a particular package of tea with specific weight, sort, while consumption deflator uses additional retail sales data, which encompasses a broader group (e.g. all teas sold during the period).
Table 1. weights of structure of CPI and private consumption for selected years
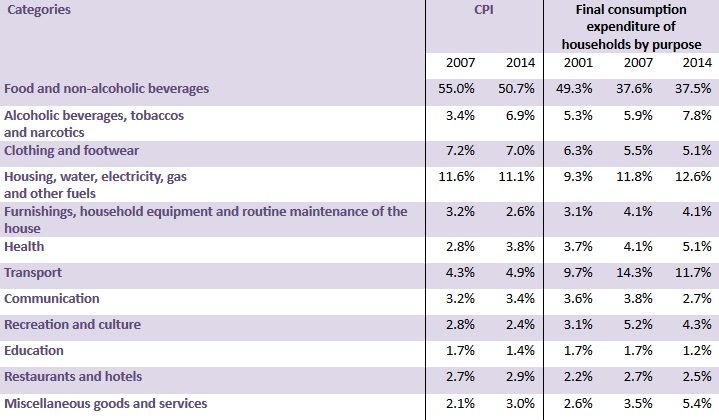
Source: the State Statistics Service of Ukraine, author’s calculations
The final option for an alternative inflation measure is the use of the exchange rate. This is clearly inadequate in the short run as shown elsewhere, but can be used for the longer periods when the pass-through is complete. This is based on the purchasing power parity (PPP) theory, which is not a good fit for Ukraine because the consumption basket changed notably and because Ukrainians often use hard currency (predominantly US dollar) for savings. As a result of using the dollar as an inflation protected asset, the demand for the currency typically falls during periods of low inflation. This relationship is not considered in the PPP theory. Bearing this in mind, one can see (Figure 4) that since the introduction of the hryvnia there has been continuous price growth, and periods of roughly stable UAH/USD exchange rate interlaced with periods of sharp devaluation. There have also been periods when cumulative devaluation exceeded the cumulative inflation and vice versa.
Figure 4. Index of UAH/USD exchange rate and CPI, august 1996 = 1.00
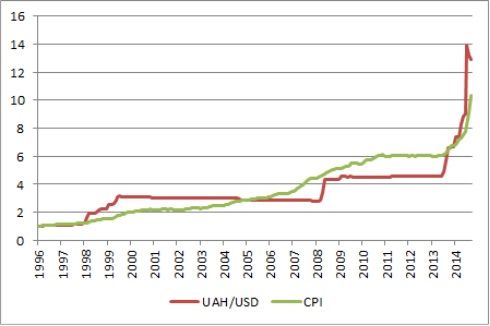
Source: the State Statistics Service of Ukraine, the National Bank of Ukraine, author’s calculations
To summarize, the four alternative methods for measuring consumer inflation in Ukraine yield similar results to the official CPI measure if we look over long periods of time. Even if the official figures were manipulated in order to show lower levels of inflation, the magnitude of such “adjustments” would be low.
While I found no evidence that supports hypothesis that CPI change was systematically underreporting inflation, there are some issues regarding representativeness of the index, which can be improved. The following actions can improve the situation:
- The law on indexing incomes should be cancelled. It stimulates price-wage spirals and makes effective anti-inflationary policy harder to implement;
- The weights of the CPI should be adjusted to reflect a modern spending habits. The SSSU should revise historical CPI data to reflect the current weighting structure for the basket of goods. This will allow for a meaningful comparison of historical inflation figures;
- Detailed data on all goods and services used for the CPI calculation should be available online, so that anyone can calculate his/her personal inflation and check whether prices in the database are in line with what he/she sees in retail stores and markets. This should improve the trust in official figures.

Attention
The author doesn`t work for, consult to, own shares in or receive funding from any company or organization that would benefit from this article, and have no relevant affiliations