Happiness and wellbeing are the new GDP. Lately, more and more politicians offer to include them into the assessment of how successful the country is. Ex-prime minister of the UK David Cameron said: “It’s time we admitted that there’s more to life than money and it’s time we focused not just on GDP but on GWB – general wellbeing.”
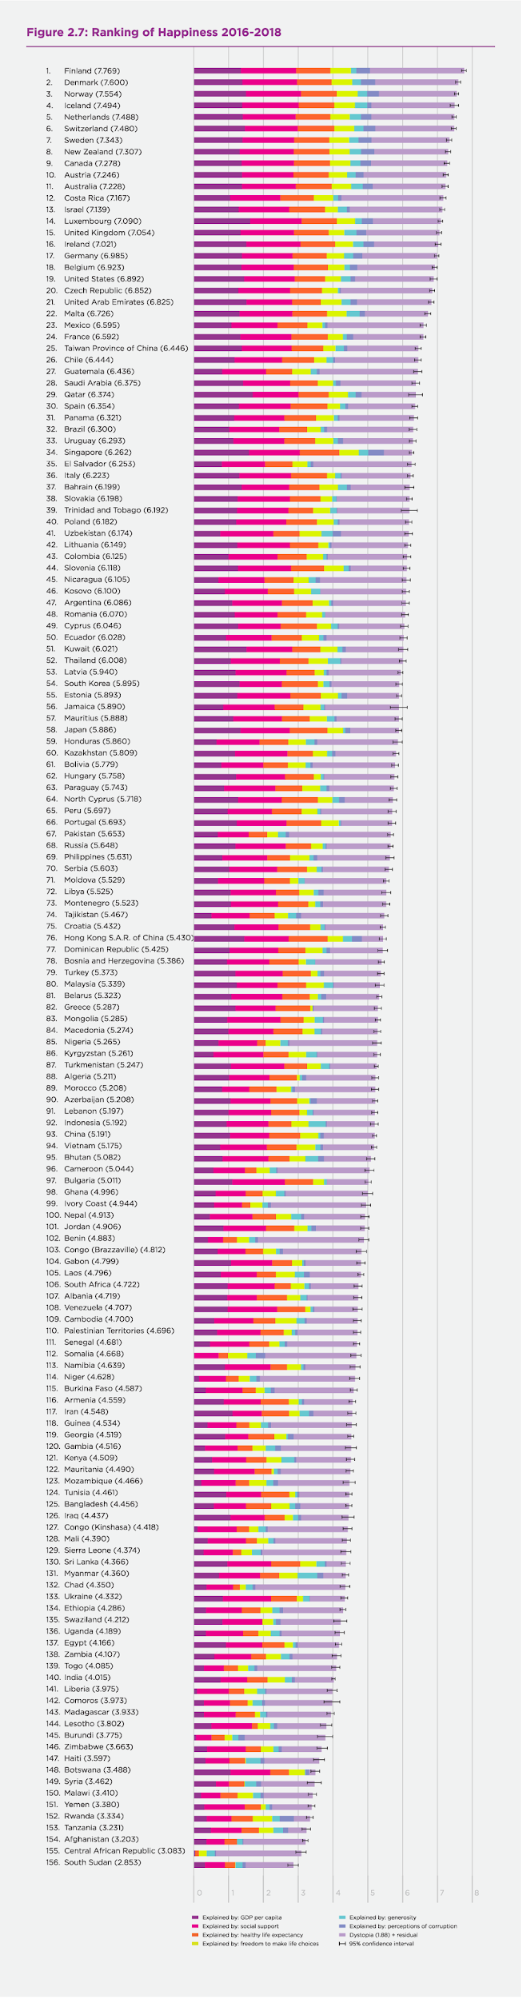
Ukraine keeps up with the pace, too. During the YES conference dedicated to the topic of happiness that took place in September, minister of development of economy, trade and agriculture Tymofiy Mylovanov has noted: “We do not develop the economy simply for the sake of economic development, we do not raise GDP for the sake of high GDP, our main goal is to accelerate the implementation of key reforms to improve the quality of life of Ukrainians.” However, it is the goal yet to be reached. For instance, Ukraine ranks 133rd out of 156 countries by the level of happiness, according to the World Happiness Report 2019.
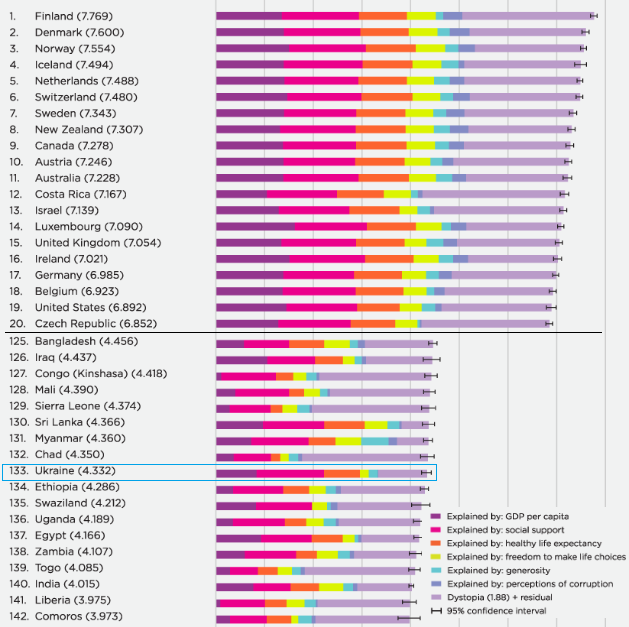
Source: World Happiness Report
The connection between happiness and money is easily traced. Studies show that the happier people are more productive and generate more revenue for their employers. People who have more money are usually happier (it is true only to a certain point, though). The gap in productivity between Ukraine and Europe is quite significant at the moment, even the geographical closeness doesn’t help much. According to the World Bank report, an average Ukrainian worker needs a year to produce the same amount of goods that average German worker needs 17 days to produce.
Statistics show that the main factors influencing the happiness of the Ukrainians are high income, good health and family. While inflation rate, absence of official job, or even war in the country, with some exceptions, do not sour our citizens’ mood.
Below we analyze the factors that can make Ukrainians happier, and decide whether the state can influence these factors.
Income
Many studies in other countries around the world have shown that wealth affects happiness. This statement is supported, for example, by the recent study by Andrew T. Jebb and his colleagues, based on a representative sample of over 1.7 million people worldwide. On average, the level of happiness in the world increases with the level of income up to 60-75 thousand dollars a year (in purchasing power parity). In richer countries, this amount may be higher. After that point income growth is no longer able to make a person happier.
The Kyiv International Institute of Sociology asked about the income of Ukrainians focusing not on money itself, but on respondents ability to afford their needs. So increasing the income of Ukrainians from the level of “not enough money even for food” to the level of “we can afford anything we want” increases the likelihood that the “rich” one will define himself as a happy person, by 23-33% (different percentage growth in different age categories). At the same time, poverty does not equal misery — 37.7% of those who said they didn’t have enough money even for food said they were happy.
The level of happiness in this article is the share of people within the relevant group who described themselves as being happy or rather happy during the questionnaire.
Another factor that proved to be important for Ukrainians is the negative experience of «experiencing the loss of livelihood» within the previous year. And most of all it reduced the level of happiness of people aged 30-39 years (by 25%) and of people over 60 years (by 18%). At the same time, this experience does not impair the happiness of young people under 29 years.
Possible reasons are that at the age of 30, most Ukrainians already have underage children whose welfare depends on their parents’ income. Accordingly, the unexpected loss of money hurts middle-aged people more than young people. People aged 40-49 years and retirement age (over 60 years) face another problem — it is difficult to recover lost savings due to limited access to job market.
Interestingly, the factors that were important in predicting happiness levels in other countries, like unemployment and inflation, were statistically insignificant for Ukrainians in our analysis. The rate of inflation affects only pensioners and positively (+16%) — that is, the increase of inflation by 100% increases the likelihood that people over the age of 60 say that they feel happy by 16%. This result may have been caused by a marked increase in pensions and other payments in years of high inflation.
Unemployment is an insignificant factor for all age groups except the 40-59 (it reduces the likelihood of a person feeling happy by 4%). The downside may be that it is difficult for people of retirement age to find a job. However, the reason for the lack of influence for other age groups may be that people who have temporary and informal jobs indicate that they are unemployed, although they have income from (irregular) work.
Health
The correlation between health and level of happiness is easy to predict. It’s pretty hard to be happy when you’re feeling unwell. In fact, feeling okay or feeling great increases the likelihood of person considers themselves happy by 17-59% compared to feeling bad. This factor is equally important for all age groups.
At the same time, the question of being satisfied with your health (“Are you satisfied with your health?”) is unrelated to the answers about the level of happiness. In the case of “very satisfied”, this factor increases the level of happiness only for people aged 40-59 years by 23%. It has no influence on the happiness level of other age cohorts. This may be due to the fact that Ukrainians do not associate hapiness at the moment with being satisfied with their health in general, expecting it to deteriorate in the future. Or, perhaps, no level of health (which tends to deteriorate as time passes) is satisfactory for Ukrainians.
Personal qualities and family
Our study shows that for women, the likelihood of being a happy person is 3-7% higher compared to men. However, this rule does not apply to the older age group. Men aged 60+ years consider themselves happy 4% more likely than women of same age. By the way, Plagnol and Easterlin reached the same conclusions back in 2008, while studying the U.S. population. Their study showed that younger women are happier than men because they are closer to fulfilling their family and material goals (owning a car, a house/apartment, traveling abroad). However, as the years go by, it’s men who move closer to fulfilling their goals and become happier than women (the shift happens approx. at the age of 45).
In general,in the world young people and retired people are considered the happiest. The U-curve is used to describe this phenomenon. In Ukraine, however, this rule does not work. A survey by the Kyiv International Institute of Sociology found that the elderly people are the least happy in Ukraine (75.8% of people aged 18-29 years said they were happy or rather happy, while among those over 60 only 44.3% gave the same answers) — Fig. 1.
Figure 1. Are you happy?
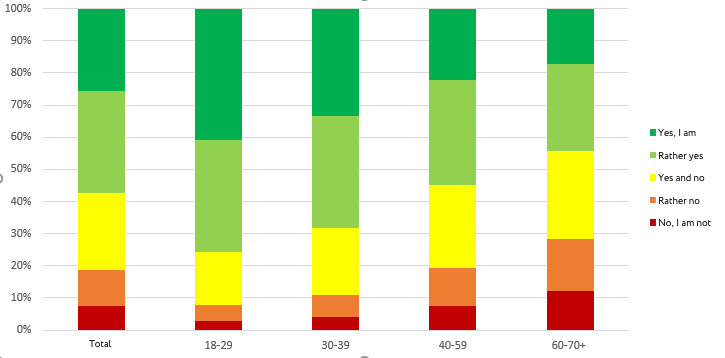
Source: KIIS data, authors’ calculations
Having an official family status is a significant factor for the level of happiness for people of any age. It raises happiness levels by 5-16% (less for the youngest group and more for people aged 40-59).
At a young age, family of two is enough for the Ukrainians. The size of the family does not increase their satisfaction with life. However, for people over 40, the larger the family, the greater is the pleasure they get from life (increasing the likelihood of being happy by 8-24%). Older people are happiest in families with 6 or more people living together. This pattern can be a consequence of the lack of social relationships outside the family for older people. Interestingly, more than half of the respondents (54%) who live in families with 6 or more members have low and middle income per family, so this effect is not directly related to the transfer of the income effect.
Cities vs countryside
Almost 13 million Ukrainians live in villages, in cities — just over 29 million. We tried to define where people feel happier. It turned out that Ukrainians are less happy in rural areas than in urban areas. However, as to cities, the preferences of Ukrainians change with age. Young people are the most happy when living in metropolitan areas (8% more likely to call themselves happy), and middle-aged and older people prefer living in cities of medium (up to 100,000) and large (up to 500,000) size (3-11% more likely to call themselves happy). Our study found no influence of the region of residence on human happiness. A previous study by Maksym Obrizan and Tom Coupe, which examined the impact of war on the happiness of Ukrainians, shows that this factor is negative and significant only for the areas adjacent to the war zone.
External factors
We combined the years in which the presidential and parliamentary elections (2006, 2007, 2010, 2012, 2014) took place, in one variable. It turned out that in these years the likelihood of calling oneself a happy person increases by 2-3% among all respondents except for the youngest age group. This may be due to the authorities’ attention to the problems of citizens during the pre-election period, as well as to the positive expectations Ukrainians have before and right after the elections.
Age gap
Another question we were interested in exploring was whether the factors affecting the level of happiness of Ukrainians changed during the survey period (2005-2018). Understanding whether the tastes of Ukrainians change with age, or whether different tastes are inherent in different generations and remain unchanged as they grow up, can be useful in public policy making. For comparison, we decided to look at the importance of official marital status and income.
Figure 2. How does official marital status influence the likelihood of happiness of Ukrainians, 2006 and 2018 (by percentage)
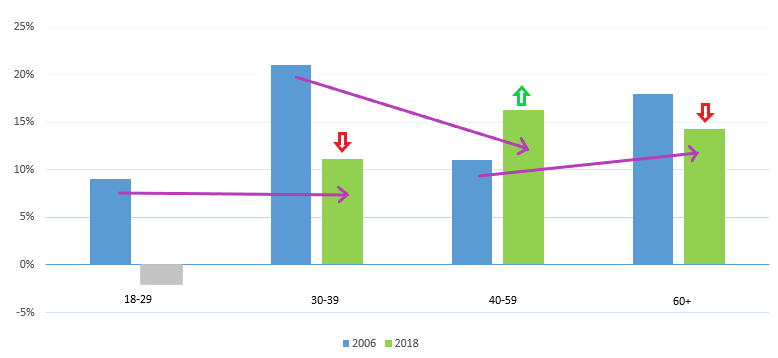
Source: authors’ calculations based on KIIS data. Note: statistically insignificant data in our study is highlighted gray and has no prediction power. Legend Explanation: Purple arrows show columns that correspond to different stages of maturity of the same people. That is, people who were 30-39 years old in 2006 fell into the 40-59 age group in 2018. People who were 40-59 in 12 years were more likely to be in the 60+ age group, breaking those who were already there in 2006 (people who were over 60 in 2006 and over 71 in 2018 ).
The data shows that the importance of official marital status in 2018 is much lower for people aged 30-39 years than in 2006, and higher for people aged 40-59 years. At the same time, we see that during adulthood for people who were 30-39 years old in 2006, the importance of marital status declined slightly, and for people who were 40-59 years in 2006, it slightly increased. In general, these data show that the difference between generations is greater than changes within one generation. Therefore, people’s preferences on family status can be considered relatively constant.
Figure 3. The impact of family income on the likelihood of being happy, 2005 and 2018
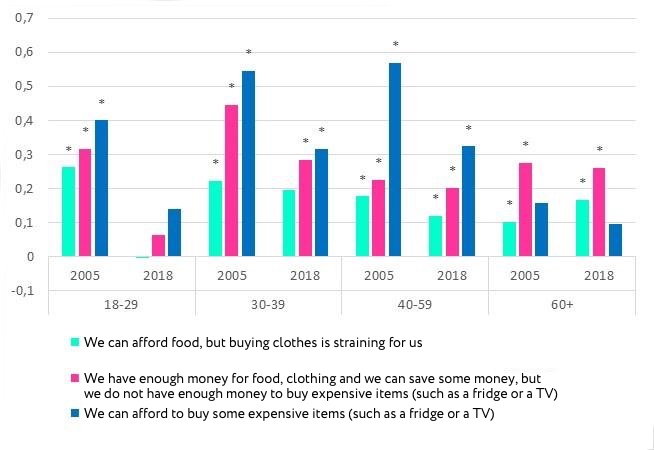
* – statistically significant results. You can see the graph data in the Table 2 below. Explanation. The height of the column shows an increase in the likelihood of being happy for people in the relevant income group compared to the base category — “not enough money even for food”. We can see that among people aged 18-29 in 2005, the transition to the category “We can afford food, but buying clothes is straining for us” increased the level of happiness by 26%, and the transition to the next category increased the level of happiness by 32%.
Figure 4. Increase in happiness with the transition to higher income categories by age
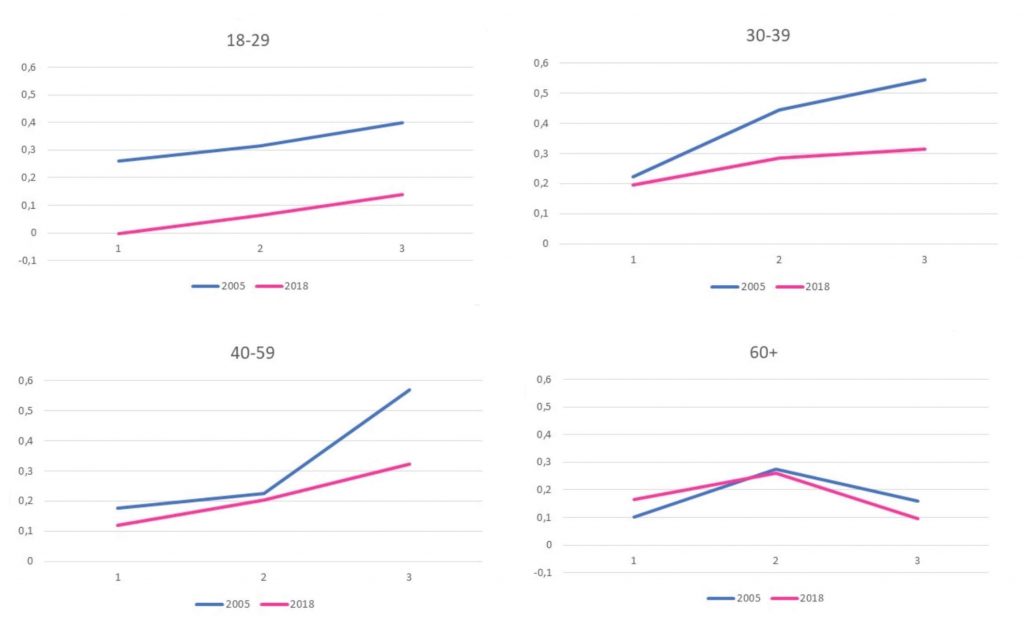
Figure 4 presents more details from both Table 2 and Figure 3. It shows that the impact of income on happiness has declined for the youngest population. Income level has the most significant impact on happiness of middle-aged people (30-59), although it also declined between 2005 and 2018.
Figures 3 and 4 show that, compared to 2005, the impact of money on happiness decreased for all age groups, except for the oldest low-income group. We associate this with an increase in overall quality of life.
The results of the study show that there is no universal recipe for happiness. The factors of happiness may vary for different ages, as well as for the same people over the course of life. This should be taken into account in policy making (if the policy goal is to increase the proportion of people who feel happy).
Conclusions and policy recommendations
Macroeconomic indicators such as inflation rate or unemployment have little effect on the level of happiness of Ukrainians. At the same time, loss of income or low income significantly reduce the level of happiness of Ukrainians. Family, life in a city and good health were among the most important positive factors.
In order to make Ukrainians of all ages happy, policymakers have to choose the right tools for each age group. Youth need support in moving to big cities and starting their independent lives. Middle-aged Ukrainians want to have a family-friendly environment. The state can support this through sound legislation in the areas of family law, labor and social protection. Elderly people want to be part of a large family (or community) and be protected from losing money. This can be achieved through financial insurance and educational programs that teach people how to protect themselves from fraud.
In the table below, we suggest a few policies that can improve the happiness level of different age groups of Ukrainians.
| Age group | The factor influencing happiness | Impact on the likelihood of calling oneself happy | Policy to achieve positive effect |
| 20-29 years | health | +20-51% | information campaigns on preventative examinations, signing a declaration with the family doctor |
| above average income | +21-23% | information on skills valued by employers, promotion of integration of these skills into educational programs, advisory assistance in preparation of resumes and interviews (State Employment Service) | |
| Life in a megapolis | +8% | dormitories at universities and first jobs. Supporting hostel development | |
| 30-39 years | health | +17-52% | information campaigns on preventative examinations, signing a declaration with the family doctor |
| Stable income (have never experienced loss of livelihood) | +25% | social assistance in case of loss of employment and means of subsistence, employment assistance (State Employment Service) information campaigns on the need to save, including for retirement, financial and economic literacy campaigns | |
| Official marital status | +11% | developing an infrastructure that allows to combine childbirth and career, allowing same-sex marriage | |
| Life in average-sized or a big city | +5-11% | development of opportunities to work remotely, development of jobs outside major cities | |
| 40-59 years | health | +22-59% | information campaigns on preventative examinations, signing a declaration with the family doctor |
| above average income | +31-33% | anti-discrimination policies in the labor market, provision of retraining for people with outdated occupations, information on pension funds | |
| big family | +24% | labor legislation that allows to combine work and family effectively, the development of kindergarten and school infrastructure, foster care and adoption | |
| Official marital status | +16% | marriage awareness campaigns at all ages, psychological support for families in crisis | |
| 60+ years | Health | +21-44% | development of nursing and medical care |
| 60+ years | above average income | +27-34% | information campaigns for reasonable savings and use of money |
| 60+ years | big family | +23% | involving older people in an active social life (for example, the Lifelover fund) |
| 60+ years | Never experienced loss of livelihood | +18% | training in financial literacy and protection against financial fraud |
| 60+ years | Official marital status | +12% | information campaigns on the appropriateness of marriage at any age, psychological help for families in crisis |
Table 2. Income influence on the likelihood of happiness, 2005 and 2018
| Age | 18-29 | 30-39 | 40-59 | 60+ | ||||
| Income level | 2005 | 2018 | 2005 | 2018 | 2005 | 2018 | 2005 | 2018 |
| We can barely afford buying food | basic level of happiness for comparison | basic level of happiness for comparison | basic level of happiness for comparison | basic level of happiness for comparison | ||||
| We can afford food, but buying clothes is straining for us | 0.262**
(0.95) |
– 0.003
(0.120) |
0.222*
(0.091) |
0.195
(0.115) |
0.177***
(0.048) |
0.120*
(0.058) |
0.101*
(0.042) |
0.166***
(0.047) |
| We have enough money for food, clothing and we can save some money, but we do not have enough money to buy expensive items (such as a fridge or a TV) | 0.317***
(0.094) |
0.064
(0.242) |
0.445***
(0.092) |
0.284*
(0.116) |
0.225***
(0.054) |
0.203**
(0.063) |
0.275***
(0.063) |
0.260***
(0.068) |
| We can afford to buy some expensive items (such as a fridge or a TV) | 0.400***
(0.104) |
0.139
(0.527) |
0.546***
(0.115) |
0.316*
(0.134) |
0.570***
(0.077) |
0.324***
(0.080) |
0.158
(0.184) |
0.097
(0.245) |
| We can afford to buy anything we want | Not enough cases (0 to 7) | |||||||
Methodology
We took data for the study from 19 waves of a nationwide survey of the Kyiv International Institute of Sociology from 2005 to 2018, which has the question “Do you consider yourself a happy person?”. We have received 37325 observations. Since this question has categorical (“happy”, “other”) rather than quantitative answers, we used marginal effects from the logistics model to establish the relationships. The article was written based on the thesis “Age cohorts and happiness in Ukraine: what matters in what age” and supplemented with data for 2018.


Attention
The authors do not work for, consult to, own shares in or receive funding from any company or organization that would benefit from this article, and have no relevant affiliations