Russia’s invasion forced many Ukrainians to leave their homes and travel abroad in search of safety for themselves and their families.
According to UNHCR data, as of June 2024, 6.5 million Ukrainians have become refugees, with nearly 6 million residing in Europe. Poland has hosted the largest number of Ukrainians following the full-scale Russian invasion: from February 24, 2022, to January 19, 2024, there were 18.61 million border crossings from Ukraine to Poland. Some Ukrainian refugees have moved on to other countries, some have returned home, and nearly a million have chosen to settle in Poland.
Furthermore, about 1.35 million Ukrainians were already living in Poland before February 2022, primarily as labor migrants. Some of them returned after the Russian attack, while others stayed in Poland despite initially planning to return. People who left Ukrainian territory after February 24, 2022, and re-entered Poland, were entitled to the same status as refugees – an identification document (PESEL) with UKR status confirming temporary protection. Therefore, distinguishing clearly between refugees and pre-war migrants is challenging. In this study, we rely on respondents’ answers, considering those who arrived to Poland after February 24, 2022 as refugees and those who came earlier as migrants.
The survey was conducted by the “Rating” sociological group on behalf of American University Kyiv from December 12 to 19, 2023, across the entire Poland. It covered Ukrainians residing in Poland at the time of the survey: 937 respondents who arrived in the country after the start of the full-scale Russian invasion (refugees), and 202 who came before the invasion (migrants).
The study aims to understand the factors influencing Ukrainians’ desire to return home. We particularly focus on “intangible” factors such as emotions, national identity, and a sense of pride for the home country.
How many Ukrainians plan to return home?
To understand Ukrainians’ plans regarding their return, we asked them five questions about their intentions to return at different points in time or to stay in Poland The questions were formulated as follows:
“To what extent do you agree with the statement:
- I plan to return to Ukraine as soon as possible.
- I plan to return to Ukraine in the foreseeable future.
- Maybe I will return to Ukraine some day.
- I would like to spend some time in Ukraine (for example, during holidays or vacations) while living in Poland.
- I plan to stay in Poland.”
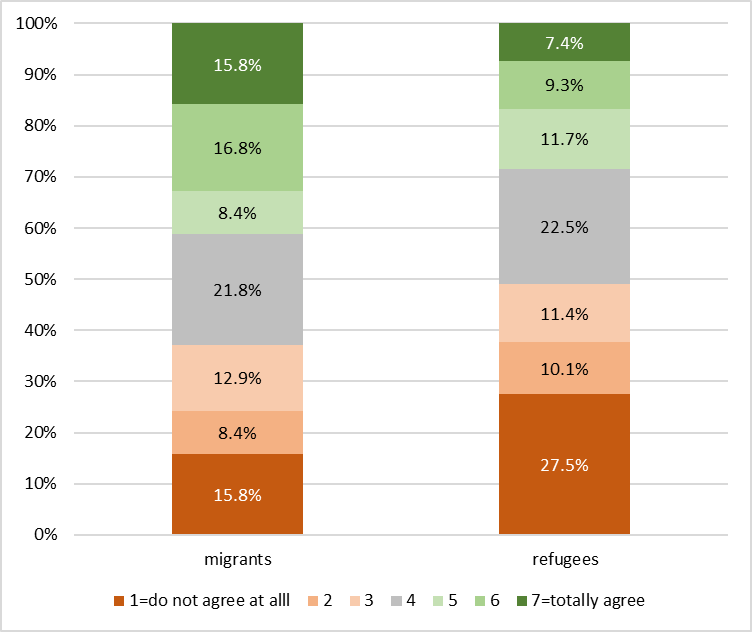
Figure 1. Response options to the question about intentions to return to Ukraine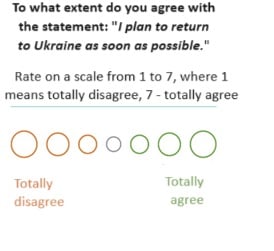 The respondents answered all six questions on a 7-point scale, where 1 meant “totally disagree” and 7 meant “totally agree.” For respondents, the answer options appeared as shown in Figure 1.
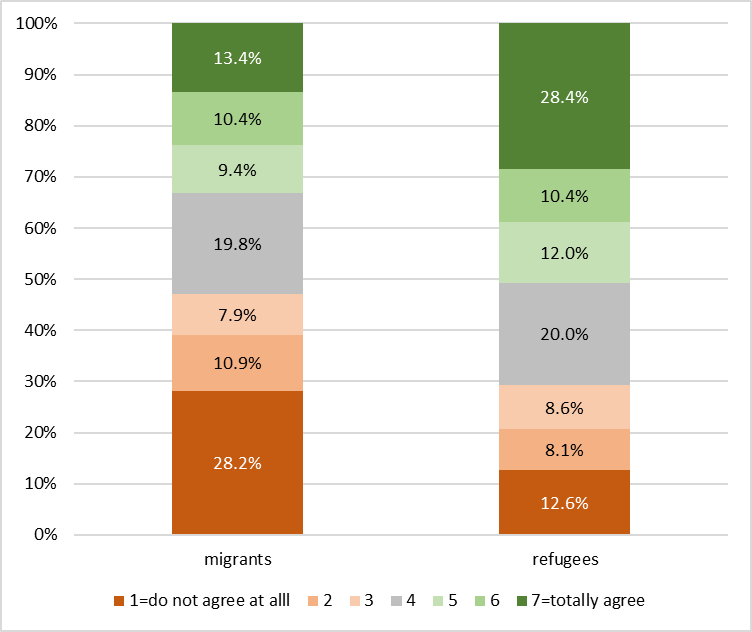
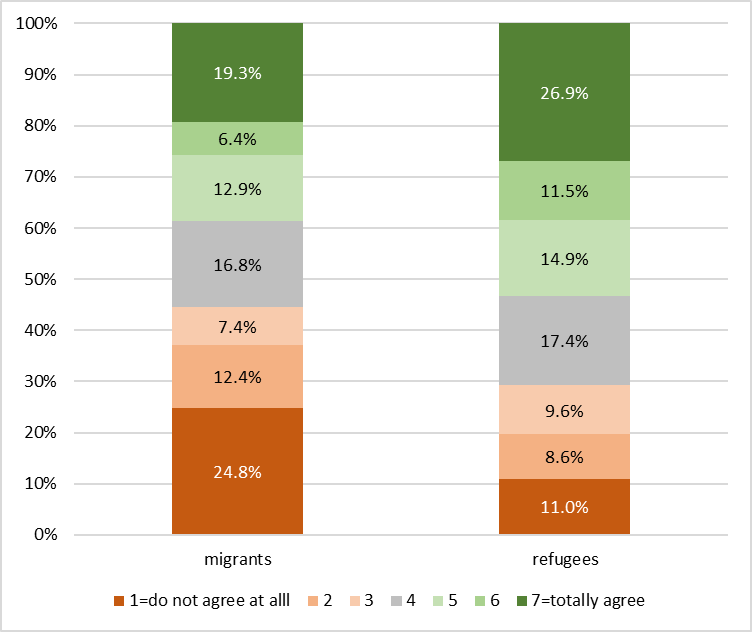
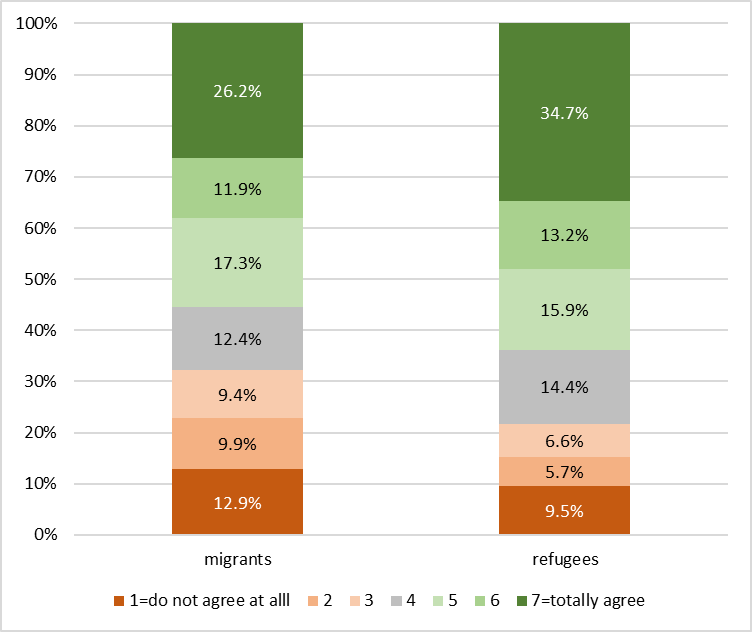
Approximately half of refugees and a third of migrants demonstrate clear intentions to return to Ukraine: 51% of refugees agree (responses 4-7) with the statement about returning as soon as possible, and 53% intend to return in the foreseeable future. Among migrants, these percentages are 33% and 39%, respectively (see Figures 2a and 2b). About 64% of refugees and 55% of migrants express an intention to return “some day.” Respondents who answered negatively about returning “some day” are likely those who do not intend to return at all. This group includes 22% of refugees and 32% of migrants.
Between 12% and 23% of respondents chose the option “difficult to answer” to questions about returning. This category includes individuals who have not yet decided about their plans and could potentially be influenced by return-encouraging interventions by the Ukrainian government.
Figure 2. Distribution of responses to the question: To what extent do you agree with the statement:
| a) I plan to return to Ukraine as soon as possible | b) I plan to return to Ukraine in the foreseeable future |
 |
 |
| c) Maybe I will return to Ukraine one day | d) I plan to stay in Poland |
 |
 |
Demographic factors and return
First, we examined which socio-demographic factors are significant in shaping decisions to return. According to the assessment results (see Table 1A in the Appendix), the desire of refugees and migrants to return to Ukraine is influenced by:
- Time of relocation to Poland: Refugees are more inclined to return compared to migrants.
- Age: The desire to return increases significantly among individuals aged 50 and up.
- Children: Having school-aged children negatively correlates with intentions to return.
- Language of communication: Respondents whose primary language of communication is Russian or Polish are less likely to express intentions to return.
- Financial status: Higher financial status correlates with lower intentions to return.
Statistically insignificant factors include gender, marital status, presence of parents, children, or spouse in Ukraine, and pre-migration region of residence (with only a weak negative correlation found for Kyiv).
Interestingly, socio-demographic factors explain a significant portion of the variance in the desire to return as soon as possible and in the foreseeable future (14-15%). However, these factors hardly explain the variance in the intention to return “some day” (R-squared for this regression is 0.026). We interpret this as respondents having a very unclear stance on the statement “Maybe I will return to Ukraine one day,” and they respond to it somewhat randomly, unlike the statement about returning as soon as possible, for which they have a more clearly formed opinion.
Feelings and willingness to return
Previous research indicates that reasons for returning from migration, including forced migration, involve not only demographic and socio-economic factors but also “intangible” factors such as feelings, emotions, and a sense of national identity.
We asked the respondents how often they experience homesickness, loneliness, hope for a better future, uncertainty, fear of the future, feeling guilty for going abroad, gratitude towards the local population of the host country, and hostility from those living in Ukraine. For each feeling, respondents had to choose one of the following response options: never (1), rarely (2), sometimes (3), often (4), or always (5). Interestingly, despite differences in time and motivation for coming to Poland, the feelings of refugees and migrants are very similar. Most commonly, they experience homesickness, hope for a better future, and gratitude to the local population of the host country (see Figure 3).
Figure 3. Rate how often you experience the following feelings (1-never, 5-always)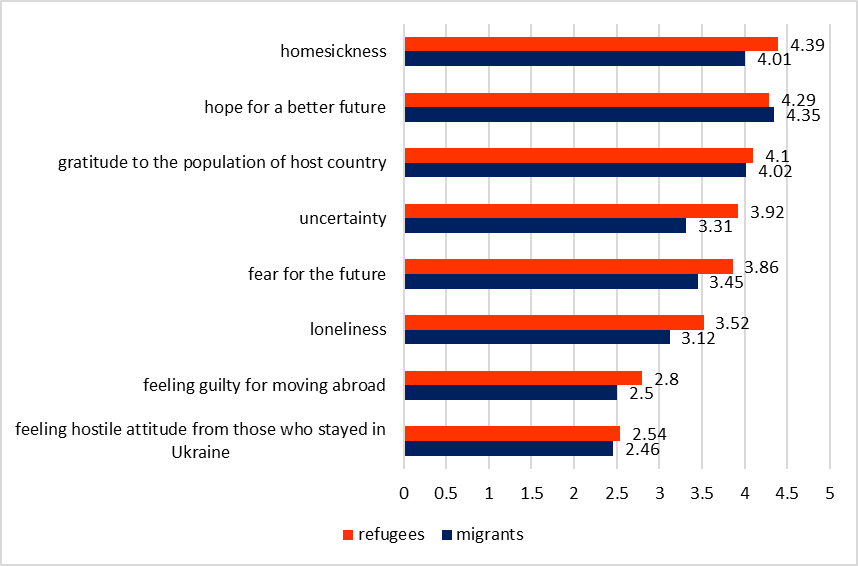
Feelings significantly influence the motivation to return home (see Figure 4). When added to demographic factors, we observe a substantial increase in explanatory power both for the variable of returning as soon as possible (R-squared increases from 0.16 to 0.34) and for the variable of returning one day (R-squared increases from 0.026 to 0.08). Homesickness has the largest effect, significantly increasing the desire to return to Ukraine. Feeling guilty for leaving the country is also a statistically significant factor positively correlated with the desire to return. Conversely, gratitude towards the host country’s local population and hostility from those living in Ukraine negatively impact intentions to return (see Figure 4 and Table 2A in the Appendix).
Figure 4. Effect of emotional factors on the desire to return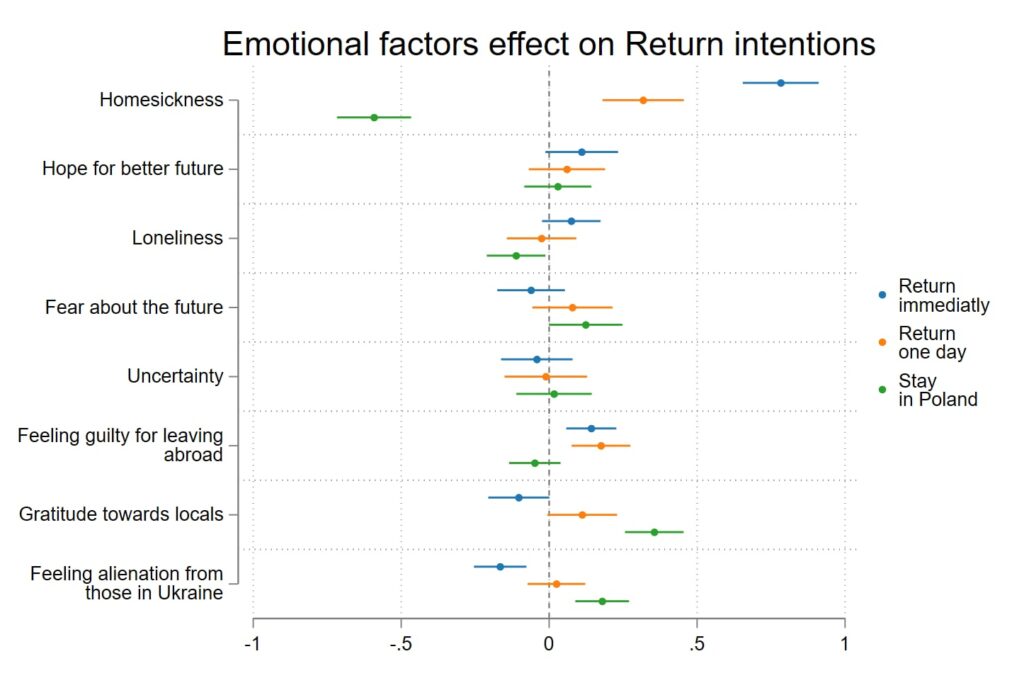
National Identity, Pride, and Return
In addition to emotional factors, other “intangible” factors that may affect the intentions of refugees and migrants to return home include feelings of national identity and pride for their country. To measure these factors, we utilized the questionnaire from the International Social Survey Program (ISSP) — an international survey conducted since 1984 on various societal topics across many countries worldwide. Our survey included questions from the 2013 ISSP module on national identity. The questions on identity were divided into two variables: “acquired” identity (characteristics that respondents can consciously change during their lifetime) and “endowed” identity (characteristics that are typically difficult to influence; see Table 1). For each response of “very important” or “quite important,” respondents received one point; thus, the score for “acquired” and “endowed” identity could range from 0 to 4.
Table 1. Questions in the questionnaire to measure two types of national identity
| Acquired identity | Endowed identity |
| Some say that the following things are important for being truly Ukrainian. Others say they are not important. How important do you think each of the following is to be Ukrainian? | Some say that the following things are important for being truly Ukrainian. Others say they are not important. How important do you think each of the following is to be Ukrainian? |
| To be able to speak Ukrainian | To be born in Ukraine |
| To be Christian | To have Ukrainian citizenship |
| To respect Ukrainian political institutions and laws | To have lived in Ukraine for most of your life |
| To feel Ukrainian | To have Ukrainian roots (parents, grandparents, etc.) |
To measure pride for Ukraine, we used questions from the same survey (see Table 2). Depending on the number of questions where respondents answered “very proud” or “somewhat proud,” they were assigned a score ranging from 0 to 10 as an indicator of pride for the home country.
Table 2. Questions to measure pride for their country
|
As seen from Figure 5 (and Table 3A in the Appendix), both types of identity and pride have a statistically significant impact on the desire to return.
When considering identity and pride factors, the adjusted R-squared increases from 0.16 to 0.25 for the variable of returning as soon as possible and from 0.026 to 0.042 for the variable of returning one day. Thus, the statement “Maybe I will return to Ukraine one day” remains highly ambiguous for respondents, and even the combination of socio-demographic, cultural, and emotional factors explains very little in their responses to this question.
Figure 5. Effect of identity and pride in their country on return intentions. Linear regression results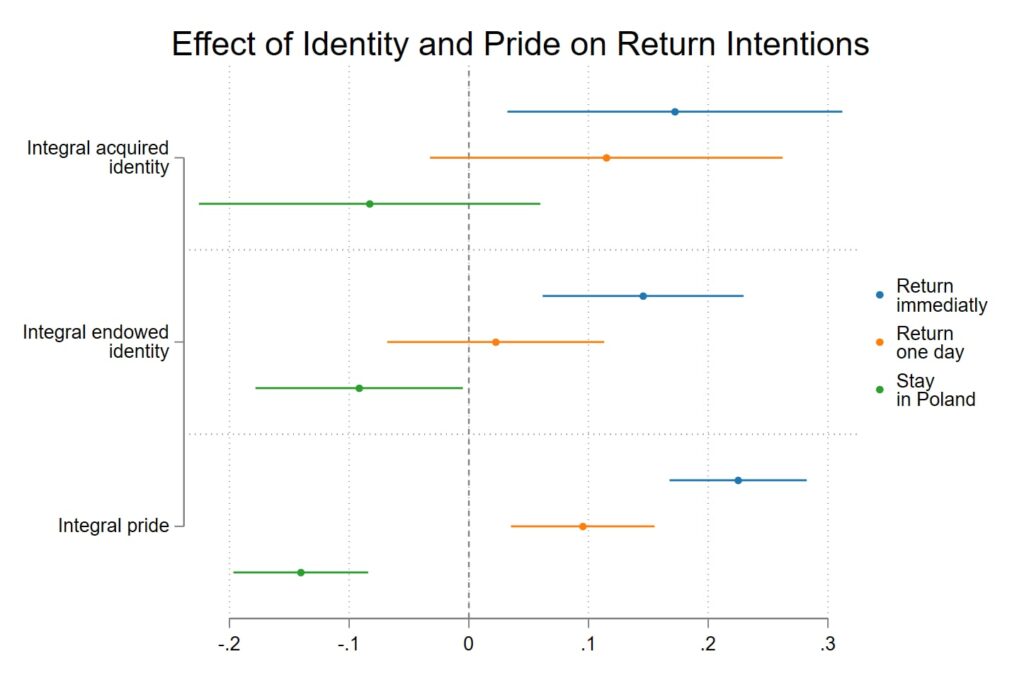
Therefore, the intentions of Ukrainians in Poland to return home are influenced by socio-demographic, emotional, and cultural factors. Among the socio-demographic factors, statistically significant effects include age 50+, having school-aged children, high income, and speaking Russian or Polish. Additionally, refugees demonstrate a stronger desire to return compared to pre-war migrants.
Among the “intangible” factors, significant ones include homesickness and feelings of guilt for leaving the country (which increase the desire to return), as well as gratitude to the Polish population and perceptions of hostility from those living in Ukraine (which decrease the willingness to return). Furthermore, national identity and pride for their country positively correlate with the desire to return home.
The research team:
Volodymyr Vakhitov, American University Kyiv
Nataliia Zayika, American University Kyiv
Serhii Kandul, University of Zurich
The full research report is available at the following link in Ukrainian and English.
Appendix.
Table 1A. Effect of demographic factors on return. Logistic regression results
| Now | Soon | One day | Time in Ukr | Stay in PL | ||
| Before/After February 24 | 0.748*** | 0.574*** | 0.359* | 0.170 | -0.507*** | |
| 30-39 | 0.237 | 0.150 | 0.106 | 0.111 | -0.235 | |
| 40-49 | 0.367* | 0.391* | 0.210 | 0.314 | -0.213 | |
| 50+ | 1.125*** | 1.018*** | -0.0870 | 0.553*** | -0.722*** | |
| Female | 0.102 | 0.0410 | -0.0586 | 0.192 | 0.146 | |
| Gender – Other | -0.868 | -0.875 | -1.253 | -1.694* | -0.485 | |
| Reg. Center | -0.135 | -0.352 | -0.378* | -0.150 | 0.499** | |
| Reg. South | 0.259 | 0.0335 | -0.369* | -0.0947 | -0.0746 | |
| Reg. East | -0.238 | -0.433* | -0.362* | -0.301 | 0.0287 | |
| Reg. Kyiv | -0.478* | -0.479* | -0.261 | -0.395* | 0.248 | |
| Have kids at school | -0.499*** | -0.347** | -0.310* | -0.134 | 0.380** | |
| Home lang Russian | -0.596*** | -0.522*** | -0.109 | -0.346** | 0.216 | |
| Home lang Polish | -1.165*** | -0.864*** | -0.657*** | -0.789*** | 1.002*** | |
| Home lang other | -0.110 | -0.358 | 0.285 | -0.631 | -0.310 | |
| Separated | 0.150 | 0.259 | 0.179 | -0.278 | -0.156 | |
| Unmarried together | -0.164 | -0.135 | 0.0672 | -0.00962 | 0.0454 | |
| Unmarried separate | -0.0548 | -0.211 | -0.201 | -0.148 | 0.150 | |
| Single | -0.0689 | 0.0308 | 0.00373 | 0.0351 | -0.217 | |
| Divorced | -0.145 | 0.0469 | -0.0234 | -0.138 | 0.0442 | |
| Widowed | 0.229 | 0.193 | 0.368 | 0.161 | -0.354 | |
| RTA | -0.260 | -0.394 | 0.0433 | 0.0596 | 0.0206 | |
| Income: middle | -0.539*** | -0.559*** | -0.0949 | -0.325** | 0.381** | |
| Income: rich | -1.108*** | -1.216*** | -0.647*** | -0.805*** | 0.876*** | |
| Family in Ukraine | 0.0868 | 0.0363 | 0.180 | 0.138 | -0.283** | |
| _cons | 4.444*** | 4.856*** | 5.245*** | 5.649*** | 3.464*** | |
| N | 1024 | 1024 | 1024 | 1024 | 1024 | |
| adj. R2 | 0.156 | 0.141 | 0.026 | 0.069 | 0.097 |
* p<0.10, ** p<0.05, *** p<0.01
Table 2A. Effect of emotional factors on return Intentions. Linear regression results
| Now | Soon | One day | Time in Ukr | Stay in PL | |
| Before/After February 24 | 0.641*** | 0.463*** | 0.243 | 0.0593 | -0.472*** |
| 30-39 | 0.129 | 0.0277 | 0.0559 | 0.0258 | -0.219 |
| 40-49 | 0.282 | 0.291 | 0.180 | 0.245 | -0.192 |
| 50+ | 0.844*** | 0.712*** | -0.142 | 0.371** | -0.536*** |
| Female | -0.0140 | -0.0817 | -0.180 | 0.0602 | 0.156 |
| Gender-Other | -0.768 | -0.722 | -0.975 | -1.521* | -0.179 |
| Reg. Center | -0.105 | -0.341* | -0.359* | -0.147 | 0.429** |
| Reg. South | 0.0231 | -0.197 | -0.435** | -0.247 | 0.133 |
| Reg. East | -0.367* | -0.565*** | -0.399* | -0.395** | 0.124 |
| Reg. Kyiv | -0.491** | -0.485** | -0.255 | -0.406* | 0.297 |
| Have kids at school | -0.391*** | -0.229 | -0.296* | -0.0781 | 0.289** |
| Home lang Russian | -0.333** | -0.275** | 0.0895 | -0.139 | 0.114 |
| Home lang Polish | -0.745*** | -0.455** | -0.450** | -0.473*** | 0.679*** |
| Home lang other | 0.134 | -0.137 | 0.423 | -0.436 | -0.499 |
| Separated | 0.162 | 0.259 | 0.206 | -0.259 | -0.165 |
| Unmarried together | -0.201 | -0.174 | 0.0447 | -0.0458 | 0.0574 |
| Unmarried separate | -0.0376 | -0.205 | -0.0955 | -0.0962 | 0.189 |
| Single | -0.106 | -0.0259 | 0.0589 | 0.0317 | -0.168 |
| Divorced | -0.248 | -0.0578 | 0.0471 | -0.148 | 0.232 |
| Widowed | 0.304 | 0.258 | 0.437 | 0.228 | -0.442 |
| RTA | -0.494** | -0.609*** | -0.00387 | -0.0637 | 0.260 |
| Income: middle | -0.326** | -0.347** | 0.0134 | -0.165 | 0.241* |
| Income: rich | -0.713*** | -0.835*** | -0.424** | -0.505*** | 0.578*** |
| Family in Ukraine | -0.0224 | -0.0795 | 0.174 | 0.0777 | -0.145 |
| Homesickness | 0.783*** | 0.739*** | 0.318*** | 0.555*** | -0.592*** |
| Hope for a better future | 0.110* | 0.138** | 0.0601 | 0.0821 | 0.0294 |
| Loneliness | 0.0749 | 0.0911* | -0.0257 | 0.00679 | -0.112** |
| Fear of the future | -0.0611 | -0.0773 | 0.0787 | 0.0126 | 0.124* |
| Uncertainty | -0.0416 | 0.00213 | -0.0111 | 0.0114 | 0.0166 |
| Feeling guilty for going abroad | 0.142*** | 0.122*** | 0.175*** | 0.117*** | -0.0485 |
| Gratitude to the local population | -0.103* | -0.0608 | 0.112* | 0.0348 | 0.355*** |
| Hostile attitude | -0.166*** | -0.212*** | 0.0247 | -0.0918** | 0.179*** |
| _cons | 1.263** | 1.620*** | 2.462*** | 2.648*** | 3.945*** |
| N | 1024 | 1024 | 1024 | 1024 | 1024 |
| adj. R2 | 0.337 | 0.320 | 0.081 | 0.191 | 0.246 |
* p<0.10, ** p<0.05, *** p<0.01
Table 3A. Impact of identity and pride on return intentions. Linear regression results
| Now | Soon | One day | Time in Ukr | Stay in PL | |
| Before/After February 24 | 0.743*** | 0.570*** | 0.363* | 0.177 | -0.503*** |
| 30-39 | 0.141 | 0.0552 | 0.0670 | 0.0463 | -0.178 |
| 40-49 | 0.314 | 0.348* | 0.191 | 0.287 | -0.182 |
| 50+ | 1.072*** | 0.967*** | -0.109 | 0.517*** | -0.691*** |
| Female | -0.0450 | -0.106 | -0.119 | 0.0896 | 0.234* |
| Gender-Other | -0.368 | -0.393 | -1.080 | -1.413 | -0.787 |
| Reg. Center | -0.156 | -0.391* | -0.372* | -0.152 | 0.518** |
| Reg. South | 0.208 | -0.0493 | -0.380* | -0.135 | -0.0368 |
| Reg. East | -0.159 | -0.370* | -0.327 | -0.252 | -0.0149 |
| Reg. Kyiv | -0.432* | -0.455* | -0.236 | -0.367* | 0.226 |
| Have kids at school | -0.503*** | -0.343** | -0.305* | -0.121 | 0.382** |
| Home lang Russian | -0.271* | -0.209 | 0.0414 | -0.101 | 0.0266 |
| Home lang Polish | -0.955*** | -0.649*** | -0.570*** | -0.638*** | 0.875*** |
| Home lang other | 0.196 | -0.0663 | 0.420 | -0.411 | -0.489 |
| Separated | 0.152 | 0.258 | 0.189 | -0.263 | -0.156 |
| Unmarried together | -0.123 | -0.0960 | 0.0839 | 0.0173 | 0.0212 |
| Unmarried separate | -0.00798 | -0.156 | -0.166 | -0.0818 | 0.123 |
| Single | -0.0712 | 0.0179 | 0.00851 | 0.0365 | -0.213 |
| Divorced | -0.162 | 0.0337 | -0.0352 | -0.155 | 0.0531 |
| Widowed | 0.196 | 0.126 | 0.337 | 0.0881 | -0.331 |
| RTA | -0.102 | -0.234 | 0.117 | 0.185 | -0.0728 |
| Income: middle | -0.471*** | -0.503*** | -0.0634 | -0.280** | 0.343** |
| Income: rich | -0.952*** | -1.064*** | -0.582*** | -0.698*** | 0.783*** |
| Family in Ukraine | 0.111 | 0.0623 | 0.187 | 0.151 | -0.299** |
| Acquired Identity | 0.172** | 0.105 | 0.115 | 0.151** | -0.0829 |
| Endowed Identity | 0.146*** | 0.135*** | 0.0224 | 0.0316 | -0.0916** |
| Pride | 0.225*** | 0.259*** | 0.0952*** | 0.183*** | -0.140*** |
| _cons | 2.195*** | 2.632*** | 4.248*** | 3.981*** | 4.793*** |
| N | 1024 | 1024 | 1024 | 1024 | 1024 |
| adj. R2 | 0.247 | 0.244 | 0.042 | 0.137 | 0.134 |
* p<0.10, ** p<0.05, *** p<0.01

Attention
The author doesn`t work for, consult to, own shares in or receive funding from any company or organization that would benefit from this article, and have no relevant affiliations