In simple terms, GDP is equivalent to value added. Statisticians approach its calculation in two ways. The resulting discrepancy between two numbers is equal to UAH 600 billion. Perhaps, it is now time to find out how large Ukraine’s economy really is.
In the middle of February, Ukraine’s Prime Minister Volodymyr Groysman announced that Ukraine’s GDP rose by 4.7% in the last quarter of 2016 compared to the 4th quarter of 2015. “This means that Ukraine’s economy has started to get up off its knees”, claimed the head of the government. IMF and the Ministry of Economic Development and Trade have estimated that Ukraine’s economy grew by about 2.2% in 2016, with GDP rising above UAH 2.3 trillion. The State Statistic Service of Ukraine will probably release a similar number on March 21, when the preliminary official GDP estimates for 2016 are to be made public.
But what if this number is not correct? What if the size of Ukraine’s economy is actually considerably different? We do not claim that this is necessarily so, yet there are some oddities and discrepancies in Ukraine’s statistical data that can hardly be explained. This article invites economic experts to discuss and research the issue and find out the real size of Ukraine’s economy.
What is wrong with Ukraine’s GDP?
GDP reflects the size of a country’s economy. It is probably the most important indicator that measures a country’s economic activity and hence influences both its economic policy and its position on the international stage.
For instance, key budget indicators (presented as ratios to GDP) are indispensable for the IMF extended fund facility program and to the budget resolution. The ratio of the public debt to GDP says much about the country’s financial position. In Ukraine, GDP (measured in US dollars) will have an impact on the cost of servicing the debt, as the debt restructuring in 2015 involved the issue of GDP warrants. GDP per capita helps determine the level of a country’s economic development. For instance, based on this indicator (using the purchasing power parity), Ukraine is currently ranked 113th (between Morocco and Guatemala) and is one of the poorest countries in the region.
What does GDP stand for and how is it calculated?
GDP is the value added that is created in an economy, including net taxes on products paid by consumers. To get it, we take all the goods and services produced in the country within a particular period, measure their total value, and then subtract the value of all goods and services that were used to produce them.
In practice, the calculation of GDP is a complex process. Based on the data from statistical surveys and administrative sources, Ukrainian Statistical Agency (Ukrstat) compiles national accounts according to the international standards SNA-2008. In order to take into account the shadow (non-observed) economy, the data are re-evaluated by using the information from sociological surveys, estimates by experts, law enforcement agencies data (see the methodology here and here). Based on the national accounts, GDP is calculated according to three methods: the output one, the income one, and the expenditure one (more details here and here, as well as in the Note below). All the methods have to yield the same number.
Three methods are used to calculate the GDP: the output (production) method, the income method, and the expenditure method.
- According to the types of final expenditures, GDP is equal to the sum of all final consumer expenditures + gross capital investment + trade balance.
- According to the income approach, GDP is calculated as the total amount of all initial incomes: wages + taxes – production and import subsidies + gross profit and mixed income.
- Based on the output approach, GDP is calculated as the sum of gross value added in all types on economic activity and all sectors of an economy including taxes and excluding subsidies on products.
In order to measure GDP using the expenditure method the Statistics Service employs 52 sources of data (26 statistical surveys and 26 sets of administrative data), to measure using the output and income approaches – 19 statistical surveys and 6 sets of administrative data.
The structural business survey (SBS) is one of the data sources for the national accounts. Value added – a key statistical indicator – is calculated both in SBS and in national accounts. And it is here that a huge discrepancy arises.
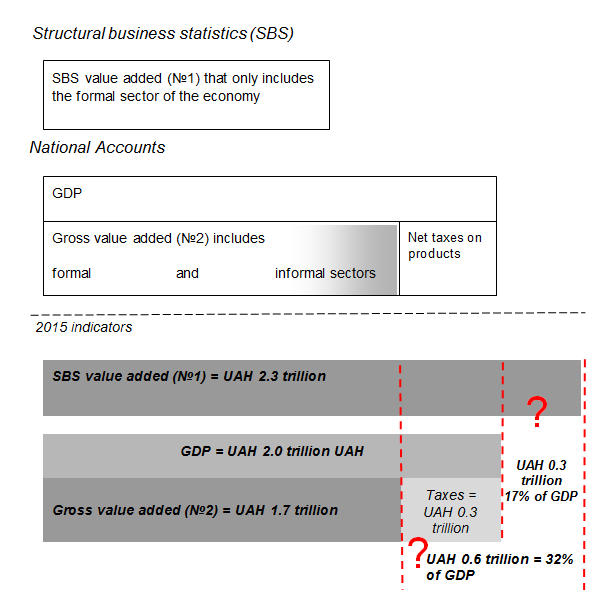
In 2015 (figure 1), the gross value added, according to the Ukrstat, amounted to UAH 1.7 trillion, or 85% of GDP (additional 15% represented by net taxes on products).
Yet, the data from structural business statistics (SBS) survey show that value added amounted to UAH 2.3 trillion. It was actually 0.3 trillion bigger than GDP itself in 2015 (UAH 2 trillion).
It is thus obvious that part of the value added, produced by companies, is not included in the GDP (Figure 1).
Figure 1. Value added indicators in national accounts and the structural business statistics survey
How much of the value added is not included in the GDP? Let us look at the value added statistics in more detail.
In statistics, two value added indicators are calculated using different methodology. The first one is called the value added at factor costs and is calculated based on the data of structural business statistics survey (SBS value added №1). The other one is called gross value added (№2) and is calculated according to the algorithms of the national accounts (see here and here). Though the methodology is different, both indicators reflect almost the same phenomenon.
The calculation of the SBS value added (№1) requires several stages. First, the indicator is measured for each company based on its reports. Next, the indicators are summed up in order to get an integral value added indicator for the economy as a whole, a particular industry or a region.
The methodology for calculating SBS value added (№1) is based on the Regulation (EU) № 295/2008 of the European Parliament and Council (11.03.2008). The methodology is prepared meets the recommendations of the experts of the Central Statistics Bureaus of Latvia within the framework of the project Twinning Light Ukraine “Harmonizing Ukraine’s official statistics with the EU standards”. The Ukrstat has started to publish the SBS value added (№1) only recently, while the data are available for the period starting from 2013.
Gross value added (№2) is also calculated in several stages. First, it is measured as the difference between the output and the intermediary consumption for each type of economic activity and sector. Next, the results are summed up for the economy as a whole.
Gross value added (№2) is calculated according to the methods (here and here), developed on the basis of the system of national accounts (SNA-93), European system of national and regional accounts (ESA-95), and the updated standards SNA-2008 and ESA-2010. The Ukrstat web site has provided gross value added (№2) data since 2001.
The gross value added (№2) indicator should measure the economic activity covered by regular statistical surveys, as well as the non-observed economy. To cut it short, the indicator should capture both the formal and shadow economy.
In other words, gross value added (№2) includes value added (№1), reflected in the structural business survey, as well as value added produced in the informal economy (Figure 1).
It is thus no surprise that these two indicators cannot be equal in a country with large informal economy. Considering this factor, the gross value added (№2) should be larger as it accounts for the informal economy. However, according to the Ukrstat, this indicator is significantly smaller (by UAH 640 billion in 2015) than the value added by companies (№1) (Figure 2).
Figure 2. Value added indicators in Ukraine’s statistics
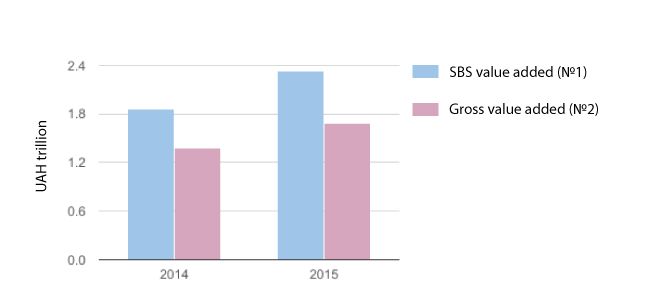
Source: Ukrstat
European statistical services explain the gaps between the value added indicators in the two data sources by pointing at different approaches to the accounting of several components. First, gross value added includes the estimates of the shadow economy. Second, since SBS value added (№1) is calculated in factor costs and gross value added (№2) in producer prices, №1 includes net subsidies on production while №2 includes net taxes on production. The difference can partially be explained by the specifics of property income accounting, current transfers, or capital gains and losses. However, as we show below, almost in all the countries, unlike in Ukraine, the difference between SBS value added (№1) and gross value added (№2) is insignificant or, otherwise, gross value added (№2) is actually larger than SBS value added (№1).
Ukrainian way
What about value added measurement in other countries? The Eurostat website publishes industrial value added: in all the EU countries, the SBS value added (№1) is smaller or almost equal to the gross value added (№2) (Figure 3). In Ukraine, everything is upside down. In 2015, the SBS value added was twice as large as the gross value added.
Figure 3. Industrial value added in the EU countries: the ratio of SBS value added (№1) to the gross value added (№2), times.
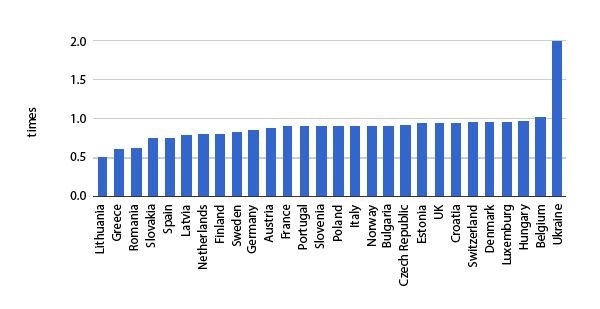
Source: Eurostat, Ukrstat
Importantly, in 2014 and 2015, the SBS value added (№1) was larger than the GDP (Figure 4). This means that, in 2014 and 2015, the GDP did not include UAH 187 billion and UAH 233 billion of SBS value added correspondingly. The SBS value added that is not included in the GDP amounts to about 17% of GDP (Figure 1).
Figure 4. GDP and SBS value added in Ukraine’s statistics
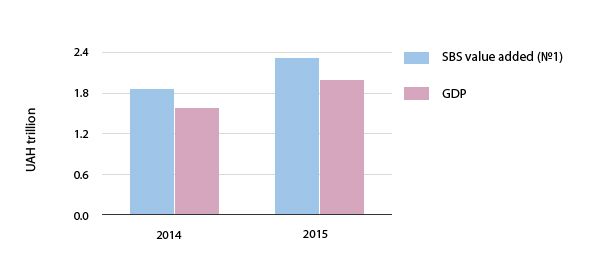
Source: Ukrstat
It is too early to make any conclusions as to the credibility of the Ukrstat calculations. However, it needs to be explained
- Why the gross value added (№2) is considerably smaller than the SBS value added (№1)?
The difference between the indicators in 2014 was equal to UAH 484 billion (31% of GDP), while in 2015 it was equal to UAH 640 billion (32% of GDP)
- Why is a part of SBS value added (№1) not included in the GDP?
In 2014, SBS value added was higher than the GDP by UAH 187 billion, while in 2015 it was higher by UAH 233 billion, which accounts to 17% of GDP.
At this point, we can only claim that the GDP probably does not include part of the value added that is created in the economy. If it is really so, it may turn out that Ukraine’s GDP is underestimated. The underestimation of the country’s GDP influences the efficiency of its economic policy.
This issue is one of the challenges that the new leadership of the Ukrstat faces on the eve of releasing the annual GDP estimates.
VoxUkraine is ready to take part in the research and help find answers to the questions we raise in this article.

Attention
The author doesn`t work for, consult to, own shares in or receive funding from any company or organization that would benefit from this article, and have no relevant affiliations