Obesity is a growing public health and economic concern in Ukraine. This article uses the 2019 WHO STEPS survey and explores the relationship between obesity and different socioeconomic factors – first and foremost, the type of residency: rural vs urban. The findings reveal that rural dwellers are more prone to obesity. But, as suggested, awareness campaigns, preventive measures, and improved healthcare access can remedy the problem.
Why does obesity matter?
For many, obesity may not seem as harmful as other public health issues, but it actually is. The Ministry of Health reports that almost 60% of adults in Ukraine are overweight, with nearly 25% of them being obese (WHO STEPS 2019). The rate is among the highest in Eastern Europe.
Obesity has devastating health consequences, ranging from cancer to mental health disorders. In terms of numbers, overweight and obesity are responsible for about USD 1 trillion in annual healthcare costs worldwide (Diamantis et al. 2022). The breakdown of these costs is shown in Figure 1.
Figure 1. Breakdown of the economic costs of obesity
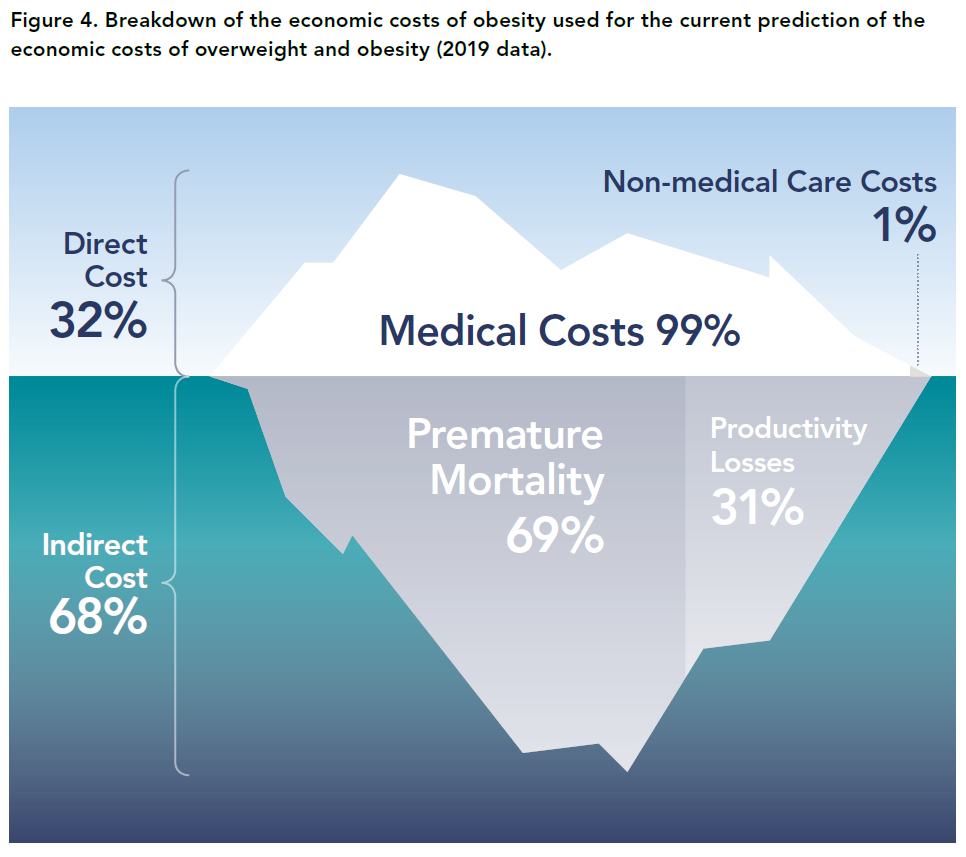
Source: World Obesity Federation: The Economic Impact of Overweight & Obesity in 2020 and 2060.
Why is the urban/rural divide important?
Since social resources are limited, we need to tackle each problem in the most efficient way. Therefore, we need to identify population groups at higher risks of obesity and related problems and address them in the first place. We hypothesize that rural residents constitute such a group as they are more prone to obesity compared to urban dwellers. This hypothesis is supported by evidence from both Europe and the US. Thus, rural residents had 35.8% greater odds of obesity than urban residents in the US (Wen et al., 2018) and 32% greater odds in Poland (Stos et al., 2022). Testing this hypothesis, we obtained similar results: 24.6% lower odds of obesity for urban residents.
Note that odds and probability are not the same. Probability says how often something happens (e.g., 25% chance). Odds is the ratio of happening vs. not happening (e.g., 1/3 odds). In this article, we report probabilities for easier interpretation.
Data and method
The data source for this article is the WHO STEPS survey on non-communicable diseases, conducted in Ukraine in 2019. The target population was male and female Ukrainians aged 18 to 69 years, from both urban and rural areas, residing in the country. A total of 4,409 respondents participated in the face-to-face survey, the sample was representative for government-controlled areas. Respondents answered a number of questions on their health, lifestyle and demography, and their blood sugar and cholesterol were measured with Cardiocheck Plus devices.
Our dependent variable is obesity: a person was considered obese if their Body Mass Index (BMI, calculated as weight/height²) was 30 kg/m² or higher. It is worth noting that other alternatives to BMI – such as Waist Circumference (WC), Waist-to-Hip Ratio (WHR), and Waist-to-Height Ratio (WHtR) – were also evaluated. However, since these measures are strongly correlated, we opted to use BMI, as it is more standard and allows for comparisons with other similar studies.
We estimate the impact on this binary variable (obese=1) of socioeconomic variables – from basic factors like gender and age to more detailed measures such as fruit, vegetable, and processed food consumption. To do this, we apply various specifications and econometric methods: linear LPM and non-linear Logit. All the models (i.e., all combinations of specifications and methods) tell the same consistent story. Therefore, to save time and space, we present the results of only one of them.
Alternative obesity measures
In this study, we use body mass index (ratio of weight/height²) as recommended by WHO (2022).
BMI as a measure of obesity has been criticized because it does not indicate the distribution of the adipose tissue in the abdominal area. For this purpose, alternative indicators such as waist circumference (WC), waist-to-hip ratio (WHR), and waist-to-height ratio (WHtR) may be more accurate. Of these three measures, WHtR is the best because it uses two measures and because it has greater predictive power with respect to diseases related to obesity (Traczyk et al 2023).
We found a strong positive relationship: higher WHtR aligns with higher BMI, as shown in the diagram. 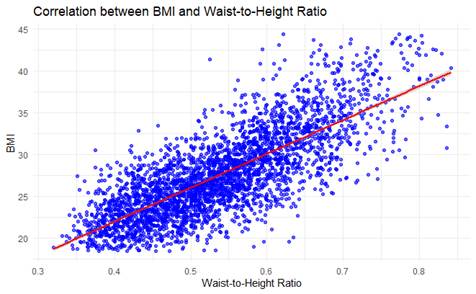
Since we do not lose any accuracy, we’ve decided to stick with BMI – it is more standard and allows for comparison with other similar studies, placing our findings within a broader research context and yielding more valuable insights.
What determines obesity? Estimation results
We find that living in an urban area reduces the probability of obesity by 4.3 p.p. compared to rural residents (figure 2). Gender, age and smoking also significantly impact the probability of being obese. Other variables, including eating processed food, turned out to be insignificant (see Annex).
Figure 2. Significant regression coefficients (dots show mean, lines — +/- standard deviation)
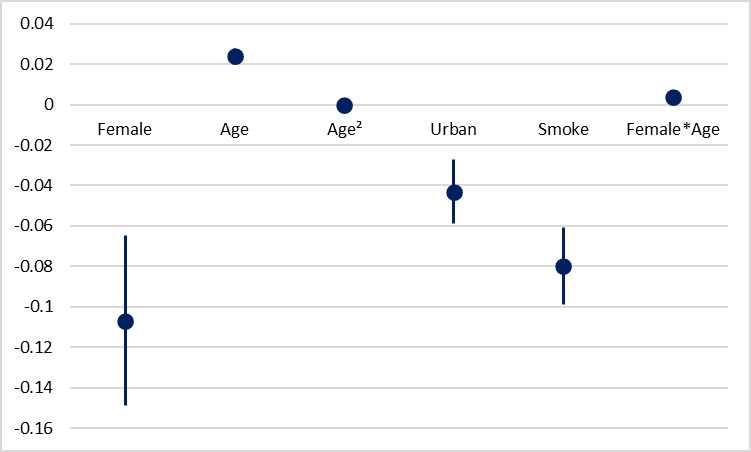
Note: complete model, with all the coefficients, is shown in the Annex
We include both age and age squared into the regression equation to account for non-linearity of age effect. We also include the interaction term Female*Age to capture the possibility that the effect of gender on obesity may become more pronounced with age.
Indeed, one additional year of age increases the obesity risk by 2.4 p.p. but the effect diminishes at older ages. Thus, for example, for a 30-year-old male an additional year increases the probability of obesity by 1.2 p.p., while for a 50-year-old male this probability increases by only 0.4 p.p. A turning point for men is 60 years: after that each additional year decreases the probability of obesity.
For females obesity risk is higher: thus, for a 30-year-old woman an additional year would increase obesity risk by 1.6 p.p., and for a 50-year-old woman – by 0.8 p.p. A turning point for women in 70 years.
Note that we don’t analyze Female coefficient alone because due to inclusion of Female*Age variable, it becomes just a baseline shift (a coefficient of being female at age 0). We must interpret gender differences only in combination with age.
Finally, smokers are 8.0 p.p. Less likely to be obese, probably due to appetite-suppressing effect of nicotine.
Figure 3. Determinants of obesity for rural dwellers (only significant variables)
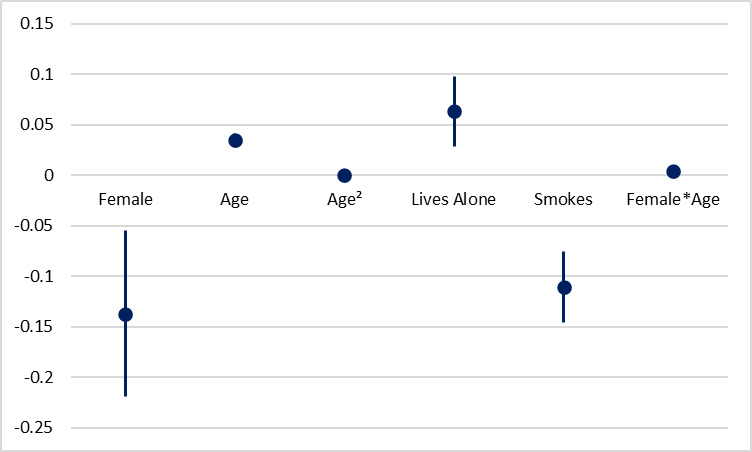
Estimation results only for rural dwellers are similar to results for the entire sample, but the value of the coefficients is higher. For example, an additional year of age increases the probability of obesity by 2.4 p.p. in the total sample and by 3.5 p.p. in the rural sample. Turning points for age in the rural sample are 58 years for men and 65 years for women. Women start with a lower obesity risk (the baseline effect of being Female (when Age = 0) is -0.137), but it increases more rapidly with age (Female*Age is positive and significant).
An interesting finding is that Lives Alone becomes significant: rural individuals who live alone have a 6.3 percentage point higher obesity risk, which is substantial. This could be because rural individuals living alone are less likely to seek preventive medical care, either due to lower healthcare availability or reduced motivation. As a result, obesity-related risks may remain unaddressed for longer periods, as there may be no one to encourage or motivate these individuals.
What can we do about rural obesity?
We propose a simple framework. First, we need to admit the problem and raise awareness about it, with campaigns tailored to the rural context. The message can be delivered by local authorities and trusted leaders (e.g., teachers, doctors, religious figures) for better reach. We can also focus on public events and community workshops rather than internet-based campaigns in areas with digital gaps.
Since the best treatment for the disease is its prevention, we suggest several measures to treat obesity. First, teachers should encourage healthy habits in students. Second, family doctors in rural areas should be trained to track obesity issues and integrate nutrition counselling into routine visits. Third, local authorities should invest in infrastructure like sporting grounds, bike lanes, walking paths, and community centers that offer some physical activity, e.g. dancing.
However, even with the best preventive measures, people will still face obesity. In such cases, access to treatment is essential. Solutions include mobile clinics for remote areas and telehealth services, while advanced care can be provided by specialized centers.
Figure 4. DocGo, a New York-based mobile medical services company

Source: Sarah Jane Tribble / KFF Health News
References
- Diamantis, D. V., K. Karatzi, P. Kantaras, S. Liatis, V. Iotova, Y. Bazdraska, T. Tankova, G. Cardon, K. Wikström, I. Rurik, E. Antal, A. M. Ayala-Marín, N. G. Legarre, K. Makrilakis, and Y. Manios. 2022. “Prevalence and Socioeconomic Correlates of Adult Obesity in Europe: The Feel4Diabetes Study.” International Journal of Environmental Research and Public Health 19, no. 19 (October): 12572.
- Okunogbe, A., R. Nugent, G. Spencer, J. Powis, J. Ralston, and J. Wilding. 2022. “Economic Impacts of Overweight and Obesity: Current and Future Estimates for 161 Countries.” BMJ Global Health 7 (April): e009773.
- Stival, C., A. Lugo, A. Odone, P. A. van den Brandt, E. Fernandez, O. Tigova, J. B. Soriano, M. José López, S. Scaglioni, and S. Gallus. TackSHS Project Investigators. 2022. “Prevalence and Correlates of Overweight and Obesity in 12 European Countries in 2017–2018.” Obesity Facts 15, no. 5: 655–665.
- Stoś, K., E. Rychlik, A. Woźniak, M. Ołtarzewski, M. Jankowski, M. Gujski, and G. Juszczyk. 2022. “Prevalence and Sociodemographic Factors Associated with Overweight and Obesity Among Adults in Poland: A 2019/2020 Nationwide Cross-Sectional Survey.” International Journal of Environmental Research and Public Health 19, no. 3 (January): 1502.
- Traczyk, I., A. Kucharska, B. I. Sińska, M. Panczyk, L. Wronka, F. Raciborski, D. Szostak-Węgierek, and B. Samoliński. 2023. “Every Second Adult Inhabitant of Poland (Aged 18–64) is Overweight—Results of Representative Cross-Sectional Studies Conducted in 2017–2020.” Annals of Agricultural and Environmental Medicine 30, no. 2 (June): 322–330.
- World Health Organization. Regional Office for Europe. 2020. Risk Factors for Noncommunicable Diseases in Ukraine in 2019..
- Zatońska, K., P. Psikus, A. Basiak-Rasała, Z. Stępnicka, D. Gaweł-Dąbrowska, M. Wołyniec, J. Gibka, A. Szuba, and K. Połtyn-Zaradna. 2021. “Obesity and Chosen Non-Communicable Diseases in PURE Poland Cohort Study.” International Journal of Environmental Research and Public Health 18, no. 5 (March): 2701.
- Bloomberg News. “Novo Nordisk Overtakes SAP as Europe’s Most Valuable Company.” Bloomberg, June 13, 2025.
Annex. Estimation results
Table 1. Complete sample
| Independent Variable | Type and Coding/Categorization | LPM Coefficient and Robust Standard Error |
| Significant Coefficients | ||
| Female | Binary, 1 = Female, 0 = Male | -0.107** (0.042) |
| Age | Continuous, measured in years | 0.024*** (0.004) |
| Age² | Quadratic term | -0.0002*** (0.00004) |
| Urban | Binary, 1 = Urban, 0 = Rural | -0.043*** (0.016) |
| Smoke | Binary, 1 = Smoker (tobacco products), 0 = Non-smoker | -0.080*** (0.019) |
| Female*Age | Interaction term | 0.004*** (0.001) |
| Insignificant Coefficients | ||
| Years of Schooling | Continuous, measured in years | -0.006 (0.004) |
| Economically Active* | Binary, 1 = Economically active, 0 = Economically inactive | -0.004 (0.019) |
| Lives Alone | Binary, 1 = Lives alone, 0 = Lives with others | 0.027 (0.019) |
| Household Earnings | Continuous, measured in hryvnias/month | 0.005 (0.017) |
| Alcohol Consumption | Continuous, measured in standard alcoholic drinks/month | -0.006 (0.010) |
| Eating Fruits and Vegetables | Binary, 1 = Sufficient (≥ 5 servings/day acc. to WHO recommendations), 0 = Insufficient | -0.014 (0.016) |
| Eating Processed Food – Often | Categorical, 5 categories: “Always” (reference), “Often”, “Sometimes”, “Rarely”, “Never” | -0.050 (0.045) |
| Eating Processed Food – Sometimes | -0.060 (0.045) | |
| Eating Processed Food – Rarely | -0.072 (0.045) | |
| Eating Processed Food – Never | -0.003 (0.050) | |
| Mental Health – Moderate** | Categorical, 3 categories: “Good” (reference), “Moderate”, “Poor” | 0.020 (0.018) |
| Mental Health – Poor | 0.013 (0.025) | |
| Observations | 3354 | |
| R² | 0.092 | |
| Adjusted R² | 0.087 | |
| Residual Std. Error | 0.428 (df = 3335) | |
| F Statistic | 18.793*** (df = 18; 3335) | |
Source: author’s calculations based on the 2019 WHO STEPS survey
*Following ILO recommendations, individuals classified as economically active (1) include employees of governmental or non-governmental organizations, private enterprises, and those who are self-employed or private entrepreneurs. All others are considered economically inactive (0)
**Categorized based on responses to three questions about depression symptoms over the past 12 months: (1) Were you feeling sad or depressed for several days? (2) Were you losing interest in most pleasurable activities? (3) Were you experiencing fatigue or low energy for several days? If a person answered “Yes” to all three questions, her mental health was estimated as poor, if all the answers were “No”, as good, and moderate mental health corresponds to a mixture of “yes” and “no” answers. This follows the WHO SAGE methodology.
Table 2. Rural subset analysis
| Independent Variable | LPM Coefficient and Robust Standard Error |
| Female | -0.137** (0.082) |
| Age | 0.035*** (0.006) |
| Economically Active | 0.018 (0.035) |
| Lives Alone | 0.063* (0.035) |
| Smokes | -0.111*** (0.035) |
| Age² | -0.0003*** (0.0001) |
| Female * Age | 0.004** (0.002) |
| Observations | 1,144 |
| R² | 0.096 |
| Adjusted R² | 0.083 |
| Residual Std. Error | 0.446 (df = 1126) |
| F Statistic | 7.059*** (df = 17; 1126) |
Source: author’s calculations based on the 2019 WHO STEPS survey
Photo: depositphotos.com/ua
Attention
The author doesn`t work for, consult to, own shares in or receive funding from any company or organization that would benefit from this article, and have no relevant affiliations