The European Bank of Reconstruction and Development (EBRD) has produced a large-scale “Transition Report 2016-2017”, which considers in detail how the transition to a market economy has affected the welfare, life satisfaction and even the height of the population of transition countries. In Ukraine, the report was presented by Sergey Guriev, the EBRD’s Chief Economist. VoxUkraine has recorded his lecture that took place on November 23, 2016, at Kyiv School of Economics
This is the first Transition Report that studies the issues of inequality and inclusion. Previously, we always looked at national averages, at GDP growth, investment, sometimes at sectoral variables. But as you know, it’s not only in our countries of operation, but also in the West, that issues of inequality and inclusion have become prominent and important. Some people attribute the rise of populism in certain Western countries to the fact that the past twenty years of growth and reforms, globalization and technological progress have benefited only some parts of the population. People that were left behind voted for populist politicians. So this is why, a year ago, we decided to write about inequality and inclusion. Another reason is that, unfortunately, our countries were pioneers in the growth of populism.
The main question we look at is how individuals, rather than countries, have benefited from the transition. We start with studying the evolution of incomes. We also look at subjective perceptions of life satisfaction, as well as physical indicators of well-being. We analyze the inequality of opportunity and financial inclusion. After all, we are a bank and we care about the provision of financial services. This data set, called the Life in Transition Survey, is unique. This is the third round of the Survey. The first one was done in 2006, the second in 2010. This round is fresh; it’s still not on the Bank’s website but will be there in a few weeks (published on November 29). I see a lot of faculty and students here, so I would like to encourage you to use the data set. It is very rich and was run in a larger number of countries than in previous rounds, this time 34 countries. We covered 29 post-communist countries, as well as five countries without communist legacy, such as Germany, Italy, Turkey, Greece, and Cyprus. We also ran it in the same locations as in 2010, so you will be able to compare the changes in attitudes, beliefs, and living standards in the primary sample countries. We surveyed about 51,000 households.
The report has four chapters and I’ll try to cover at least three of them. The first one is about the developments in inequality, changes in incomes of various deciles of income distribution. The second one is about the impact of the transition in the past 25-27 years on the subjective and objective well-being of people. The third one is about the inequality of opportunity in our region and the fourth one is about financial inclusion.
Individuals’ Incomes and Rise of Populists in the World
Let us look at some numbers from the Report. One number, which is not very optimistic but very important, is provided by the answers to the following question. Starting from 1989, from the beginning of transition, how many people have seen their incomes grow faster than incomes of residents of rich countries? How many people have seen the gap between them and the rich countries close at least partially? The answer is that only a minority could see the difference get smaller. Unfortunately, in our countries, which on average have done well, the median resident has not seen the gap with the rich countries disappear or even diminish. And there is also a very high concentration of wealth at the top. Our region is unique in a sense that, in our countries, the majority of wealth of the super-rich people is coming from the commodities and natural resources.
I’ll start with a graph, which is not from our region, the so-called Milanovic’s elephant graph.
Chart 1.1
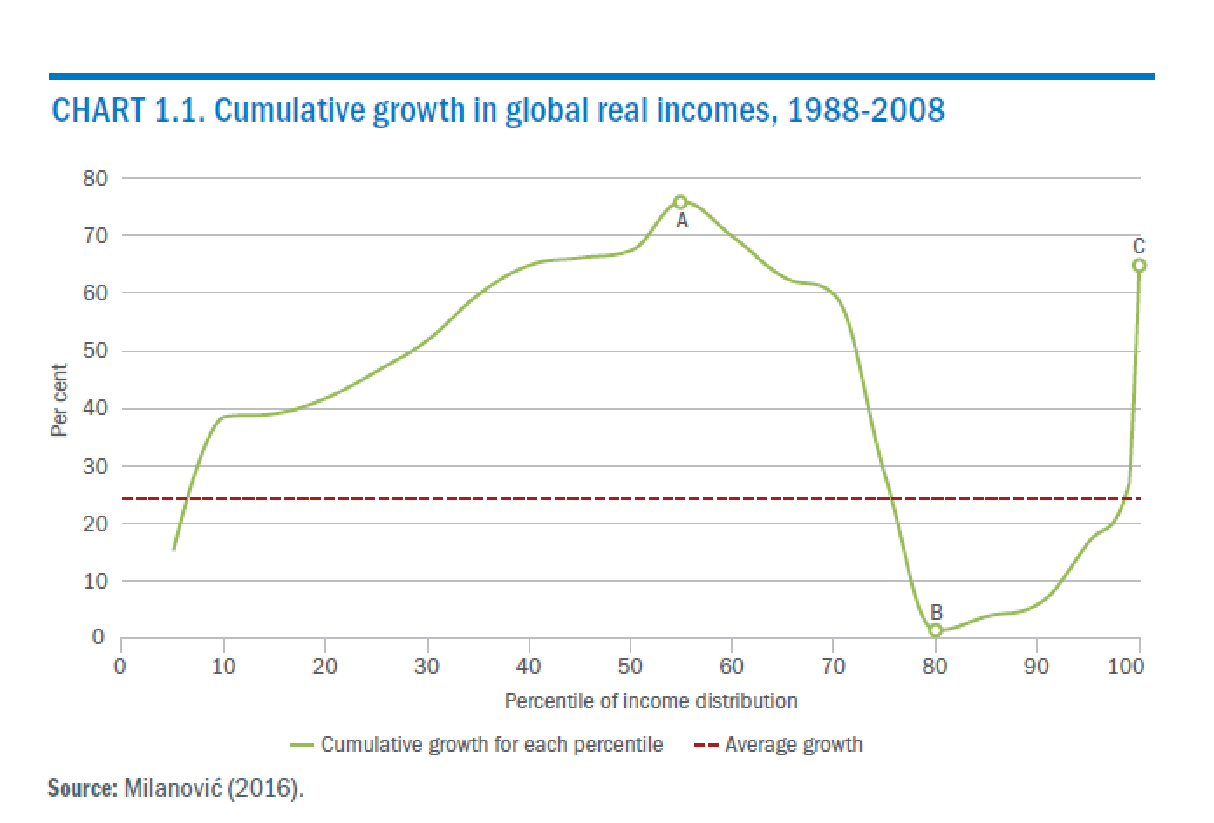
If you look at it, you can see the elephant with the trunk being point C and the head being point A. What does this elephant stand for? It tells you the exact story of the lack of inclusion in the global growth. First, look at the global distribution of income, say, at top one percent of global citizens, or at a median global citizen, or at the poorest global citizen. And then ask a question, in twenty years from 1988 to 2008, what was the growth rate of income in that particular segment of the global income distribution? You see that the top one percent of global citizens have benefited. Then the bottom ten percent have also seen positive growth of income, which was less than the average global growth, but still positive. The global middle class benefited the most. These are the middle and upper classes of China and India. They have actually seen huge benefits of growth and indeed, when we look at the poor countries in general, we understand why we observe such a huge decline in global poverty. It is now at about 10% of global population while in the early eighties it was about 40%. But we also see that the lower middle class in the West (around point B in the graph) has not benefitted. For these people, real income has barely grown. It is thus not surprising that many people from that part of global distribution actually vote for populist politicians and reject the system.
Income Changes in Our Region
What happens when we redo this graph for our region? What will be the shape of the graph? It is different but it does look like an elephant a little bit (Chart 1.9 below). We also see people at the very top; they are the most educated, in better position to benefit from the market economy. Unfortunately, in some countries they are also better connected individuals. We also see people in bottom part. These are residents of very poor countries. And, of course, if you live in a very poor country, like a Central Asian country, the law of conditional convergence tells you that if you are very poor it is easier for you to grow. It is thus not surprising that Central Asian countries are growing faster than Central European countries. These are people who experience above average growth in income.
Chart 1.9
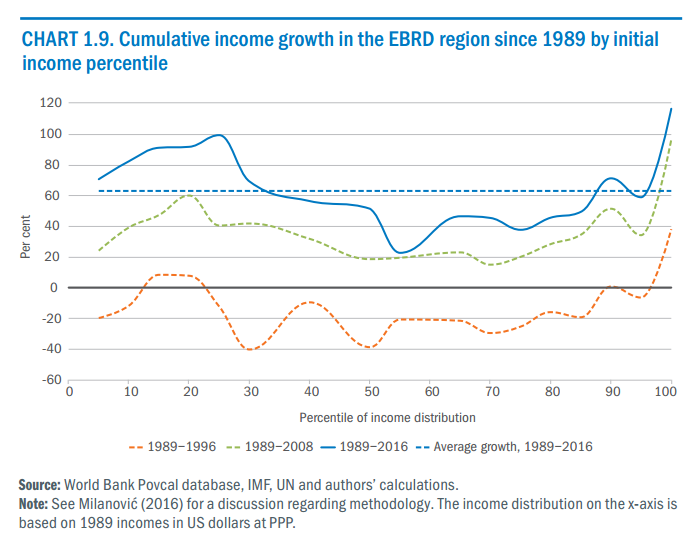
Then you have the middle, which grows somewhat less. If we look at this elephant at the beginning of reforms and the end of reforms, you see that in the first several years of transition almost everybody had experienced negative income growth, except for the top 5%. If you go back in time to mid-1990 and ask: “How many people in our region have benefited from the early years of reforms?” the answer will be the top 5%. It does not have to be this way. If you look at graphs like this for, say Brazil or Chile, they will be very different. You may have a graph when the poor have benefited more than the rich. But in our case, it was the other way round.
Chart 1.3 is a typical graph for a country from this region, Russia, where you see that top 10% have benefited most. Everybody else has benefited less so, while the bottom 10% had actually experienced a negative growth. The same happened in the first years of reforms. In the past 20 years, the distribution barely changed. The graph for the US would actually look similarly. If you go to the website of the Transition Report, you will be able to see the graph for each country in the world.
Chart 1.3
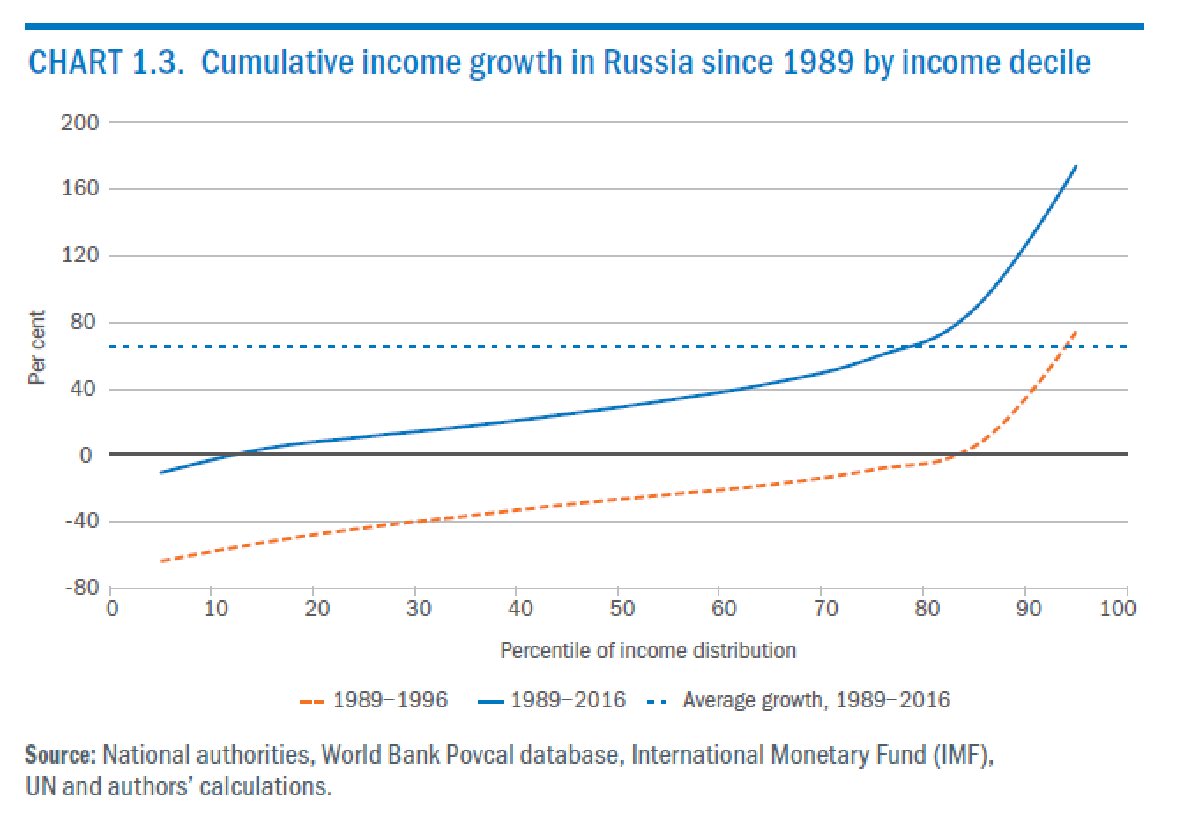
But this is a typical graph, which tells you that on average Russia has done quite well – 70% growth over 27 years. But this growth does not actually tell you the experience of the bottom 80%. So if you ask in Russia: “OK, the GDP has on average grown by 70%, so how many of you have seen 70% growth in your pocket?” The answer will be the top 20%. The bottom 80% have not seen this growth.
The Ukrainian “Disaster”
As I promised, the next graph is more depressing. This is a graph for Ukraine.
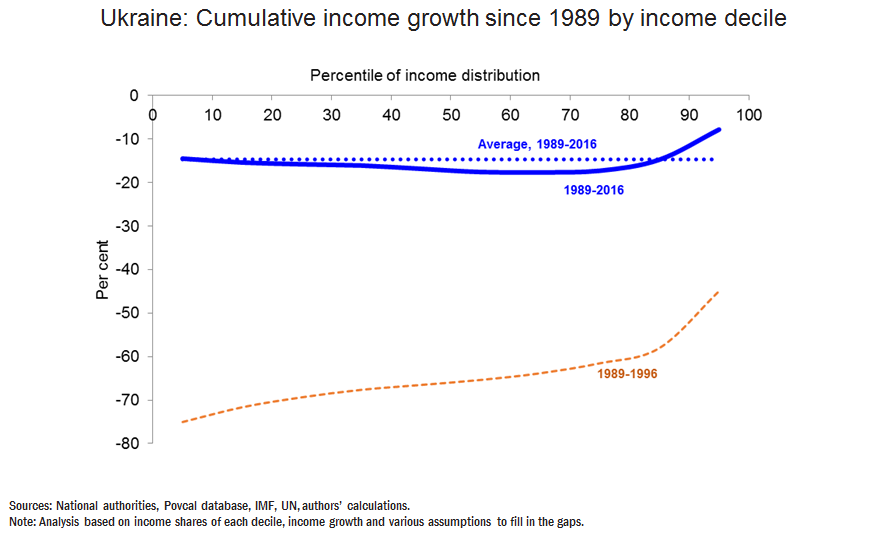
It is quite scary, right? You do not see that much of increasing inequality but everybody reported negative growth. This graph tells you that in Ukraine you cannot actually find people in numbers large enough to say that their incomes are now higher than at the beginning of transition. There are some very rich people in Ukraine, but they are not part of our household survey. I will talk about them later. This is a depressing graph but I would say that for our countries the graph for Russia is more typical than the graph for Ukraine.
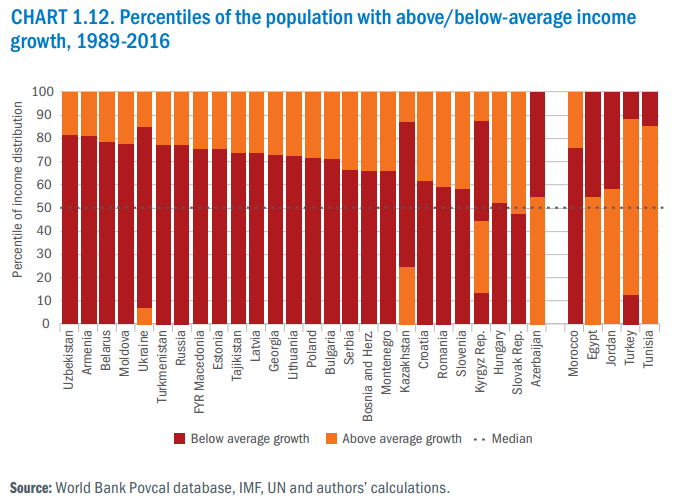
We actually go country by country and this here is a summary of what has happened (Chart 1.12). Here, in red we show the people whose income growth was below average and in yellow those whose income growth was above average. In Ukraine, “above average”, unfortunately, does not mean positive numbers because the average is still negative. But at least, if you ask who benefited more on average from those reforms, usually in most countries, these are the top 20-30%.
Chart 1.12
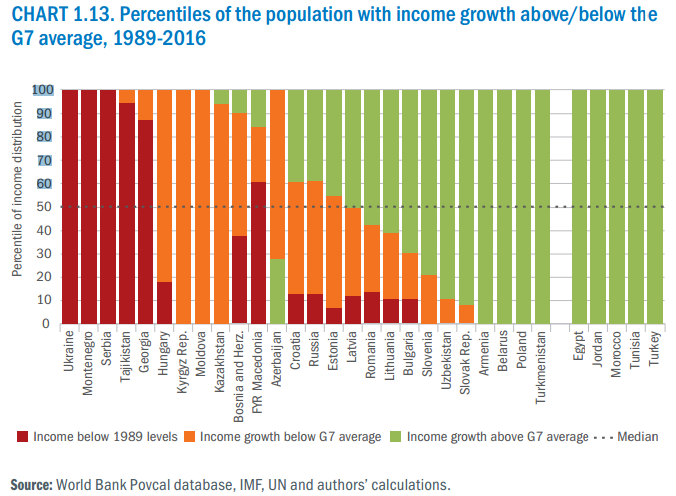
This is a scary graph. But there is a scarier one (Chart 1.13). It is about catching up with the developed countries. We have three colors here. The green means that your income has been growing faster than the average income in G7 countries. The yellow means it was growing slower than that of G7. The red color means it was not growing, it was actually falling and that is the story about Ukraine – all the ten income deciles report negative average growth. In some countries, you have only yellow and red, in some you have three colors, and this here (Bosnia and Herzegovina) is a typical country, where you have top guys closing the gap, the middle guys growing but not closing the gap, and the bottom guys actually falling.
Chart 1.13
In Russia, the bottom 10% have negative growth. The ones that are actually catching up are the top 40%, while the middle 50% grow but not as fast as in rich countries. There are also poorer countries where everyone or almost everyone had positive growth and was catching up. Finally, Belarus and Poland stand out. These are the countries that started with roughly the same income per capita as Ukraine – and yet in these countries everyone has decreased the gap with the rich countries. You have our new countries of operation that indeed universally closed the gap with the rich.
When you ask people about inequality, it turns out that people still feel very strongly about it. Just to give you a picture in terms of change in the last five years, you see that people still see that inequality is going up.
If you look at the [Milovanovic’s] graph for Ukraine, it shows that inequality in Ukraine probably decreased from 1996 to 2016. Inequality in Russia did not change in the last 20 years. But if you ask people, “Do you think inequality has increased or decreased in the last 5 years?” the majority in all countries by Tajikistan would say that inequality has increased (Chart 1.15). Along the horizontal axes, we plot a change in the official Gini coefficient. The countries on the left are the ones where Gini coefficient went down.
Chart 1.15
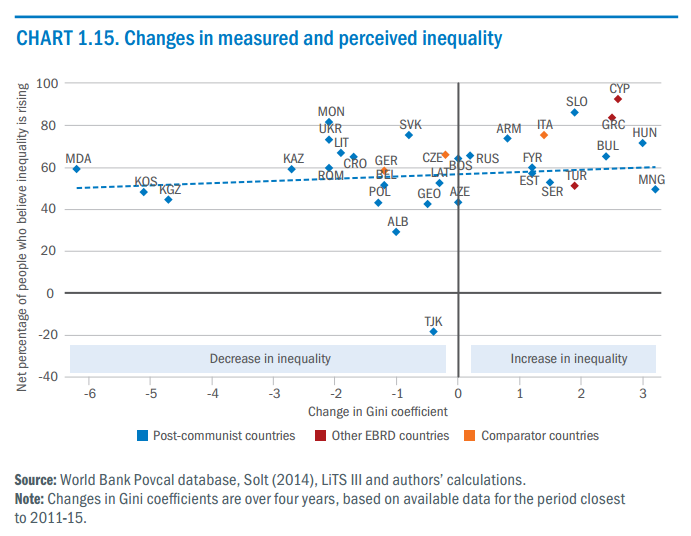
In countries on the right, the officially measured inequality went up. We see that half of the countries is on the left and half of the countries is on the right, yet all are above the horizontal axes and in any case, according to official data, increase in inequality has been very small. But people still think that inequality has been going up recently.
This may be explained by the fact that official data (as well as our survey) do not capture neither the very rich nor the very poor. But people see the homeless in the street and the billionaires on TV screens and understand that inequality may actually be higher than reported by statistics.
A Billionaire Story
Chart 1.17, 1.18
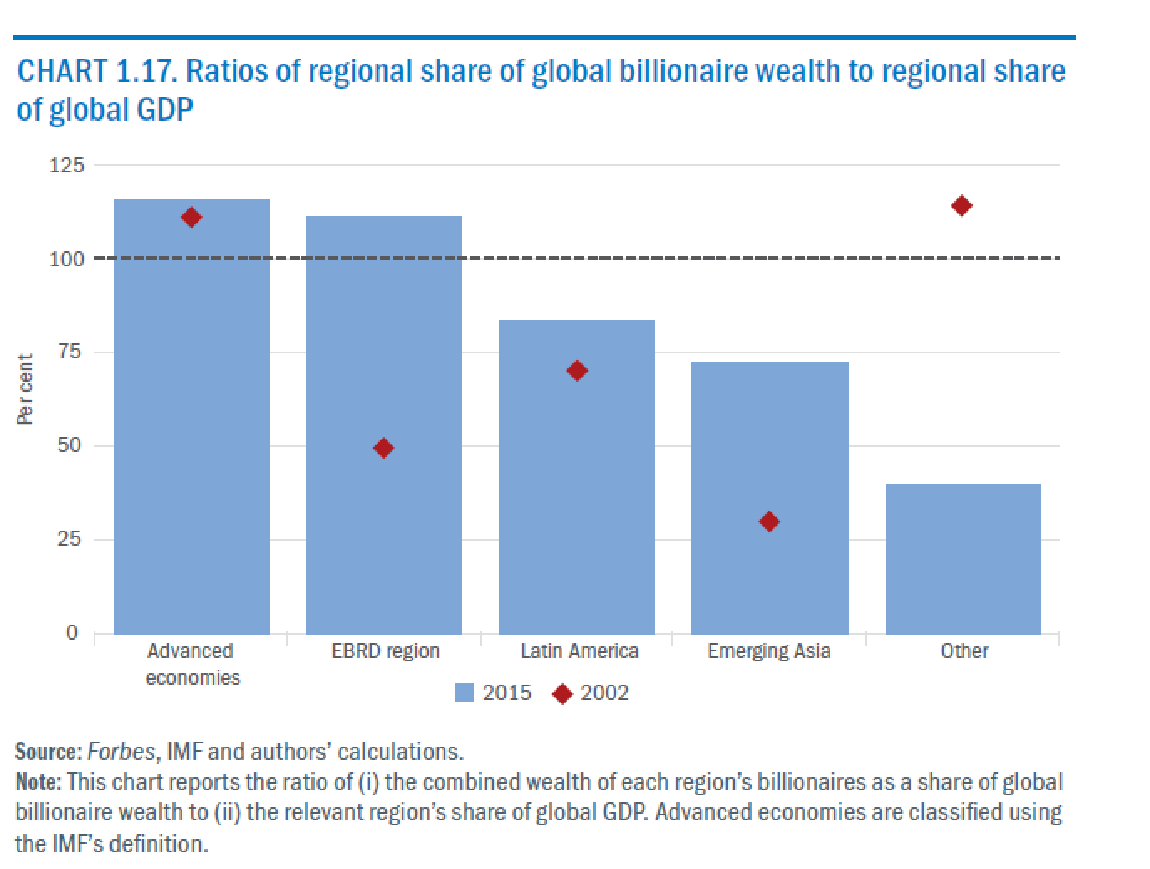
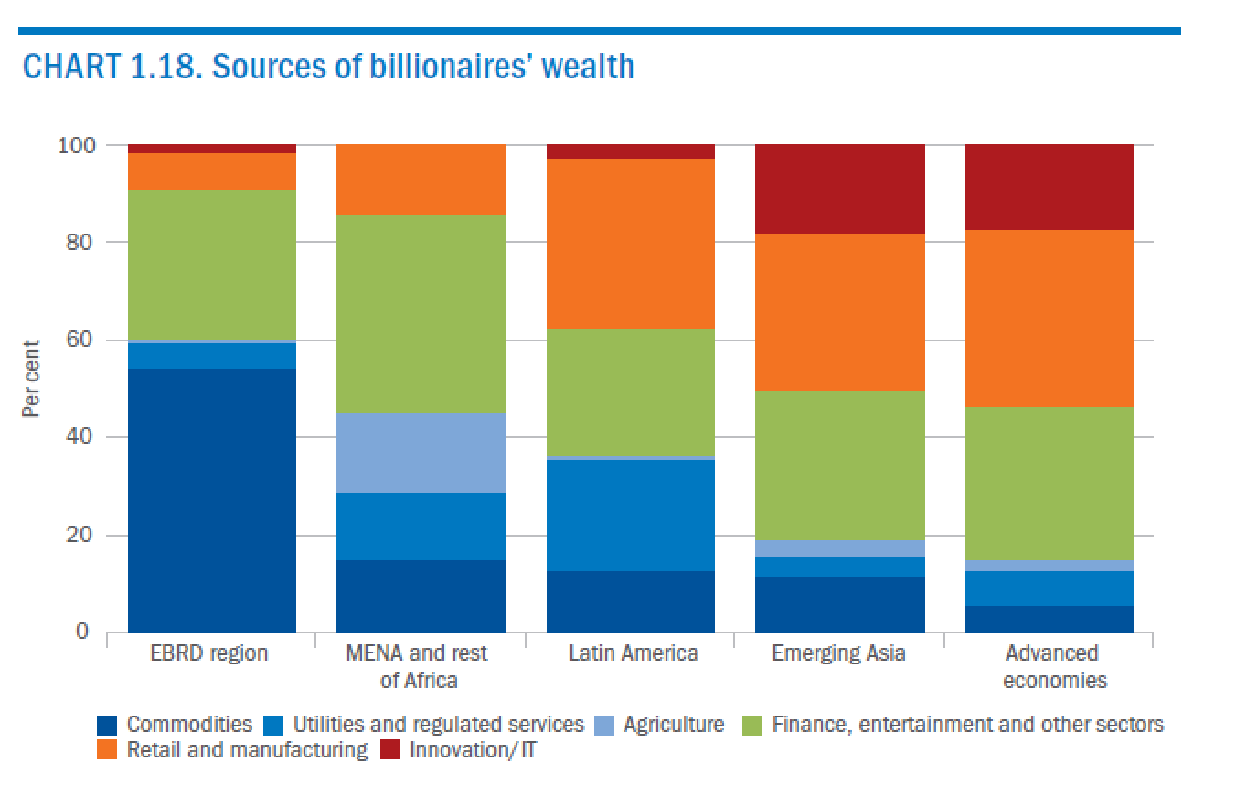
Blue bars (Chart 1.17) show you the share of global billionaire wealth in our region relative to the share of the region in the global GDP. Therefore, if the bar is above 100%, it has dispropportionally many super-rich people. The only two regions above 100% are the developed countries and our region. All other developing countries produce less billionaires than their share of global GDP. This is not something that happened right away. In 2002, we were still much behind.
This chart is not that scary compared to the next one (Chart 1.18). Here the question is: “Where did the super-rich people make the money?” Finance is important in all regions, yet the share of commodities is much larger in our region than in others, and retail and manufacturing is much smaller. The majority of wealth in our region is made thanks to natural recourses than commodities. And Russia and Ukraine are responsible for a major part of this.
Why is this unique? In principle, you have exporters of natural resources everywhere, including the USA. The US is now producing as much oil and gas as Russia, and as much oil as Saudi Arabia. But apparently, other countries manage to tax the rents from natural resources.
What follows from this? The Report contains much more details about policy recommendations. You have to separate three problems. One is poverty. Most of our countries are middle-income. As we are now in Ukraine, let me focus on two other things, inequality and wealth concentration at the top. These are different things. Inequality may be addressed in two different ways. Redistribution attacks the inequality of income and predistribution attacks the inequality of opportunity. Later on, I will show you something about inequality of opportunity in our region.
The other problem is the concentration of wealth at the top. Why is the concentration of wealth important? If you don`t have strong institutions of governance, you run the risk of the super-rich having disproportionate influence on media and politics and changing the rules of the game in their favor – therefore becoming even richer and protecting their wealth even better. This raises the question of fairness and people think that inequality is too high because they observe the superrich being too influential. They also think that the super-rich that got their money from natural recourses have not earned it. Therefore, they support taxes on inheritance and rents. Both Francis Malige, EBRD MD for Eastern Europe and the Caucasus and I spend time in France; there is a big debate after Professor Piketty has suggested that wealth taxes should be much higher. He actually is not advocating inheritance taxes because he believes it is not practical. The rich are so powerful that they will be able to go around inheritance taxes. If not for that economists would, of course, support inheritance taxes as these are fair and non-distortionary.
The Impact of Transition on Well-being
Let us look at how transition affected wellbeing, rather than income. What I showed you before is a comparison of today’s income to the income in 1989. I see a lot of young people here, so let me explain. At that time, it was not only important how many roubles you got. The question was rather whether you could actually spend those roubles. Everybody was getting pretty much the same salary in roubles. Yet some people were better-connected and could buy sausages, while other people were less connected and could only buy seaweed salad. This is why we look at other indicators. Here we look at the height and at subjective well-being or life satisfaction. Why do we look at height? In development economics, it is known that if you grow up in more difficult circumstances, your height is lower. And it is actually now that those people who faced transition in their early years, when they were 0, 1 or 2 years old, which is the most critical time for determining the adult height, have actually grown up.
Chart 2.3
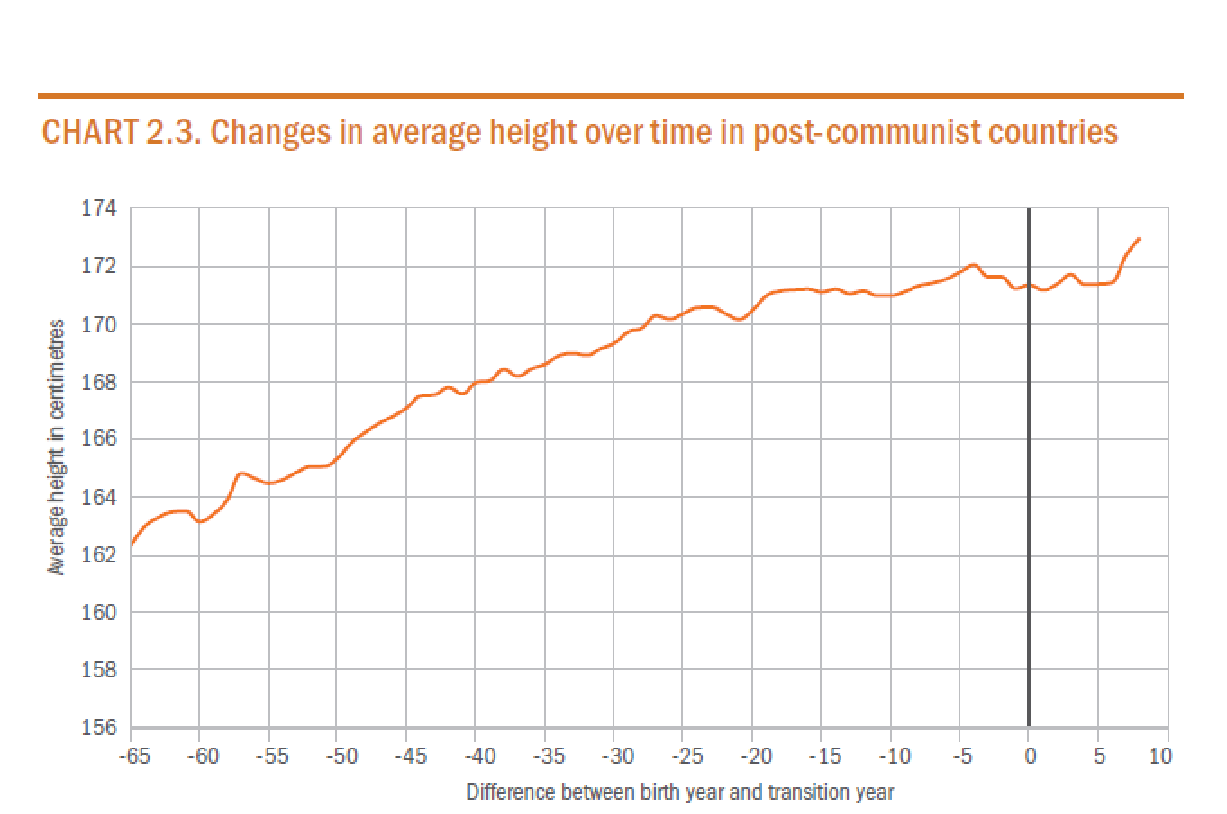
People that were born in Ukraine in early 1990s or mid-99 are now old enough, so their height stopped increasing. We can measure them and we can answer the question whether the early years of reforms have or have not affected their adult height. Unfortunately, the answer to this question is that these people are one centimeter shorter than the people, who were born earlier or later. Though it does not look like that much at first, this is a huge effect. For those who grew up in a conflict zone or with a civil war in our region, the height was also lower by 1 centimeter. The early years of transition were thus really very painful.
The graphs I showed you earlier demonstrated that incomes went down for everybody. These graphs reflect the real pain that we can still trace in the people born at that time being shorter. This in a way reminds of paleontological research of fossils but here we are actually speaking about real people.
Chart 2.4
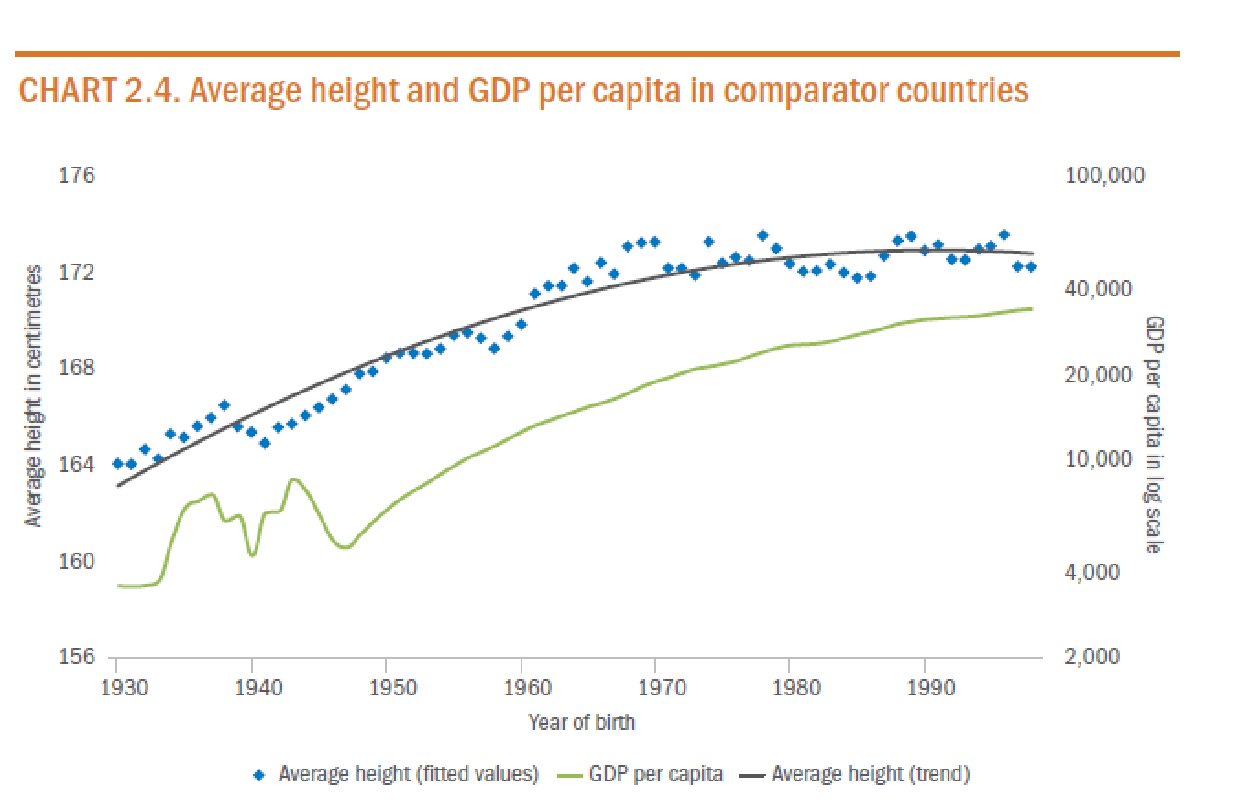
Now I should tell you that these people are happy. In development economics, people who are shorter occasionally get less education, worst jobs, and lower income. However, these problems were compensated and overcompensated by the access to economic opportunities and better education. It turns out that these people are not unhappy, even though they are shorter.
On a positive note about happiness, the next graph (Chart 2.2.) tells you that there is now some piece of good news. The transition happiness gap has closed as transition countries have finally converged in terms of happiness to other countries.
Chart 2.2
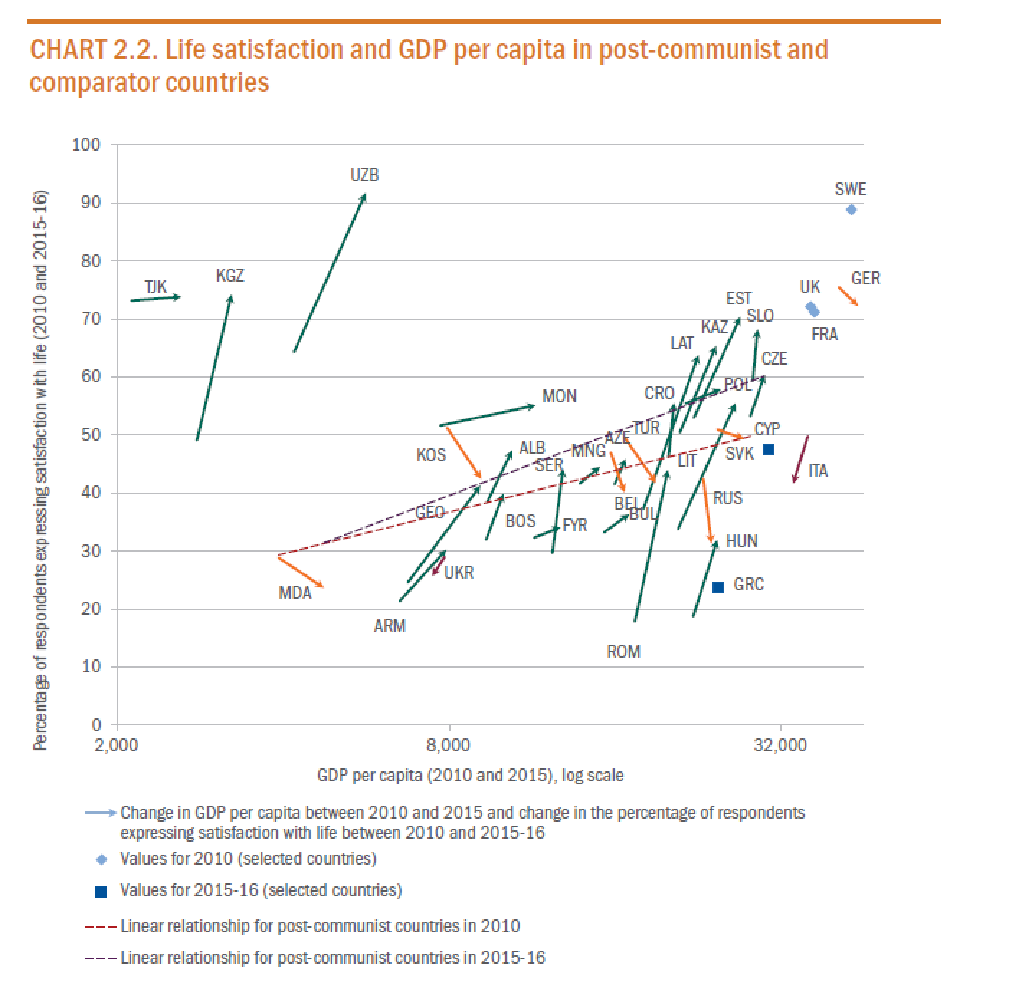
Let me show what happened using this graph (Chart 2.2). The horizontal axis shows income, GDP per capita (PPP, log scale), this is country-wide average (I will talk about inequality later). So let’s talk about averages. The vertical axis shows the percent of people, who agree with the statement: “I am satisfied or very satisfied with my life”. Now you see three big outliers here from the Central Asia. In those countries, when people respond to questions of the type “Do you agree?” they always say: “Yes, we agree”.
Let me talk now about the two trend lines. The lower one is for post-communist countries (except those three Central Asian countries) in 2010; the upper one is the trend line for them in 2016. The line has thus shifted upwards, as most post-communist countries went up in the period of 2010-2016. In the last 6 years, our countries have become happier, even when we control for income.
If we compare the trend for transition countries with the trend for Western countries or other non-transition countries, the answer would be that transition countries used to be unusually unhappy given their incomes. You can see that Italy is on the trend, quite unhappy in 2010. But then the rest of the Western countries (France, Germany, Sweden, UK) are way above the trend. In the 2016 round, we did not survey UK, France, Sweden, we still surveyed Germany, Italy plus we surveyed Greece, Cyprus and Turkey. You can see that Germany moved downwards and is now more or less on the trend. All other non-transition countries are actually below the trend.
Earlier, controlling for income, residents of transition countries always used to report low life satisfaction. I myself have done research on this and shown that this is related to the macroeconomic volatility in 1990’, a reduction in the quality and access to public goods relative to expectations based on communist past, rising inequality. The access to education was also important, namely the fact that older generations understood that their human capital was no longer easy to use in the market conditions. Younger generations that went to school in the new market economy actually saw its education better suited to market realities. I’m not saying that old education was good or bad; I’m saying that it was not as suitable for the current conditions. When we were doing this research we predicted that eventually the “transition happiness gap” would close. Finally, in 2016 we can say it has happened. “Happiness convergence” is completed.
So what about the adult height? All countries, especially middle-income countries, observe that each year with GDP growth results in taller people. This is the graph (see the Chart 2.3) that you can also do for the Western countries, and you would see that people who were born earlier were shorter. The horizontal axis does not show the birth year, it shows the difference between the birth year and the transition year.
Let us assume that transition started when price liberalization happened. The average height of the people who were born 30 years before the transition was 169 cm. Then we see that younger people were getting taller, until you come to those who were born two or three years before the transition started. These are the people, who grew up during transition, then you see a big drop, and only after this period even younger people jumped back to the trend.
Notice that as reforms started in different times in different countries, we can even control for age. We also added other controls. For example, we asked, if you control for the change in GDP, would that explain the decline in height? The coefficient of GDP during the first years of life is positive and significant, so the larger the fall in GDP in early years of transition, the larger its negative effect on the height is. However, the effect of being born in the transition is still significant, despite being smaller. Therefore, the recession explains only part of the effect, as, apparently, social stress took its toll too.
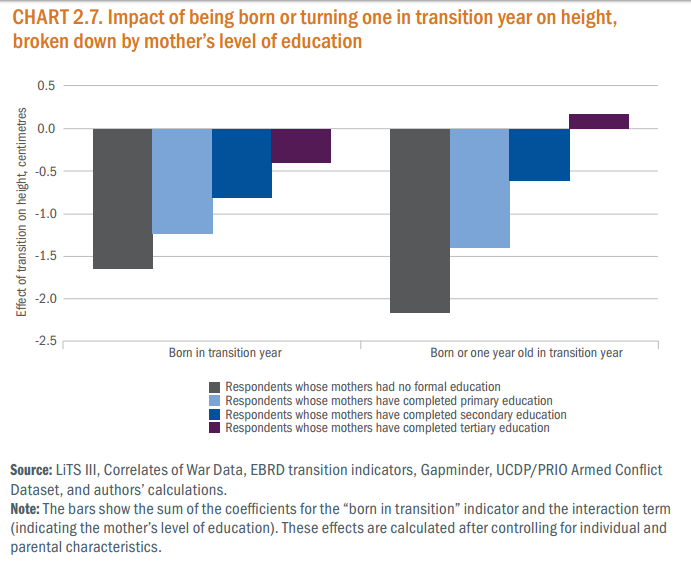
The discussion above applies to average indicators, in this case the height of an average person born in transition and grown up in transition. As I have said, we have found that being born in a transition year costs you 1 cm of height. So what if we ask a question, “What parts of the public were affected more than others?” The answer would be that it depends on a family you were born in (Chart 2.7). Basically, for example, if we split the sample by the education of parents, we find that less educated families were affected most. So if you grew up in a less educated family, you were much more likely to be hit by the transition shock. Moreover, if you grew up in a family where your mother had a higher education, the impact of transition on your height was almost zero.
Chart 2.7
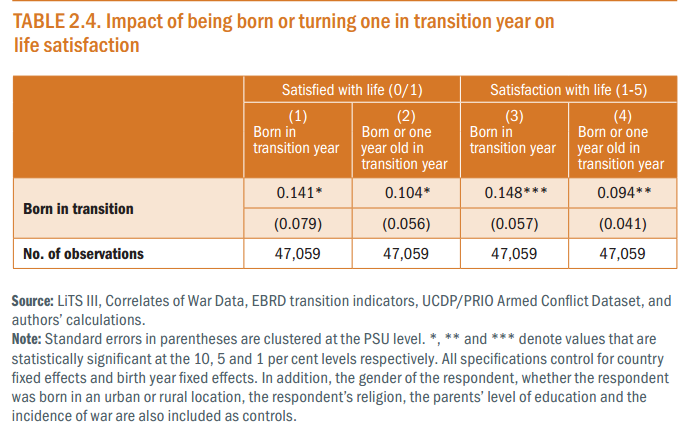
As I promised you earlier, we can also ask a question whether people born in transition are unhappy (Table 2.4), whether they have lower chances to get a job, lower income so on. We found no difference in terms of income, employment or marital status. We see that these people have more education. The reason is that the younger you are in our countries, the more education you have because there was a deregulation of education system, greater supply of education. We find that education does explain part of higher happiness, but not all of it. Probably access to economic opportunities also matters.
What about the cohorts born after transition? They already grew up to the adult height but are still in school. To study their socio-economic outcomes in more detail, we will have to come back to this question in a few years.
Table 2.4
Equality of Opportunity
We, as economists, believe that inequality of outcomes might be good or bad, but there is certainly widespread agreement that inequality of opportunity is bad. This is because we have a consensus that we want everybody, wherever you were born, whatever family you were born in, to have access to the same career opportunities and the same education. As political economists, we believe that if there is a country with high inequality of opportunity, then the majority may agree that this is unfair and would vote against the system.
Reforms that do not provide equality of opportunity may not be sustainable. They can be reversible and, in that sense, we think that inequality of opportunity is bad. As economists, we also know that due to inequality of opportunity some people cannot realize their full potential, which is socially inefficient. If you have a talented person born into a poor family and therefore not able to pursue the right education and the right career, this is inefficient for the society as a whole.
Unfortunately, in our countries of operation and in the West as well, gender, race, parental background, birthplace may all have an effect, and actually, it is so. Here, we use the methodology, which is now quite conventional, where we try to decompose the inequality of outcomes into factors that you can affect and the factors that you cannot affect. Let us look at the income inequality, for example, its Gini coefficient. We ask what part of this Ginny coefficient can be explained by the people being women or ethnic minorities or born in rural places or born in rich families and so on. We thus look at the factors that they cannot effect. You cannot change your parents and, in most cases, you cannot change your gender. You cannot change you race. This is what captures the inequality of opportunity. You see that inequality of opportunity and inequality of outcomes (in this case, incomes) are correlated. There are no countries that have high inequality of opportunity and low inequality of income.
And the reason for that is very simple. If you have inequality of opportunity, people that are born in unfavorable circumstances will not be able to pursue good careers and will have low income as the result.
Chart 3.3
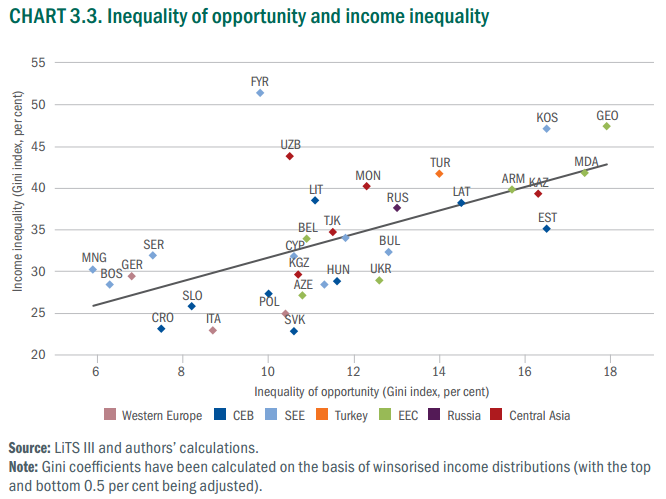
The graph shows that inequality of opportunity is lower than the total inequality. So part of the total inequality is explained by factors that depend on you, while part of inequality of income is explained by factors that you cannot change such as gender, race, birthplace and so on. Does that mean that inequality of opportunity is much lower than inequality of incomes? In this case, yes. In some countries, 20% of inequality of income is explained by inequality of opportunity, while in some countries, it’s 50%.
Chart 3.4
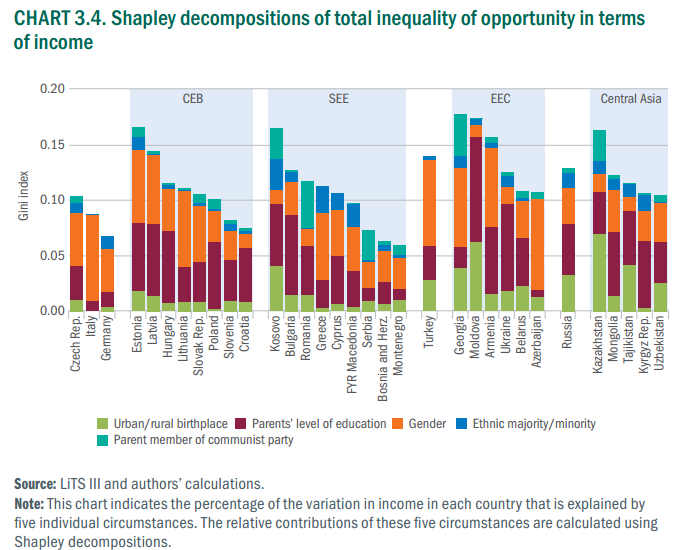
Chart 3.4 presents a country-by-country decomposition of inequality of opportunity into various factors. Here we have parental education, parental membership of communist country, which in our case shows the belonging to the elite. We also have gender, we have urban/rural birthplace, we have ethnic majority or minority etc. We see that if you look, for example, at Germany, inequality of opportunity is low. In most countries of our operation, inequality of opportunity is rather high. In general, in the region, parental background is very important, while gender follows as a distant second factor. You can see that, in Ukraine, parental background explains almost everything. It is then followed by gender and place of birth.
We also look at other outcomes such as access to jobs and access to education. We find that inequality of opportunity is quite high. One interesting thing is that when we look at gender we see that women in our region do have the same or even more education than men. And education on average leads to higher incomes. So higher education brings you 31% more in terms of wages, which is O.K. This is similar to what we observe in the West. In the USA, the number would be 40-50%, in some Western European countries, it would be 30%. We also observe that even though women have the same education they earn 20-25% less than men.
We also run regressions for support of market reforms and democracy. We find that people that see themselves lower in the income ladder are more likely to reject market reforms and democratic reforms. Part of this effect is explained by high inequality of opportunity.
Conclusions
Reforms have actually increased inequality in most countries of our operation. They have benefited very poor and very rich, but not the people in the middle, or at least not so much. Only a minority saw that the reforms helped them converge to rich countries. It is a sizeable minority, but still not a majority. We also saw that early years of reforms were quite painful, and the pain was substantial. But when we look at the happiness, we see that the happiness gap has finally closed. People that live in transition countries are now as happy or as unhappy as the people with similar incomes in other countries. Some of the convergence happened because people in the West became less happy. But people in the transition countries have become happier. When we studied the issue 10-15 years ago, we thought it would happen sooner. The 2010 recession hit our region disproportionately more than western countries, so the happiness convergence was delayed. But by now the convergence has finally happened. We may say that the reforms have actually delivered.
This gives you a certain message on how to design reforms and how to think about inclusion. This message can be very useful to Western politicians who are thinking about a pension reform and a labor market reform etc., even though these reforms are not as painful as the transition from the communism to the market economy. But yes, these reforms would still be painful. Some reformers would say, in the short run, many people will experience pain, but in the long run, happiness will be back. The story from our countries shows that yes, there was pain in the short run and gains in the long run. But in some of our countries, the short-term pain was abused by populist politicians who claimed that reforms needed to be reversed. In some cases, those politicians have actually dismantled whatever imperfect democratic institutions there were. Democratic forces are not able to come back in those countries, because the political system there is no longer competitive.
So there are some difficulties with the short-term-pain and long-term-gain scenario. This means that when you design a reform, you always need to think about distributing the gains from the reform from the very beginning as much as possible and as broadly as possible. You have to support the most vulnerable. Our analysis also shows that people who suffer from reforms are the ones with less education and less income. They should be protected, so that they support the reforms.
Sources: EBRD report and the video of the lecture
The transcript made by Taras Galaida, Kyiv National University of Construction and Architecture; Kateryna Koshlan, Ukrainian Catholic University; Julia Lebedinska, Ukrainian Catholic University; Maksym Vishnyashin, Ivan Franko National University of Lviv. Edited by Olena Shkarpova, VoxCheck editor, and Rostyslav Averchuk, VoxUkraine guest editor

Attention
The author doesn`t work for, consult to, own shares in or receive funding from any company or organization that would benefit from this article, and have no relevant affiliations