Quarantine for all is a justifiable measure when it is necessary to act blindly, but it brings catastrophic economic consequences – it could be compared to battering in a nail with your fist. Analysis of the countries’ experience close to curbing the epidemic indicates the need to obtain the most complete information possible about the number of patients to implement more well-targeted restrictive measures. This can help ease the restrictions imposed on everyone and eventually kick start the economy.
As of April 8, Ukraine ranked last among the European countries in terms of the number of COVID-2019 tests performed per million population. According to worldometers.info, as of April 16, there were only about 40,000 tests done in Ukraine, compared to about 1.6 million in neighboring Russia. This means that the Ministry’s information on the number of cases and, to a lesser extent, deaths, may not reflect the true extent of the epidemic due to a relatively narrow number of people having access to testing in accordance with the protocol. But what does it reflect then? Maybe it indicates 10-50% of all new cases and – if the only precondition for testing is “contact with an infected person” – the relative number of new cases will eventually decrease, as more and more people will get infected by those who did not get tested.
With a small number of tests, the government does not have accurate information regarding the epidemic situation in the country, which makes the fight against the epidemic an impossible task. The government cannot evaluate the effectiveness of certain solutions.
There is another key reason for intensive testing. The WHO points out the need for immediate and strict self-isolation for all those infected. It was thanks to a combination of quarantine and testing that the epidemic’s spread was stopped in China.
For a more detailed study of the quantitative aspects of the epidemic’s spread, let us turn to the SIR model that is widely used in studying epidemiological processes. Watch this video for a good visual demonstration of the model. According to it, the entire population is divided into 3 categories: susceptible (S) i.e. healthy people who can contract the disease (this category initially includes almost the entire population), infected (I) i.e. infected persons getting healthy persons infected, and recovered (R) i.e. those who have recovered (or died) unable to infect anybody or get infected themselves. The basic reproduction number R0 to be discussed below is decisive for the behavior of the number of infected persons in this model.
Basic reproduction number
In epidemiology, the epidemic’s spread rate is associated with the basic reproduction number R0. It shows the average number of new infected people caused by one infectious person while he or she is ill (infectious). This value is determined by the level of contagiousness of the disease and intensity of social interaction among the population where it spreads. If R0 >1, there will be a rapid increase in the number of infections affecting a large part of the population (80% at R0 = 2). R0 <1 means that the epidemic is waning. For SARS-CoV-2 virus, this figure is estimated by various authors (see the review by Liu, Gale, 2020) at approximately 3. It can be expected to be higher for large communities.
With any disease control measures in place, the effective reproductive number R is used. The task of governments around the globe is to reduce it to less than 1. This can be achieved by using the following methods or combinations thereof:
- social distancing – to curb the epidemic, on average, it would suffice to reduce the intensity of “social interaction” more than threefold;
- vaccination – to curb the epidemic, it would suffice to vaccinate more than two thirds of the population which will leave one in three vulnerable to infection, at best. This neutralizes the average 3 infections by one infected person in the case of entirely vulnerable population (effect of “herd immunity”);
- immediate and complete isolation of at least two thirds of all infected persons in which case each infected person gets three other persons infected, but at least two of them immediately find themselves in strict isolation.
The first of these methods seems to be the only option in the absence of a vaccine and significantly incomplete information obtained through testing. However, it is extremely costly for the economy. With no vaccine available, the only viable alternative is the third approach requiring that the number of newly infected be brought to at least two thirds of the total number of new cases, followed up by a strict quarantine. As Iceland’s nationwide selected testing experience shows, this task is complicated by the fact that about 50% of all new confirmed cases may be asymptomatic at the time of the testing.
Decisive expansion of testing as the only alternative to quarantine
To understand the extent of the problem, it is not enough to test only those who were in contact with the sick or those who came from abroad. The list of persons to be tested should be significantly expanded at the expense of:
- getting persons exhibiting similar symptoms tested;
- testing everyone, as in South Korea;
- testing those who, due to their line of work, have to interact with a large number of people during quarantine (doctors, vendors, etc.);
- testing other groups and population clusters in which the probability of detecting infections is higher than in the country as a whole.
Specifically, South Korea has been increasingly using mobile labs to make testing more accessible. With their help, anyone can be tested without leaving their own car. Indeed, with no lockdown or ban on public transportation, South Korea’s total number of cases shows a steady downward trend.
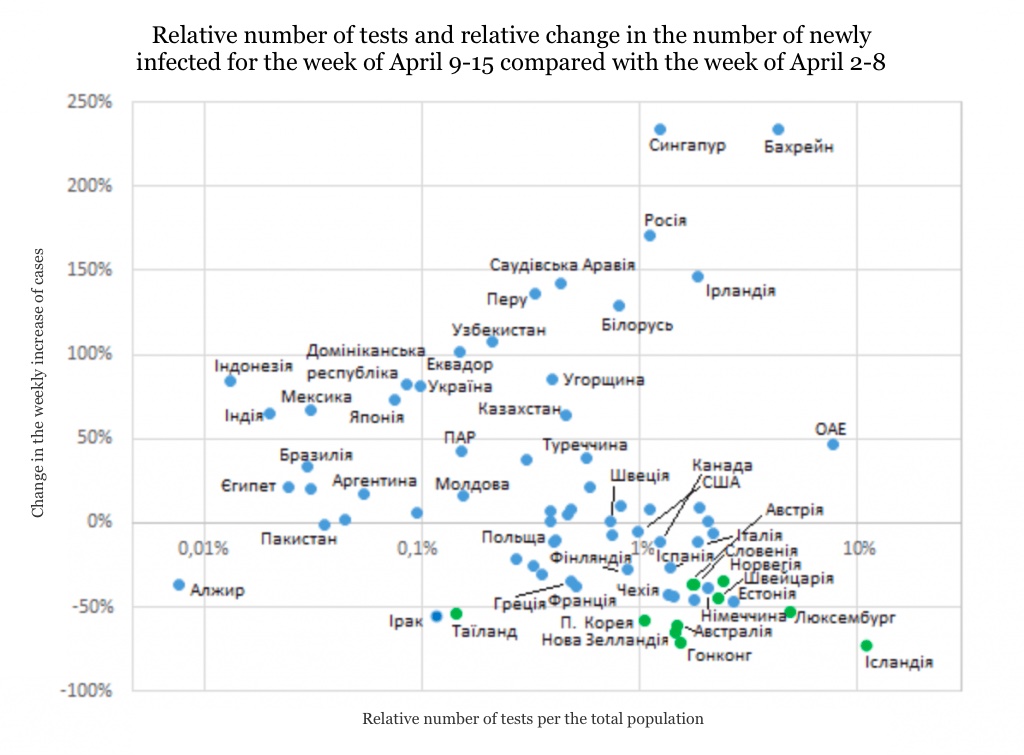
According to worldometers.info, the countries that have changed the epidemic’s course have actively tested the population. The level of testing prevalence can be estimated by the following two criteria – the number of tests per capita (see Figure 1) and the proportion of positive tests (see Figure 2). A lower value of this proportion usually means greater prevalence. It should be noted that some countries, e.g. South Korea and Iceland, have achieved a steady decline in the number of cases without implementing a lockdown.
While the relative change in the number of newly infected in the two weeks in Figures 1 and 2 shows short-term trends in the number of new cases, the relative increase in the week of April 9-15 in the total number of cases indicates the long-term dynamics. The level of 15% roughly corresponds to the situation when the peak incidence is mostly over. The countries with the number of all recorded cases increasing by less than 15% during the week of April 9-15 are marked in green. In these countries, reduction in the weekly number of new cases usually has been observed for a relatively long time.
Figure 1. Proportion of the number of tests to the total population and the relative change in the number of new covid-2019 cases for the week of April 9-15, compared with the week of April 2-8 for countries around the globe, according to worldometers.info. The countries with a total of 1,000 or more cases are considered. Tabular data are given in Annex 1.
Graph 2. Proportion of positive test results and the relative change in the number of new covid-2019 cases for the week of April 9-15, compared with the week of April 2-8, for countries around the globe according to worldometers.info. The countries with a total of 1,000 or more cases are considered. Tabular data are given in Annex 1.

Testing almost all newly infected and putting the confirmed cases in strict quarantine is a complex task not only for Ukraine’s healthcare system, but also for society at large that has to welcome such measures. It is generally known that in Ukraine, it is not customary to see a doctor about cold symptoms, but it could increase testing prevalence.
Another promising approach in a critical situation but controversial from the point of view of human rights, is monitoring the movements of the entire population warning about a close contact with those infected. The information obtained could be valuable in defining the range of individuals to be tested, helping significantly increase the scope of testing of newly infected. This opportunity provides a certain advantage to authoritarian regimes in fighting the epidemic. Implementing such an approach in Ukraine calls for public discussion.
Economy at stake
Thus, the task is to overcome the basic reproduction number for this virus, R0 = 3, using the arsenal of the tools at disposal.
We could think about it like this. In an ideal situation for the virus, one infected person gets three other people infected. But with the intensity of social interaction decreased by half, it will already be one and a half persons. If half of newly infected are identified and isolated, it will be an average of 3/4 persons. And if each person halves the probability of infection thanks to new sanitary habits and protective equipment, it will already be 3/8 persons, under which conditions the epidemic will decline quickly.
Any measure is more economically justifiable than economic shutdown. First and foremost, there should be quick and easy access to protective equipment and tests that should be available and, ideally, free of charge for people. For instance, if look at the proposal made by the Institute of Molecular Biology and Genetics, the cost of each domestic PCR test could be about 250 hryvnias. Thus, for UAH 1 billion, we can test 10% of the population as in Iceland (in South Korea, this figure is lower being about 1%). This amount looks rather modest compared to the economic losses from quarantine that could amount to about UAH 50 billion for each additional month of quarantine, without taking into account the long-term consequences. According to the 30 March government forecast, Ukraine’s real GDP will fall by 3.9% in 2020 whilst in the more recent IMF forecast, published half a month later the decline is expected at 7.7%. This is 10.7 percentage points (almost UAH 0.5 trillion) worse than this organization’s previous forecast published six months ago. Extending the quarantine for longer periods than in the above forecast scenarios of the Government and the IMF will mean the need to further revise them for the worse.
Testing en masse and isolating those infected will allow for easing of quarantine for all other citizens.Specifically, we are talking about the possibility of lifting the ban on public transportation and trade in compliance with sanitary norms. This would allow a large number of people to start working.
Lifting quarantines and the possibility of a second outbreak
The steady downward trend in the number of new cases may provide grounds for easing the lockdown, since key sectors of the economy need to get back to normal as soon as possible, albeit with some restrictions. The number of new covid-19 cases may eventually become zero for a fairly long period of time, which will allow for lifting all restrictions. What should we do in case of a second outbreak?
Before returning to quarantine, the WHO recommends conducting thorough epidemiological investigations and testing those who may have been in contact with those infected. This will be the “first line of defense”. To contain the situation, it would suffice to identify at least two thirds of all new cases (if R0 = 3) and considerable resources should be committed to this. With the infected persons being few and tied to one particular infected person (or more persons), the task of detecting new cases is substantially facilitated.
With the number of patients going into the hundreds, mass testing with a focus on special clusters and groups with strict quarantine for those infected can become the “second line of defense” – if this approach has proved effective in Ukraine, based on prior experience. Ukraine’s healthcare system should be effective enough to extinguish outbreaks on its own. Or else Ukraine will have to pay with lockdowns to curb the epidemics.
Annex 1. Tabular data for Fig. 1 and 2.
| Country | Proportion of the number of tests in relation to the total population | Proportion of positive cases | The relative change in the total number of cases during the week of April 9-15 | Change in the number of new cases for 2 consecutive weeks |
| Iceland | 10,96% | 4,6% | 6,9% | -72,0% |
| Hong Kong | 1,55% | 0,9% | 5,8% | -71,3% |
| New Zealand | 1,45% | 2,0% | 14,5% | -64,9% |
| Australia | 1,49% | 1,7% | 6,5% | -60,7% |
| South Korea | 1,05% | 2,0% | 2,0% | -58,4% |
| Iraq | 0,11% | 3,1% | 17,7% | -55,1% |
| Thailand | 0,14% | 2,7% | 11,6% | -54,2% |
| Luxembourg | 4,91% | 11,0% | 11,2% | -52,6% |
| Estonia | 2,72% | 4,0% | 18,1% | -47,0% |
| Lithuania | 1,78% | 2,3% | 19,6% | -45,9% |
| Switzerland | 2,30% | 13,2% | 13,1% | -44,6% |
| Denmark | 1,42% | 8,4% | 23,7% | -44,3% |
| Czech Republic | 1,36% | 4,3% | 18,6% | -42,6% |
| Germany | 2,06% | 7,8% | 18,9% | -39,2% |
| France | 0,51% | 44,3% | 30,9% | -37,6% |
| Slovenia | 1,79% | 3,4% | 14,4% | -37,2% |
| Austria | 1,74% | 9,2% | 10,9% | -36,9% |
| Algeria | 0,01% | 64,3% | 37,4% | -36,4% |
| Norway | 2,40% | 5,2% | 12,5% | -35,2% |
| Greece | 0,49% | 4,3% | 16,3% | -34,3% |
| Iran | 0,36% | 25,5% | 18,3% | -30,5% |
| Finland | 0,88% | 6,9% | 30,2% | -28,0% |
| Spain | 1,39% | 27,8% | 21,9% | -26,4% |
| Armenia | 0,33% | 12,0% | 26,1% | -25,8% |
| Malaysia | 0,27% | 5,8% | 23,1% | -21,3% |
| Bosnia and Herzegovina | 0,41% | 8,3% | 38,1% | -11,3% |
| Canada | 1,24% | 6,1% | 46,0% | -11,2% |
| Italy | 1,85% | 14,8% | 18,5% | -10,8% |
| Poland | 0,41% | 5,0% | 45,7% | -10,3% |
| Azerbaijan | 0,74% | 1,7% | 52,4% | -6,9% |
| Israel | 2,16% | 6,7% | 32,9% | -6,5% |
| USA | 0,98% | 19,8% | 47,9% | -4,7% |
| Pakistan | 0,04% | 8,2% | 49,7% | -1,2% |
| Panama | 0,39% | 22,3% | 48,4% | 1,0% |
| Sweden | 0,74% | 16,0% | 41,7% | 1,0% |
| Portugal | 2,04% | 8,7% | 37,7% | 1,2% |
| Philippines | 0,04% | 11,7% | 40,9% | 1,5% |
| Croatia | 0,47% | 9,0% | 29,6% | 4,7% |
| Columbia | 0,10% | 6,4% | 51,2% | 6,3% |
| Romania | 0,39% | 9,6% | 51,6% | 6,7% |
| Belgium | 1,11% | 27,2% | 43,5% | 7,7% |
| Chile | 0,48% | 9,0% | 49,2% | 8,4% |
| Qatar | 1,89% | 6,8% | 67,9% | 9,2% |
| Netherlands | 0,82% | 20,0% | 37,0% | 9,6% |
| Moldova | 0,16% | 32,7% | 74,5% | 16,5% |
| Argentina | 0,05% | 10,5% | 43,2% | 17,2% |
| Morocco | 0,03% | 19,7% | 58,7% | 20,6% |
| United Kingdom | 0,59% | 24,7% | 62,1% | 20,7% |
| Egypt | 0,02% | 10,0% | 60,6% | 21,0% |
| Brazil | 0,03% | 45,9% | 76,7% | 33,5% |
| Serbia | 0,30% | 18,5% | 82,8% | 37,4% |
| Turkey | 0,57% | 14,5% | 81,5% | 38,2% |
| SAR | 0,15% | 2,8% | 35,8% | 42,2% |
| UAE | 7,76% | 0,7% | 101,8% | 46,7% |
| Kazakhstan | 0,46% | 1,6% | 78,1% | 63,7% |
| India | 0,02% | 4,5% | 109,1% | 64,7% |
| Mexico | 0,03% | 14,6% | 93,9% | 66,5% |
| Japan | 0,07% | 9,2% | 84,8% | 73,4% |
| Ukraine | 0,10% | 9,7% | 101,9% | 81,0% |
| Dominican Republic | 0,09% | 39,0% | 71,2% | 81,7% |
| Indonesia | 0,01% | 15,3% | 79,8% | 84,5% |
| Hungary | 0,40% | 4,3% | 76,4% | 84,9% |
| Ecuador | 0,15% | 30,1% | 76,6% | 101,4% |
| Uzbekistan | 0,21% | 1,9% | 138,9% | 108,0% |
| Belarus | 0,81% | 4,9% | 182,9% | 129,2% |
| Peru | 0,33% | 10,5% | 164,3% | 136,3% |
| Saudi Arabia | 0,43% | 3,9% | 99,9% | 141,7% |
| Ireland | 1,84% | 13,8% | 106,6% | 146,4% |
| Russia | 1,11% | 1,7% | 175,8% | 170,5% |
| Singapore | 1,24% | 5,1% | 127,9% | 233,2% |
| Bahrain | 4,31% | 2,3% | 103,0% | 233,9% |
| Bangladesh | 0,01% | 10,6% | 464,7% | 517,7% |

Attention
The author doesn`t work for, consult to, own shares in or receive funding from any company or organization that would benefit from this article, and have no relevant affiliations