The intensification of geopolitical tensions, the spread of protectionism, and quarantine restrictions have called into question the reliability of global supply chains. Reshaping them to take into account the need to safeguard national interests, may lead to economic losses for individual countries as well as for the world as a whole.
However, the value of gaining access to key resources without infrastructural or geopolitical risks should not be underestimated. Having experienced firsthand the importance of such access, the EU remains closely tied by trade with countries with a different geopolitical stance, primarily China. Therefore, it may be interested in cooperating with Ukraine to diversify sources of supply of selected goods and/or relocate their production.
The trend toward geoeconomic fragmentation: Farewell, globalization?
Since the early 1990s and up until the global financial crisis of 2008, the production of goods and services had become increasingly globalized. To improve their own efficiency and reduce the cost of the final product, companies created complex supply chains in which the design, manufacturing of components, and final assembly took place in different countries. However, increasing geopolitical tensions, the spread of protectionism, and quarantine restrictions raised doubts about their reliability.
As a result, companies increasingly considered the possibility of moving production to neighboring (near-shoring) or geopolitically aligned (friend-shoring) countries, as well as returning it to the country of origin (reshoring). An alternative approach was to diversify activities among a larger number of countries (diversification).
In 2023, 74% of transnational corporations with a significant presence in the EU planned to take at least one of these measures within the next five years, compared to only 42% in the previous five years. Friend-shoring became almost four times more popular, but the share of those planning to move production out of the EU to other countries as part of this step also increased (see Figure 1).
Figure 1. Measures planned by transnational companies operating in the Eurozone for the next five years, % of respondents
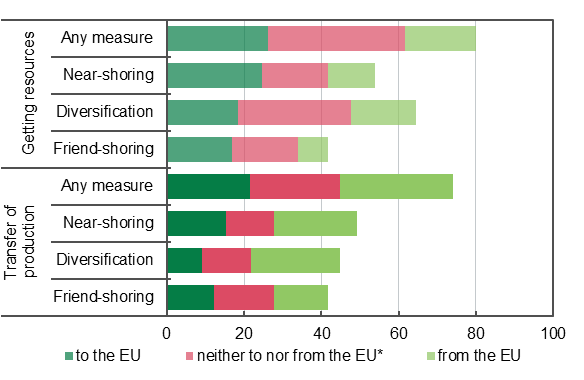
Any of the listed measures: near-shoring, friend-shoring, and/or diversifying.
* Responses of companies that did not signal an intent to move production either into or out of the EU.
Source: ECB survey, July-August 2023.
Government representatives also called for reducing risks caused by interdependence with geopolitical opponents. The U.S. emphasized the importance of cooperation with allies and partners, the EU focused on enhancing its economy’s competitiveness, resilience, and security, and China stressed self-sufficiency, especially in technological development.
Fragmentation is already affecting the dynamics of selected economic indicators. Since Russia’s full-scale invasion of Ukraine, the growth rate of trade between geopolitically aligned countries (based on UN voting) has been 3.8 percentage points higher than that between geopolitically distant countries. Similar trends were observed in foreign direct investment (FDI).
A negative sum-game: are losses inevitable?
Economists predict significant losses for global economy and trade resulting from geoeconomic fragmentation. The long-term reduction in global GDP is estimated to range from 0.2% to 7.0% (Aiyar et al., 2023), depending on the type of trade restrictions, transmission channels, and fragmentation scenarios, which vary in how countries are grouped into “blocs.”
For some countries, potential losses from friend-shoring if the world divides into two blocs (centered around the U.S.-EU and China) range from a modest 0.1–0.6% of GDP in Scandinavia to 2.3–2.8% of GDP in Kazakhstan and 2–4.6% of GDP in Morocco (Javorcik et al., 2022).
However, assessments of the economic impact of the strategy of geopolitical neutrality are the most diverse. On the one hand, third countries could attract additional trade and investment from both blocs, at least in the short term. For instance, in 2022–2023, new foreign direct investments were primarily directed not toward geopolitically aligned countries but neutral ones. In the third quarter of 2023, nearly 40% of announced projects were in such countries. Thus, according to IMF estimates, these countries’ GDP could see a slight increase (within 0.1-0.2%) in the case of a moderate fragmentation.
On the other hand, a decline in aggregate demand in leading economies could offset the shift in trade flows in favor of third countries. According to IMF estimates, if OECD countries reduce dependency on goods from China and vice versa (through friend-shoring), Southeast Asia’s GDP and exports are expected to shrink by 0.2-0.7% in the long term compared to the baseline scenario.
Overall, if a country has to abandon geopolitical neutrality and limit trade with one of the blocs, the negative impact on global GDP and the output of such countries will be greater (Bolhuis et al., 2023; Cerdeiro et al., 2021). However, staying neutral is more challenging than it may seem at first glance. Strategic uncertainty about maintaining such neutrality in the long term effectively undermines its benefits due to the risks of reduced investment from both blocs.
Figure 2. Long-term GDP losses*, % deviation from the no-fragmentation scenario
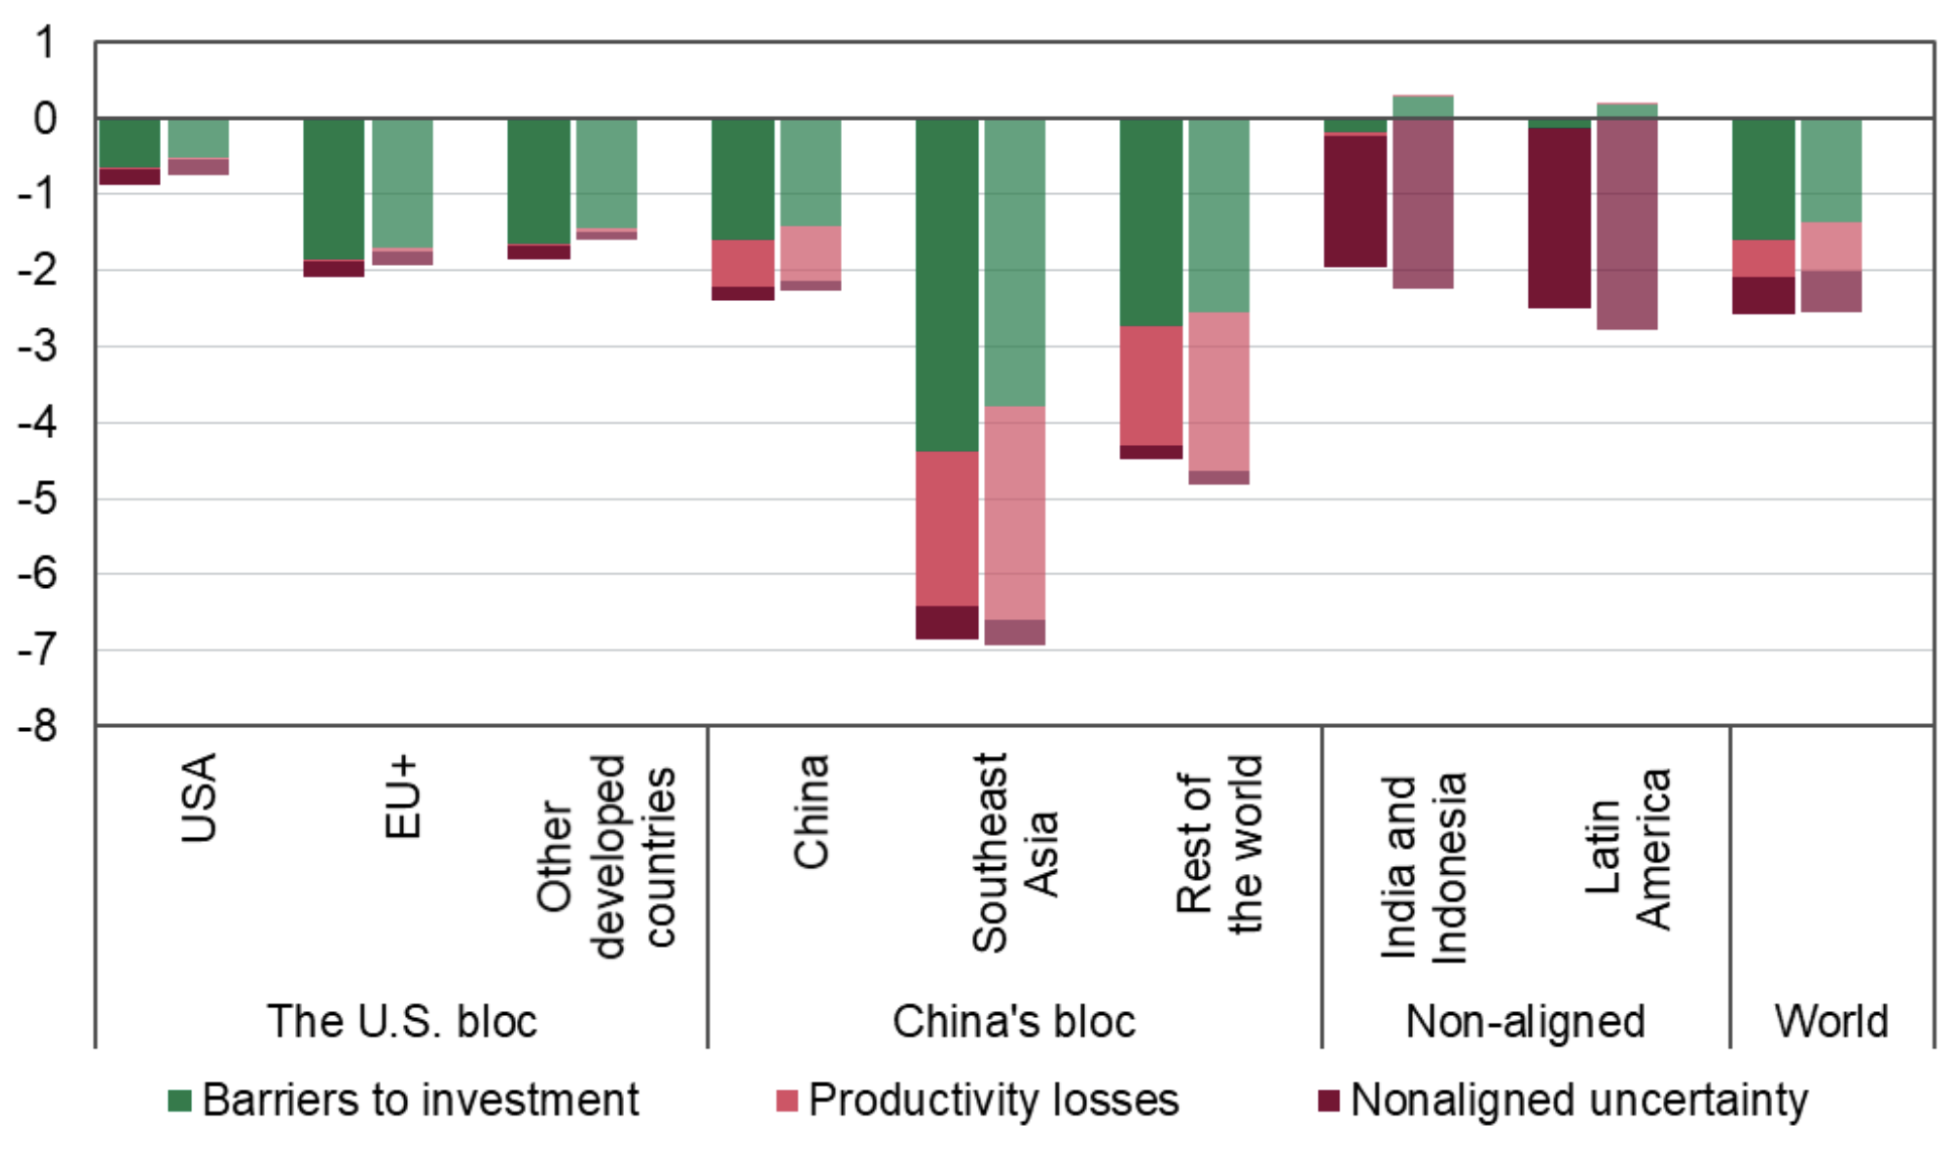
* A lighter color indicates estimates with higher elasticity of substitution.
Source: IMF.
Moreover, the cost of a mistake could be high. For example, if Latin America gravitated toward China’s position (instead of the US-EU), it would suffer twice as much from fragmentation due to the negative impact on productivity (Goes and Bekkers, 2023).
Additionally, not all new foreign direct investments (FDI) attracted through the redistribution of economic flows equally contribute to the transfer of knowledge and technology. At least some of them may simply be used to bypass trade restrictions. For instance, a relatively more of Chinese FDI since 2017 has gone to countries whose share of U.S. imports increased the most, particularly Mexico and Vietnam. The shares of these two countries in Chinese exports also grew, suggesting that trade between the U.S. and China was redirected through them. BIS research also found an extension of supply chains in 2022–2023, particularly from China to the U.S. However, unlike friend-shoring, this did not reduce the real interdependence between these two markets.
EU and China: an unbreakable connection?
The EU has experienced the importance of sustainable access to key resources and manufacturing components firsthand. The first challenge came with the semiconductor shortage, driven by efforts to combat the COVID-19 pandemic. This shortage had a more significant impact on EU economies, where the automotive industry was the primary consumer. In contrast, in the U.S. and China, semiconductors were mainly ordered by telecommunications and computer equipment manufacturers, who were first in line after automakers and their direct suppliers canceled their own orders.
The second challenge was dependence on Russian gas. In 2022, Europe’s infrastructure withstood a reduction in Russian pipeline gas supplies by over 55%. However, this was achieved in part through reduced consumption by industry, which hindered economic growth.
Both challenges have weakened the EU’s position in the global economy, whose share of global GDP (in PPP terms) decreased by 0.8 percentage points from 2019 to 2023, to 14.5%. Therefore, reducing supply chain vulnerabilities could become a crucial aspect of the EU’s sustainable economic development.
While the EU’s dependence on Russia was primarily evident in value chains within raw material sectors (such as energy and non-energy mining and metallurgy), its dependence on other geopolitically distant countries, particularly China, is also present in technological sectors.
Overall, in 2022, goods with a high degree of dependence—those the EU cannot easily substitute (see the note to Figure 3 for more details)—accounted for less than 9% of the EU’s imports. However, this does not diminish their importance in the EU’s domestic demand. For example, critical raw materials (CRMs) are typically used in relatively small quantities but are indispensable for producing most technological goods. In figure 3 goods with a high degree of dependence are marked with squares. The supply chain risks are the highest for goods marked with pink squares located in the upper right corner of the diagram, i.e. those coming from geopolitically distant countries and whose import is important and largely monopolized. In contrast, oil, which is important and significant in volume (about 10% of total imports, marked by a pink circle), was sufficiently diversified and therefore did not meet the criteria for dependence.
Figure 3. EU imports by dependence indicators*, trade volumes, and weighted average geopolitical distance** to exporting countries
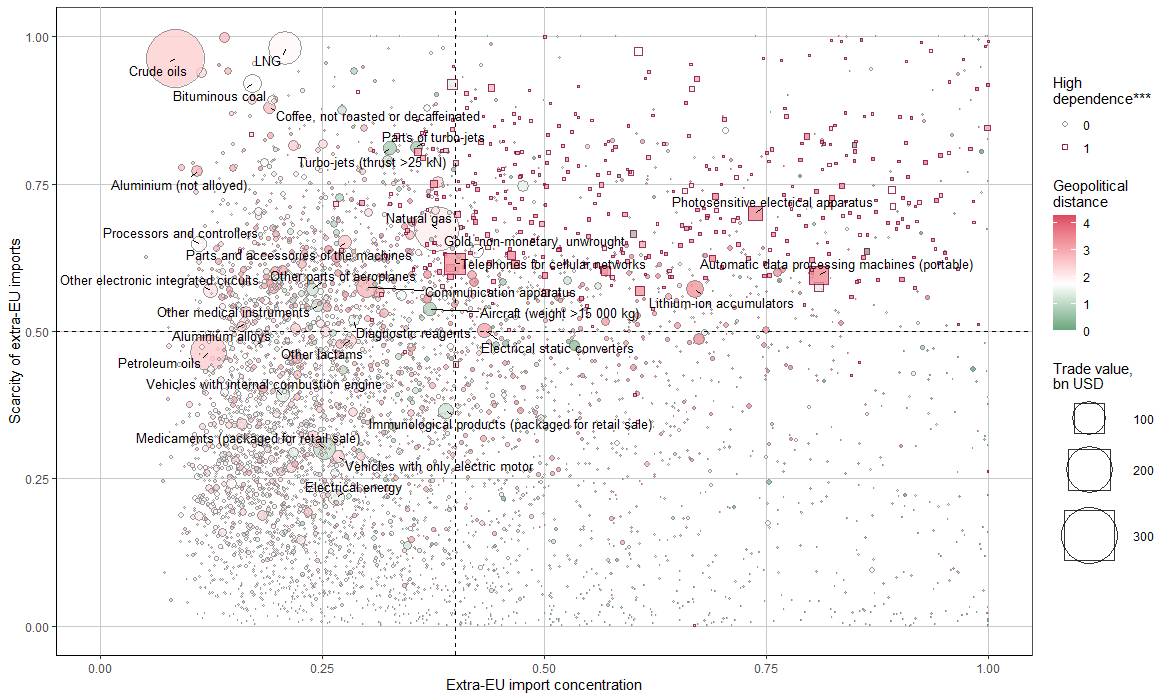
* According to the European Commission’s methodology, a good with a high degree of dependence is the one with a concentration index (Herfindahl-Hirschman Index based on the shares of exporting countries in EU imports) greater than 0.4, a scarcity index (the share of imports from extra-EU countries in total EU imports) above 0.5, and a substitutability index (the ratio of imports from extra-EU countries to total EU exports) exceeding 1.0 simultaneously.
** Geopolitical distance is measured as the difference in UN voting patterns between the respective country and the U.S., based on data from Bailey et al. (2009). Overseas territories, Hong Kong, and Macau have the same geopolitical distance as the countries that represent them; for Taiwan, the average geopolitical distance of G7 countries is used. A smaller distance indicates alignment with the U.S. positions in UN votes in 2022, while a larger distance reflects alignment with China’s positions.
In the figure, squares represent goods with a high degree of dependence in at least four out of five years during the period 2018-2022. Additional information about the EU’s trade dependencies and potential pathways for integrating Ukraine into the EU supply chains can be found in the thematic box of the July 2024 Inflation report, titled “Friend-Shoring for the EU: An Opportunity for Ukraine?”.
Source: NBU calculations based on BACI-CEPII data
In 2022, China supplied the EU with more than half of the goods with high import dependence and was among the top three suppliers in 65% of cases. The role of other countries was significantly smaller, with none exceeding a 6% share in imports.
In agriculture and the textile industry, the EU’s import dependence is largely driven by geographic factors (e.g., ginseng, coconut oil, bamboo, rattan, silk, cashmere, etc.) and peculiarities of the globalization of the fashion industry in previous years. However, these do not pose significant risks to the EU, partly due to the common agricultural policy, which ensures a stable supply of crop and livestock products typical of the European region.
In contrast, strategic dependencies exist in energy-intensive industries, renewable energy, defense and aerospace, digital technologies, electronics, and healthcare. Supply chain disruptions in these sectors could significantly impact the EU’s ability to ensure the health and security of its citizens and achieve its green and digital transformation goals.
These dependencies arise primarily because the EU lacks substantial deposits of critical raw materials (CRMs), such as magnesium, rare earth elements, and platinum group metals, etc. Diversifying CRM supplies from countries like China or South Africa has often been hindered not only by the concentration of mineral deposits in these countries but also by the global concentration of CRM processing. Specifically, China accounts for over 75% of cobalt processing, while its share in cobalt extraction is less than 3%. This is facilitated by the supply of unprocessed cobalt from the Democratic Republic of Congo (about 65% of global production), nearly 50% of which is controlled by Chinese companies. Furthermore, over 70% of global cobalt trade was subject to export restrictions, the highest among major CRMs.
Accordingly, the EU also depends on the import of components and assemblies made from critical raw material compounds. China currently dominates the entire supply chain for batteries, solar panels, and wind turbines and holds a significant position in the production of parts for traction motors, robots, drones, and electronics. As a result, in the semiconductor sector, the EU is a net importer of diodes and transistors from China and advanced chips from Taiwan.
Figure 4. China’s share in global production of components and assemblies for respective goods, %
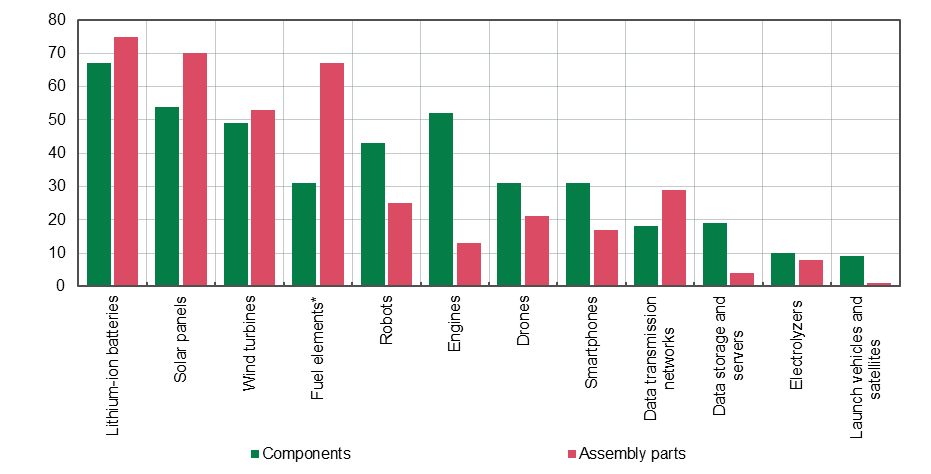
* Total for Asia (China, Japan, Korea, Taiwan, and the rest of Asia).
Source: JRC Science for Policy Report.
China, which transformed into the “world’s factory” over the course of several decades, primarily depended on Western technologies: equipment (especially specialized equipment), semiconductors (with Taiwan included in the U.S.-EU bloc), aircraft, and pharmaceutical products. The rise in living standards in China also created demand for selected luxury goods (such as jewelry, perfumes, and cosmetics from leading brands). Western countries have also played a key role in supplying iron ore and food products (grains, meat, soybeans, dairy). Today, as a leading food producer, China is increasingly focused on self-sufficiency and deepens cooperation with other countries, including russia, which competes with Ukraine in many commodity groups.
Ukraine’s position: are there reasons for optimism?
According to Javorcik et al. (2022), one of the challenges of friend-shoring is the similar level of economic development among geopolitically aligned countries. As a result, prioritizing trade with such countries significantly reduces the potential to exploit comparative advantages. However, Ukraine could become an alternative to more geopolitically distant Emerging Markets (EM) countries with comparatively smaller economic losses for the EU, as it is also an EM country.
As demonstrated by the relatively swift shift away from Russian goods, the EU has the potential to divert trade toward geopolitically aligned countries. In 2023, Russia’s share in EU imports dropped by 4.7 percentage points compared to the previous year (to 2% of total imports) due to EU-imposed economic sanctions and supply diversification. However, this share still exceeded Ukraine’s, which, even before the full-scale invasion, was only 1.1%.
The total volume of the EU’s imports of goods with a high degree of dependence in 2022 amounted to nearly $263 billion, more than ten times the value of Ukraine’s exports to the EU (around $25 billion). While Ukraine cannot become a supplier of all such goods, the prospects are cautiously optimistic in both traditional sectors (agriculture, mining, and metallurgy) and the production of technology-based goods.
Ukraine already has a track record of successful cooperation with European manufacturers, making its inclusion in EU supply chains for producing batteries, solar panels, and semiconductors a priority. This will be further supported by the fact that Ukraine possesses more than half of the CRMs on the EU’s list, though only a few deposits, such as of graphite and titanium ores, have been developed so far.
Ukraine’s experience in building and localizing its defense industry (including drones) during the war, with real-time testing of innovations on the battlefield, could also attract interest from European partners. Additionally, given limited resources, developing secondary material recycling in Ukraine has become relevant, as demonstrated by the recent experience of the Ministry of Defense. Cooperation in the pharmaceutical sector (if Ukraine secures a “pharmaceutical visa-free regime”) could help the EU replace products from Asia, especially active pharmaceutical ingredients from China.
However, it should be acknowledged that the main prerequisites for realizing this potential are the reduction of security risks and the implementation of reforms, particularly in property rights protection. Key factors for developing production capacities will include expanding the labor supply and restoring the energy sector.
For its part, the EU can facilitate inflow of investment into Ukraine and improve business conditions by ensuring constructive cooperation, particularly in terms of access to EU markets without political and regulatory risks.

Attention
The author doesn`t work for, consult to, own shares in or receive funding from any company or organization that would benefit from this article, and have no relevant affiliations