Using urban nighttime lights as a proxy for economic activity it finds an economically and statistically significant negative effect. The effects, however, are visible at the micro level only, while at the macro level, luminosity of the unrecognized republics moved in parallel with the rest of Ukraine. The column interprets the numbers and offers an explanation why the effects are present at the micro-level only.
The introduction of the full trade ban by Ukrainian government versus so-called DNR and LNR in March 2017 was a highly debated event by the public. The ongoing discussion surrounding it demonstrated that there is no consensus within both public and elites about the policies the government should pursue with respect to economic connections with the so-called separatist republics.
One factor that hinders the discussion is limited evidence about separatist economies. Four years after the conflict started, we still know little. Although several authors from academia (1, 2, 3, 4) contributed to the knowledge about the separatist economies, none of them paid a specific attention to the economic developments happening after the full trade ban. Journalistic (1, 2) investigations and indirect calculations point out that the effect was strong and negative despite the claims of separatists about successful attempts to relaunch the previously idle enterprises. Lack of evidence does not help to make informed decisions and pushes the discussion from the fact-based to a priors-based ground. The aim of the column is to provide a systematic account about the separatist economies with a particular focus on recent developments.
One of the few ways to get insights about economies with absent or questionable statistics is to use nighttime lights as a proxy for economic activity. Notable examples of the approach include an estimation of economic losses in Syria, the effect of sanctions on inequality in North Korea, and an update of production figures in some of the African countries. With respect to Ukraine, the same approach was applied by Coupe et.al and Kochnev.
Similar to them, the note uses the images scanned by VIIRS: an infrared sensor installed on the US meteorological satellite. The sensor scans Earth when the satellite passes the locations at 00:15 local time with a resolution of 742×742 meters at nadir (a point on the surface directly under the location of the satellite). An important quality of the sensor is that it has an onboard calibration and is not subject to saturation assuring the comparability of the images over time. The Earth observation group of the US NOAA collects the images, removes clouds and publishes on their web site free of charge.
Two points are worth emphasizing. First, as sunshine compromises images April to September the images for the whole territory of Ukraine are available only for six out of twelve months per year when the nighttime is long enough. Second, as Chen and Nordhaus noted, the VIIRS tends to capture a lot of a background noise, which could be a product of temporal lights and flares, which are not related to human activity. To deal with the problem, I use only the areas of Ukraine, which are most likely to emit stable lights: cities. To define the urban areas, I use a MODIS dataset: a mask of the Earth’s surface that differentiates the surface of the Earth into urban and rural areas. Although the initial imagery used for the MODIS dataset is of 2002, Figure 1 shows that the strongest light emitters are indeed within the boundaries of the MODIS urban areas.
Figure 1. Luminosity in Eastern Ukraine and Urban Areas.
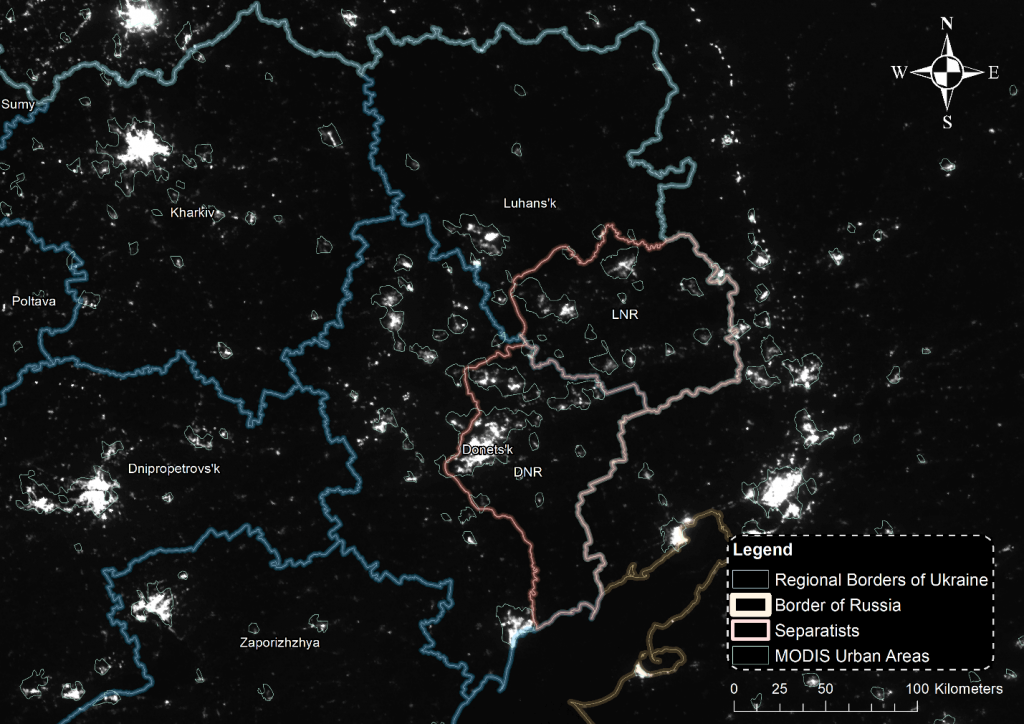
Note: Luminosity as of January 2017.
Sources: Administrative borders by GADM, nighttime images by NOAA, the contact line based on informnapalm.org and mediarnbo.org.
After that I split the remaining areas into a grid with the cells 36 arc-seconds each (roughly 778×778 meters at the longitude of Donetsk) and extract their luminosity values from January 2013 to February 2018. To define the borders of Ukraine and of the separatist-controlled areas, I used the data provided by GADM project and the manually georeferenced maps by Informnapalm.org adjusted for changes reported by mediarnbo.org.
The Big Picture
The resulting dataset contains 16729 unique cells (5358 in Donetsk and Luhansk regions) from January 2013 to January 2018 with gaps between April and October. Figures 2 and 3 give an overview of how luminosity of DNR and LNR changed over time compared to the government-controlled territories and the rest of Ukraine (Crimea not included).
Figure 2. Change of Log Average Quarterly Luminosity in the Urban Areas of Ukraine.
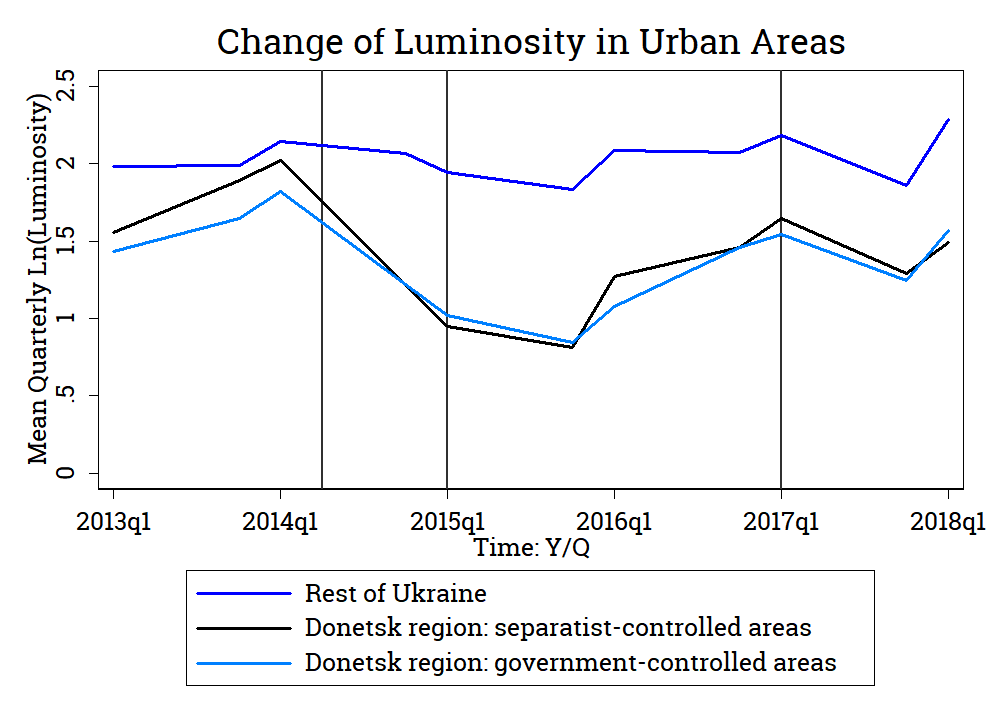
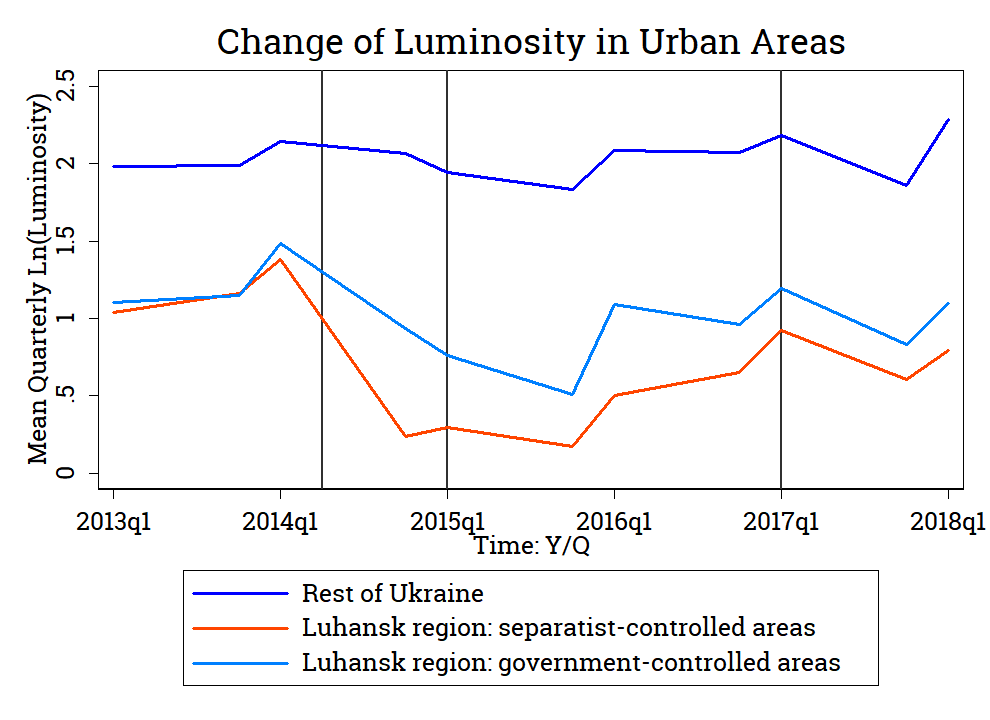
Note: The “Rest of Ukraine” time series includes all regions of Ukraine except of Donetsk, Luhansk, and Crimea.
Sources: Administrative borders by GADM, nighttime images by NOAA, the contact line based on informnapalm.org and mediarnbo.org. Calculations by the author.
The pattern of luminosity changes is generally in line with conclusion made by other observers except of the last period from 2017 to 2018 when the luminosity of all regions went in parallel to each other. It looks as if the impact of the trade ban either was as strong for the rest of Ukraine as it was for the separatist economies, or could be explained by other confounding factors like seasonality or measurement error.
Separatists under a Microscope
Previous analysis implicitly assumed that the effect of the trade ban affects the whole economies of separatists. This might not be true as the trade ban had the strongest effect at the major industrial enterprises that were still operational and paid taxes to the Ukrainian government.
To investigate whether the effect of the trade ban was only local, I georeferenced locations of the enterprises where the separatist authorities introduced an external administration using their addresses found either on the web-sites of the companies or online databases. Out of 46 nationalized enterprises, I kept only industry companies, which presumably had a high number of employees. Figure 3 shows locations of the 26 companies that stayed in the list.
Figure 3. Luminosity in Eastern Ukraine and Urban Areas.
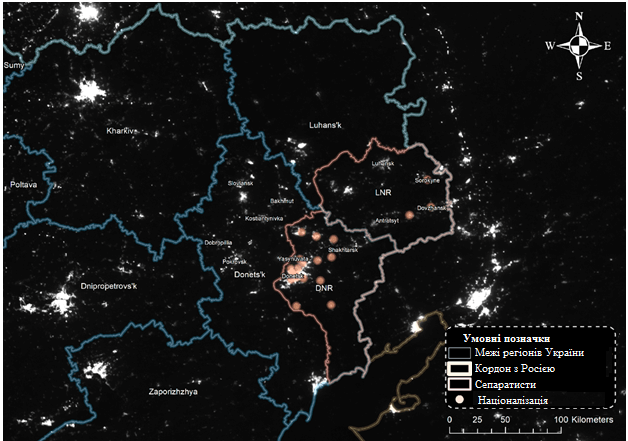
Note: Luminosity as of January 2017.
Sources: Administrative borders by GADM, nighttime images by NOAA, the contact line based on informnapalm.org and mediarnbo.org, list of the nationalized enterprises by euromaidanpress.com, locations georeferenced by the author.
To see whether the cells close to the affected enterprises were influenced by the trade ban, I plotted the yearly growth rates of the cells after the trade ban versus log of distance from every cell to the closest location of an enterprise took over by separatists. If the trade ban indeed negatively affected economy locally, then we should observe a positive relationship between the luminosity growth and the distance of the cell to the enterprises. One would expect – other things being equal – that the farther away is a location from the affected enterprise, the greater should be the luminosity growth.
The red and orange lines on Figure 4 show a trend line that fits the data points “best” in terms of minimizing the total distance between the line and the points. The grey areas show the 95% confidence bounds, which demonstrate whether the induced linear relationship is statistically different from zero.
Figure 4. Average Luminosity growth rates in DNR and LNR from February 2017 to February 2018.
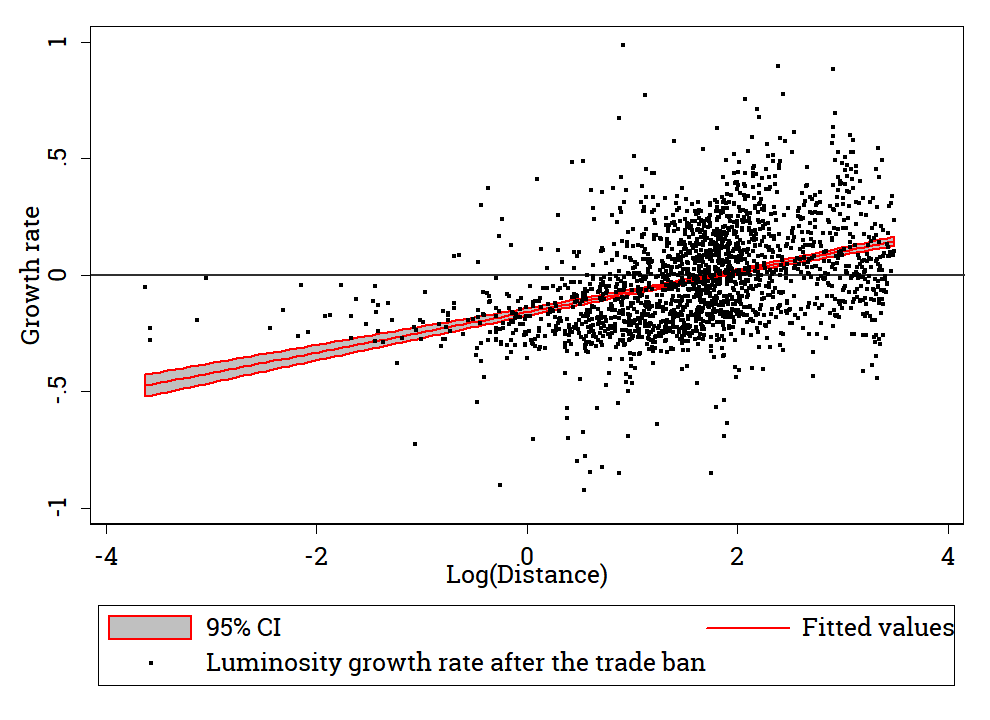
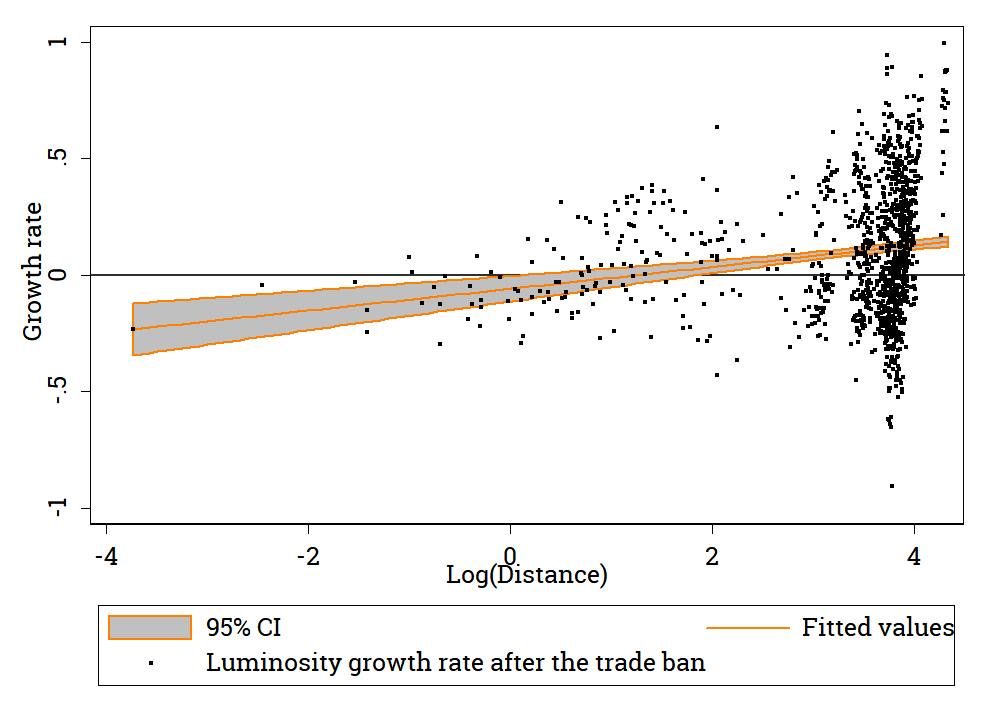
Note: Only cells with growth rates between -1 and 1 and distance between -4 to 4 are shown.
Sources: Administrative borders by GADM, nighttime images by NOAA, the contact line based on informnapalm.org and mediarnbo.org, list of the nationalized enterprises by euromaidanpress.com, locations georeferenced by the author, distance calculated by the author.
Several points follow from the graphs. First, the slope of the linear fit is positive for both DNR and LNR. This implies that the greater is the distance of a cell to an affected enterprise, the greater is the growth rate. The slopes for the linear fit is 0.081 for DNR and 0.049 for LNR. In economic terms, it implies that doubling a distance of a cell to the affected enterprise increases the growth rate by 8.1 percentage points for DNR and 4.9 percentage points for LNR. Both are statistically different from zero at 5% significance level irrespective of whether the standard errors are clustered by districts or not. One should not perceive the result as a counterfactual, however, as the estimations do not account for other characteristics of the cells that could happen over the period. For instance, a regression analysis that takes into account the districts fixed effects lowers the estimations for DNR to 0.073 and LNR to 0.041.
Interpretation
The investigation implies the trade ban indeed was likely to have a negative effect on luminosity of the separatist regions. Yet in terms of the nighttime lights, the impact was mostly local and did not show up on the macro level. This conclusion is at odds with observations done by other investigators and estimated numbers of production of the major industry goods in DNR and LNR (1, 2, 3). According to them, production of anthracite coal dropped by a factor of four: from ten to two million tons per year. If one assumes that mining, manufacturing, and energy sectors in Donbass follow similar trends due to tight value chains established with each other, the effect should be sizable for the whole economy as the three sectors together accounted for one third of the prewar GDP of the region. How to explain the contradicting facts?
My preferred interpretation is based upon the following considerations. As Chen and Nordhaus mentioned, VIIRS images tend to proxy population movements better than GDP. If this conclusion holds for Ukraine as well, it implies the trade ban did not make population move out of separatist territories. This is in line with the number of registered IDPs, which was declining since mid-2016 and the number of the DTEK workers willing to resettle: only 670 out of 36000 employees applied for a resettlement to the government-controlled areas. If this is true, how did people compensate for a falling income level?
Media reports and local news suggest several strategies. First, the population implicitly accumulates debt by postponing payments for energy, heat and public utility payments. According to the head of the public utility services of Roven’ki – the city, where one of the closed coal mines was located – the share of non-paid utilities as of January 2018 was 50%. Other options are to stay at the enterprises under the separatists’ management with a smaller salary, look for other civil employment or engage into ‘informal’ business most likely with the Russian firms. And the last option is to join the armed forces of separatist republics, where one may expect a salary two to four times greater than in the civil sector. None of these cases, however, pushes population of occupied territories towards greater reintegration into Ukrainian economy, politics or civil society. If this is the case, was the trade ban worth it?
Sources
Chen and Nordhaus: mdpi.com/2072-4292/7/4/4937
Coupe et.al: voxukraine.org/en/and-the-lights-went-out-measuring-the-economic-situation-in-eastern-ukraine-en/
Gorodnichenko and Talavera: voxukraine.org/en/hows-dnr-economy-doing-en/
Henderson et.al: aeaweb.org/articles?id=10.1257/aer.102.2.994
Kochnev: wiiw.ac.at/monthly-report-no-5-2018-p-4527.html
Lee: sciencedirect.com/science/article/pii/S0094119017300852
Li et.al: tandfonline.com/doi/abs/10.1080/01431161.2017.1331476
Mirimanova: hdcentre.org/wp-content/uploads/2018/07/2017-study-ENG-web-version.pdf
Annex
Table. List of Selected Enterprises Affected by the Trade Ban
| Region | Group | Name (ENG) | Longitude | Latitude | Industry |
| LNR | Metinvest | Metinvest’s Krasnodonvuhillia – five mines, two enrichment factories | 39.73603 | 48.29536 | Mining, Manufacturing |
| LNR | DTEK | DTEK’s Rovenkyantratsyt – six mines and three enrichment factories | 39.36567 | 48.08893 | Mining, Manufacturing |
| LNR | DTEK | DTEK’s Sverdlovantratsyt – five mines and three enrichment factories | 39.64162 | 48.08183 | Mining, Manufacturing |
| DNR | Donetsksteel | PSC “Donetsk metallurgical plant” (DMZ) | 37.80775 | 48.00639 | Manufacturing |
| DNR | Donetsksteel | Branch “Metallurgical complex” PrJSC “Donetsksteel-metallurgical plant” | 37.80769 | 47.97325 | Manufacturing |
| DNR | Metinvest | JSC Yenakieve Iron and Steel Works (EMZ) | 38.21916 | 48.22072 | Manufacturing |
| DNR | Metinvest | Makiivka metallurgical Plant, branch of Yenakieve Iron and Steel Works | 37.94445 | 48.06095 | Manufacturing |
| DNR | Air Liquid | Air Liquide Yenakieve | 37.78474 | 48.03345 | Gas Manufacturing |
| DNR | Metinvest | Donetskkoks JSC | 37.73951 | 47.97274 | Coke plants |
| DNR | Donetsksteel | Makiivkoks Coking Plant | 37.80685 | 47.98653 | Coke plants |
| DNR | Donetsksteel | Yasynivka Cokery Plant PJSC | 37.92985 | 48.0992 | Coke plants |
| DNR | Metinvest | PrJSC Yenakieve Coke and Chemicals Plant (Koksokhimprom) | 38.2216 | 48.22108 | Coke plants |
| DNR | DTEK | DTEK Komsomolets Donbasu coal mine | 38.40143 | 48.14621 | Coal enrichment factories |
| DNR | Unknown / Efim Zvyagelsky | Public Stock Society Zasyadko Mine | 37.7843 | 48.0549 | Coal enrichment factories |
| DNR | DTEK | DTEK Mospyne Coal Treatment Plant | 38.06166 | 47.87718 | Coal enrichment factories |
| DNR | Victor Chmilev | Kolosnykove central concentrating factory | 37.86604 | 48.03879 | Coal enrichment factories |
| DNR | Donetsksteel | Donetsk Electrical Technical Plant, PJSC | 37.88278 | 47.94539 | Energy companies |
| DNR | DTEK | DTEK Power Grid | 37.80935 | 48.00437 | Energy companies |
| DNR | DTEK | Zuivska thermal power station | 38.29531 | 48.01959 | Energy companies |
| DNR | DTEK | Elektronaladka Ltd | 37.80961 | 48.00841 | Energy companies |
| DNR | DTEK | DTEK Donetskoblenergo PJSC | 37.80668 | 47.998 | Energy companies |
| DNR | DTEK | DTEK Energovuhillia ENE | 37.80935 | 48.00437 | Energy companies |
| DNR | Metinvest | Khartsyzk Pipe Plant | 38.12144 | 48.03668 | Other |
| DNR | Metinvest | Komsomolske Ore Mine Management Board, PJSC | 38.07219 | 47.66305 | Other |
| DNR | Metinvest | Dokuchaevsk Flux-Dolomite Complex (DFDK) | 37.67646 | 47.75938 | Other |
| DNR | OSTCHEM | PJSC Concern Stirol, a chemical plant | 38.07341 | 48.29826 | Other |