This article briefly discusses the Benford’s law and its application for testing Ukraine’s nominal GDP data to fraud and manipulation.
Working day after day with Ukrainian macroeconomic statistics, analysts observe constant reviews of historical data (sometimes quite significant) or unexpectedly large jumps/falls that are difficult to explain (one of recent examples is surprisingly sharp GDP growth improvement in Q4 2016 – from +2.3% yoy in Q3 to +4.8% yoy in Q4). Thus, it is not surprising that experts often have a distrust of statistics. However, there are no other options but to use what we have.
Everyone understands the importance of GDP as a major measure of the state of an economy. Moreover, GDP is an integral component of the other economic measures such as GDP per capita, state balance (% of GDP), and public debt (% of GDP), that are used by policymakers, international financial organizations and foreign investors to compare one country to another. Hence, it is no wonder that there is a temptation to manipulate GDP statistics, especially since the methodology of calculating this indicator is highly complex, and only a few can call themselves experts in this field. In this article we are going to discuss one possible method of testing macroeconomic data for manipulations or fraud that has been successfully applied by auditors with accounting data. This method is based on Benford’s law.
In 2011, Rauch, Göttsche, Brähler and Engel published a quite famous article “Fact and Fiction in EU-Governmental Economic Data”, where they analyzed the European Union (EU) states’ macroeconomic data using the first-digit law (phenomenon) or Benford’s law. They found out, that Greece data deviated the most from Benford’s distribution among all Euro states. Such a conclusion indicates an anomaly in Greek statistics which is consistent with the scandal about data manipulation by Greece – in short, to meet EU requirements, Greece falsified their country statistics. Thus the first-digit law proved to be a good test for cleanliness of not only accounting data but also the macroeconomic statistics. In this paper we apply this finding and examine Ukraine’s nominal GDP for any suspicious deviations.
About Benford’s law
So what is Benford’s law and why does it work? Benford’s law states that “in many naturally occurring collections of numbers, the leading significant digit is likely to be small”. In fact, the law was first discovered by famous astronomer Simon Newcomb (1881), but as often happens, the finding did not receive popularity in those times and it was gradually forgotten. Half a century later, engineer Frank Benford (1938) “rediscovered” the phenomenon and even successfully tested it on 20 different datasets (physical constants, rivers’ surface areas, street addresses, etc.), and the phenomenon now bears his name.
Probably a good approach to understand the first-digit phenomenon is to know how it was discovered. Both Newcomb and Benford noticed that the first pages in logarithm tables that start with digit 1 were much more worn out than the other pages, which is the evidence that digit 1 occurs most commonly in “nature”. To figure out why it is true it is good to look at a logarithmic scale bar (Figure 1).
Figure 1. A logarithmic scale bar

For example, let’s take a range from 1 to 10. A randomly selected number x starts with digit 1 if 1≤x<2 or log 1≤log x<log 2. A number x starts with digit 2 if 2≤x<3 or log 2≤log x<log 3. And so on. As we see the interval [log 1 = 0, log 2 = 0.30) is wider than the interval [log 2 = 0.30, log 3 = 0.48), and if we continue the interval will be smaller and smaller. Approximately, the first interval occupies about 30% of the selected range. The above is true for the ranges 10 to 100, 100 to 1000, etc.
Specifically, according to the law, the significant digits follow the next logarithmic distribution:

or in graphical representation see the Figure 2.
Figure 2. The distribution of first digits, according to Benford’s law
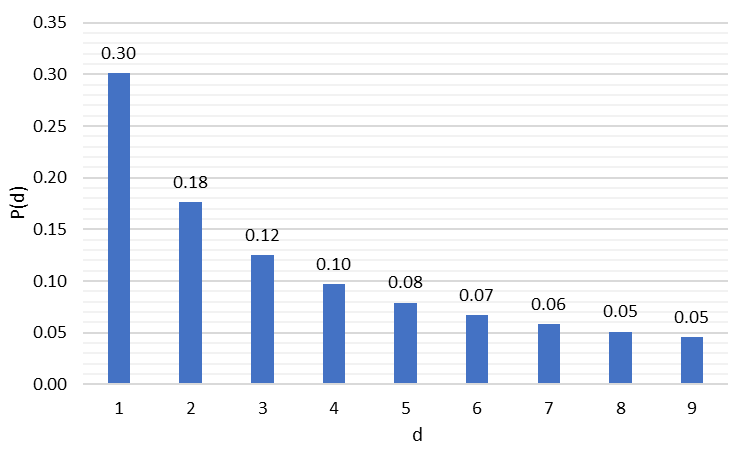
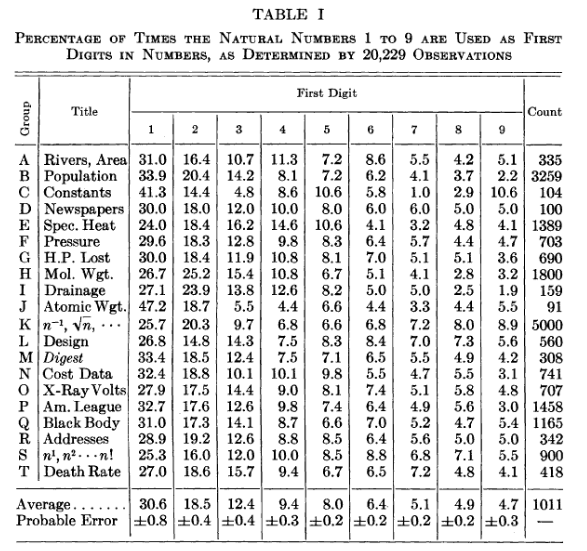
As we see, confirming to the law, in datasets the number 1 occurs as a first-digit in 30% cases, while appearance of digits from 2 to 9 gradually declines. Table I provides Benford’s empirical result that shows how close they are to the theory.
Source: Benford ‘The Law of Anomalous Numbers’ (1938)
Ukraine GDP data
Now we can test Ukraine GDP statistics. We use nominal GDP with a quarterly frequency for the period of time from Q1 2001 to Q1 2014. We take Q1 2001 as a starting point as it is the earliest reported period on the Ukrstat webpage. Ukraine faced significant social and geopolitical turmoil in late 2013 and early 2014, and as a result Crimea and part of Donbas region are not included into the official statistics after Q1 2014. Thereby we do not consider the period after Q1 2014; in this case we preserve data coherency. In order to increase the number of observations, we also include to our analysis the major GDP components (from the expenditure side), such as household consumption, government consumption, investments, exports and imports.
Frequency of the first significant digit of Ukraine’s nominal GDP is provided in Figure 3.
Figure 3. Ukraine nominal GDP: frequency distribution of the first digit
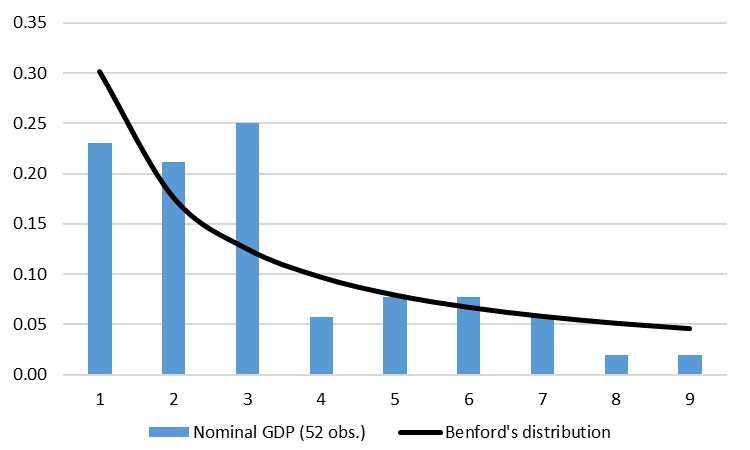
The frequency distribution of the first nominal GDP digit is quite far from the Benford’s distribution. However, the small sample size (52 observations) may be the cause. GDP components solves the problem of the small sample size (Figure 4).
Figure 4. Ukraine nominal GDP components: frequency distribution of the first digit
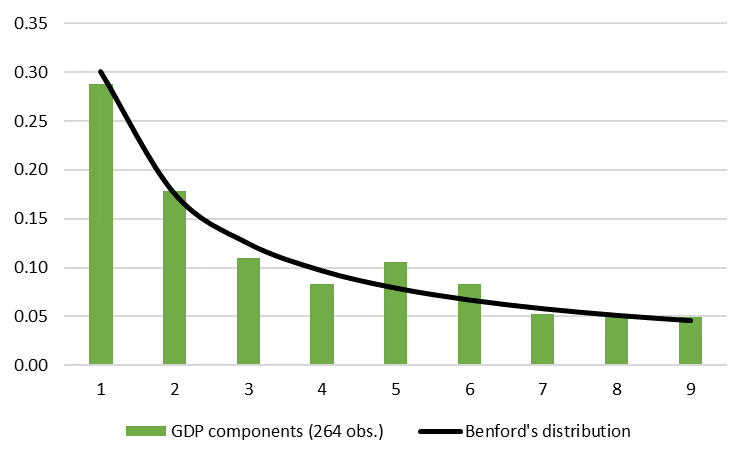
Using nominal GDP components, we managed to increase our sample to 264 observations. It looks like Ukraine’s nominal GDP statistics follows the first-digit law. However, for our analysis it is also important to look at the relative performance of Ukrainian data. Thus, we take GDP statistics for a number of countries and calculate the deviation from Benford’s distribution applying chi-square statistics formula:
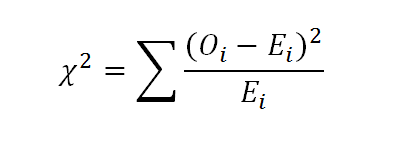
where Oi is observed value and Ei is expected value (Benford’s distribution).
Taking into account the fact that Benford’s distribution is invariant under scale change (Pinkham 1961), we may compare different countries even though their nominal GDP is reported in different currencies. All data was collected from the official websites of the corresponding State Statistic Services. The comparative X2 (Chi-square) statistic reported in the Figure 5.
Figure 5. Comparative Chi-square statistics
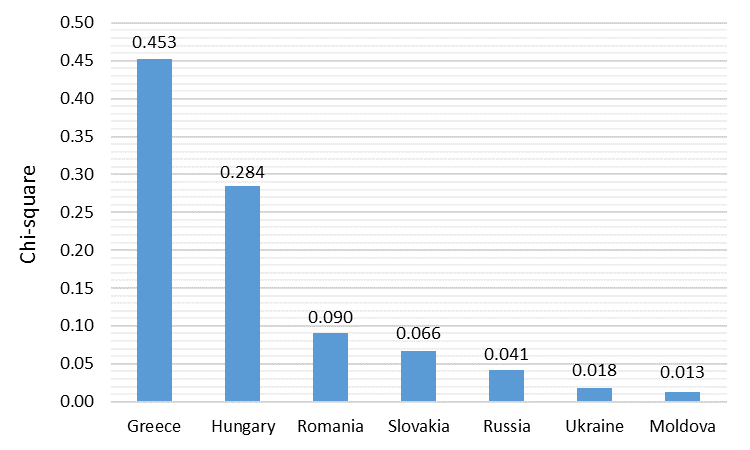
Greece data has the largest deviation from Benford’s distribution, while Ukraine among the selected countries has one of the lowest X2.
Conclusion
Benford’s law proved to be a good instrument for detecting manipulated data in accounting. Recent studies suggest that it may be applied to macroeconomic data as well. In this study we show that Ukraine’s nominal GDP components have one of the lowest deviations from Benford’s distribution across the seven countries included in our analysis (Greece, Hungary, Romania, Slovakia, Russia, Ukraine and Moldova). By contrast, Greece statistics deviate from the theoretical results the most, which confirms the presence of data manipulation disclosed by the European Commission.
In summary, Ukraine’s nominal GDP has successfully passed the first-digit test which indicates that the data is not subject to external interference or manipulations (at least based on the discussed test).
References
Benford, F. (1938), ‘The Law of Anomalous Numbers’, Proceedings of the American Philosophical Society 78, 551–572.
Benford, F. (1938), ‘The Law of Anomalous Numbers’, Proceedings of the American Philosophical Society 78, 551–572.
Benford, F. (1938), ‘The Law of Anomalous Numbers’, Proceedings of the American Philosophical Society 78, 551–572.
Benford, F. (1938), ‘The Law of Anomalous Numbers’, Proceedings of the American Philosophical Society 78, 551–572.
Berger, A., T. P. Hill (2011), ‘Benford’s Law Strikes Back: No Simple Explanation in Sight for Mathematical Gem’, The Mathematical Intelligencer 33(1).
European Commission (2010), ‘Report on Greek Government Deficit and Debt Statistics’.
Newcomb, S. (1881), ‘Note on the Frequency of Use of the Different Digits in Natural Numbers’, American Journal of Mathematics 4, 39–40.
Pinkham, R. S. (1961), ‘On the Distribution of First Significant Digits’, Annals of Mathematical Statistics 32, 1223–1230.
Rauch, B., M. Göttsche, M. Brähler and S. Engel (2011), ‘Fact and Fiction in EU-Governmental Economic Data’, German Economic Review 12(3), 243-255.
Main image: depositphotos.com / bakhtiarzein

Attention
The author doesn`t work for, consult to, own shares in or receive funding from any company or organization that would benefit from this article, and have no relevant affiliations