Because of Russia’s full-scale war against Ukraine, millions of Ukrainians are living abroad. They are gradually finding employment, and their spending via payment cards of Ukrainian banks is decreasing. Via payment of taxes, insurance contributions, and significant consumer demand, our citizens are supporting the economies of recipient countries, primarily Poland, Czechia, and Slovakia. In this article, we talk about the latest trends in migration: from the motivation behind choosing a country of residence to the contribution migrants make to the economies of partner countries.
Number of Ukrainian Migrants
Chart 1. Number of Migrants Since the Start of the Full-Scale Invasion, million people
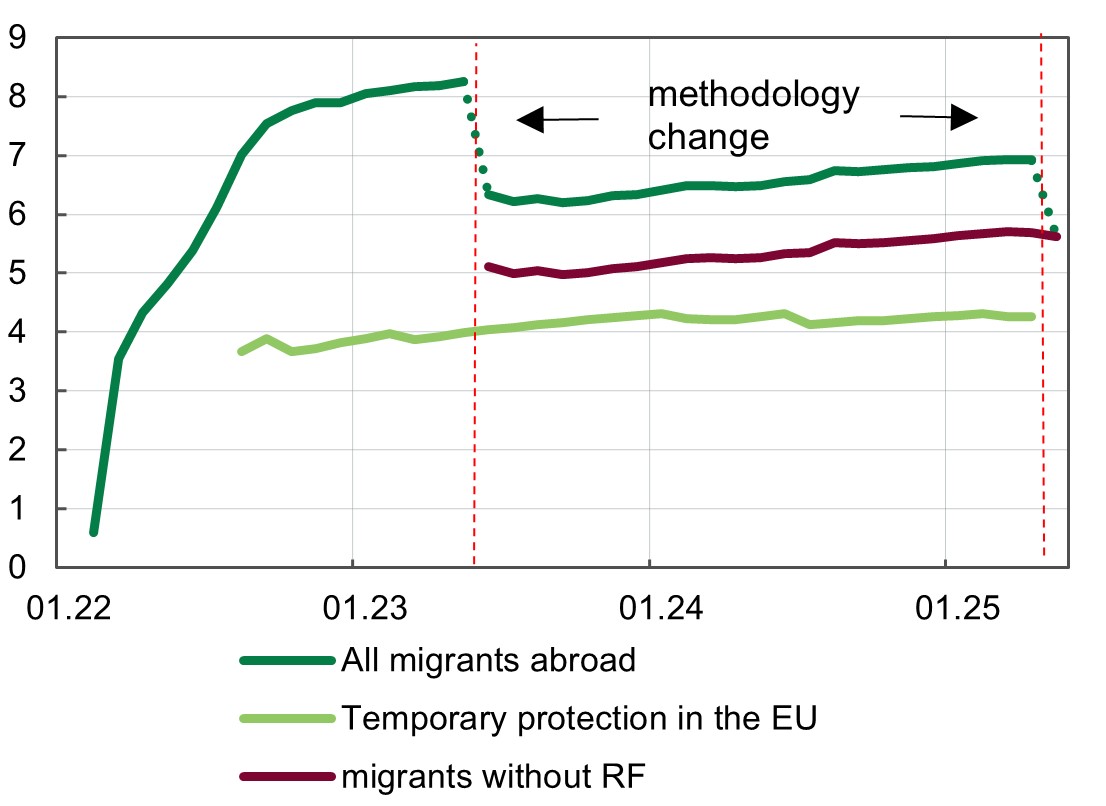
Source: UNHCR, Eurostat
Note. Since the beginning of Russia’s full-scale invasion of Ukraine, the UN has been publishing statistics on the number of Ukrainians who were forced to leave the country because of the war. From February 2022 to May 2023, the estimate was based on statistics of border crossings by migrants. In June 2023, the UN revised its approach: since then the estimate is based on the number of migrants holding temporary protection status (or a similar status) according to reports from recipient countries. Although the net number of border crossings was 8.9 million, the UN’s estimate of the total number of migrants decreased from 8.2 million to 6.3 million—mainly due to a reduction in the number of migrants in Russia and Belarus from 2.9 million to 1.3 million. The UN did not apply the updated approach to previously published data, which makes it impossible to compare the new data with the old one. In May 2025, the UN revised its methodology a second time—excluding data on 1.2 million Ukrainians located in Russia. These include Ukrainians who are in Russia under statuses other than refugee or temporary protection. The Russian government had reported them as refugees from Ukraine (this number may also include individuals forcibly deported to Russia) and had not updated the data since June 2023. The change in the UN’s approach in May 2025 again led to a significant decrease in the total number of refugees. According to the latest UN data, only 7,000 individuals currently hold temporary protection status in Russia.
Chart 2. Number of Ukrainian Migrants in Selected EU Countries with Temporary Protection Status at End of Period, thousand people
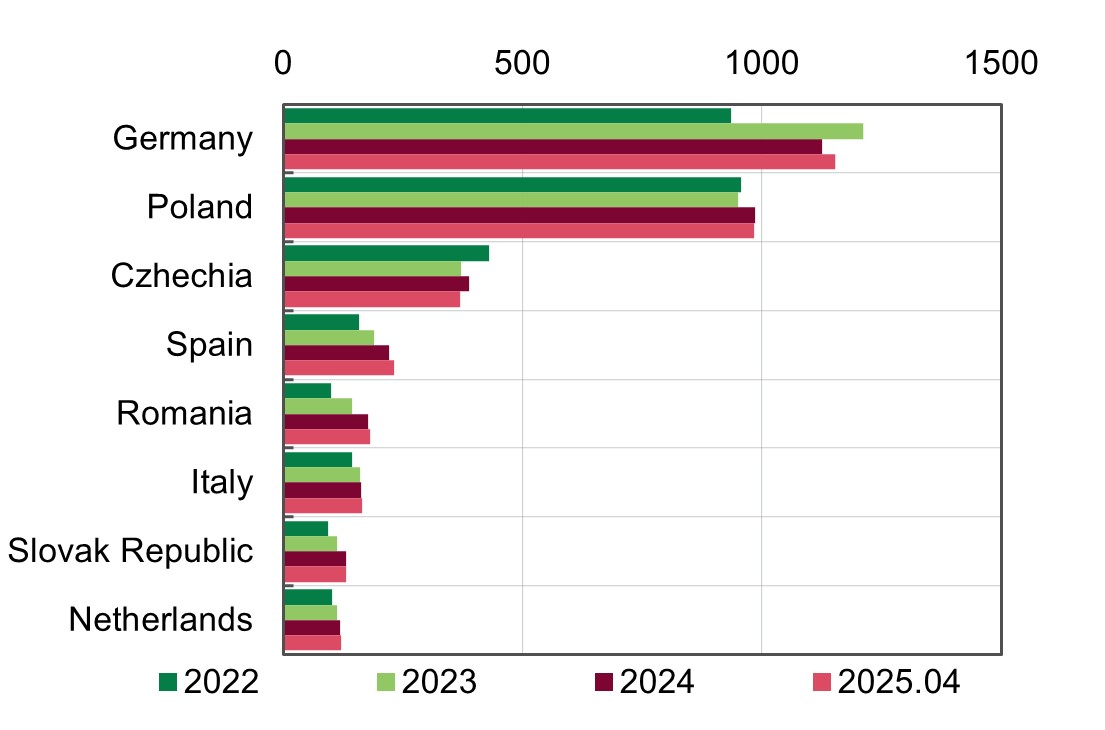
Source: Eurostat
According to the UN, as of the end of May 2025, 5.62 million Ukrainian migrants were residing abroad due to the war (excluding those located in Russia). Of these, as of May 2025, 4.2 million held temporary protection status in the EU, according to the latest available Eurostat data. According to Eurostat, the largest numbers of such statuses were granted by Germany (nearly 1.2 million people), Poland (987,000 people),
Czechia (371,000 people), and Spain (236,000). More than 100,000 Ukrainians are registered in each of the following countries: Romania, Italy, Slovakia, the Netherlands, and Ireland. A REACH survey conducted in 2022 at the Polish border showed that the main factors influencing the choice of destination country were: family or friends at the country of destination (39%), proximity to Ukraine (31%), and advice received at reception centers (17%).
However, over time, macroeconomic conditions, labor market conditions, and the volume of social support in recipient countries began to play a more important role in migrants’ choice of host countries. In particular, higher social support was the reason for relocation of some migrants from Poland to Germany.
According to a UNHCR survey conducted at the beginning of the full-scale invasion, 87% of migrants were women with children, and 65% of those women were of working age (18-59 years old). About 70% of surveyed migrants have higher education.
At the same time, according to the Centre for Economic Strategy, the number of men among migrants has been increasing recently, and some of the migrants are quasi-labor migrants who left the country not only because of the war, but also for work. As a result, more and more migrants are becoming employed, with their incomes recovering nearly to the level of before the full-scale invasion.
Migrants are placing less and less strain on the social protection systems of recipient countries, while their role in these countries’ economies is growing—both due to active participation in local labor markets and because of high volumes of consumer spending.
Using Ukrainian Payment Cards Abroad and Results of the Third Wave of the Banks’ Survey
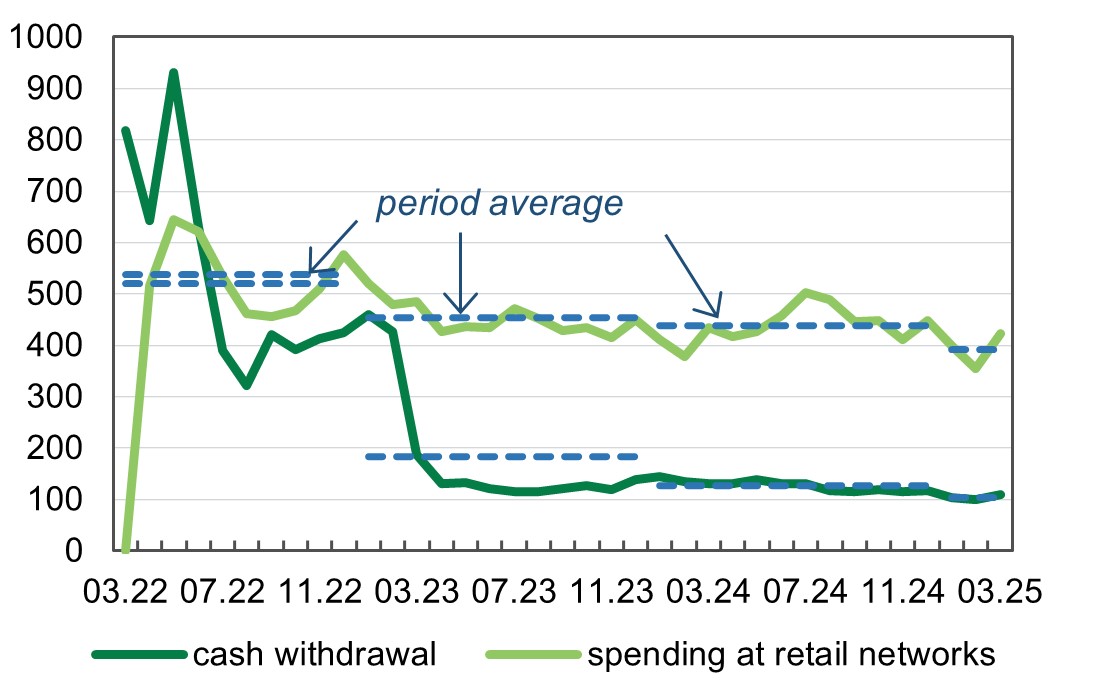
As the employment rate of Ukrainian migrants increases, their spending abroad using Ukrainian cards continues to decline. In the first quarter of 2025, the average monthly volume of transactions at retail outlets amounted to USD 485 million (USD 550 million during 2024 and USD 157 million in 2021). Since March 2023, the decline in the volume of cash withdrawals abroad has slowed. In the first quarter of 2025, the average monthly volume of cash withdrawals amounted to about USD 130 million (USD 155 million during 2024 and USD 40 million in 2021) — see Chart 3.
Chart 3. Selected Transactions with Ukrainian Banking Cards Abroad, USD million
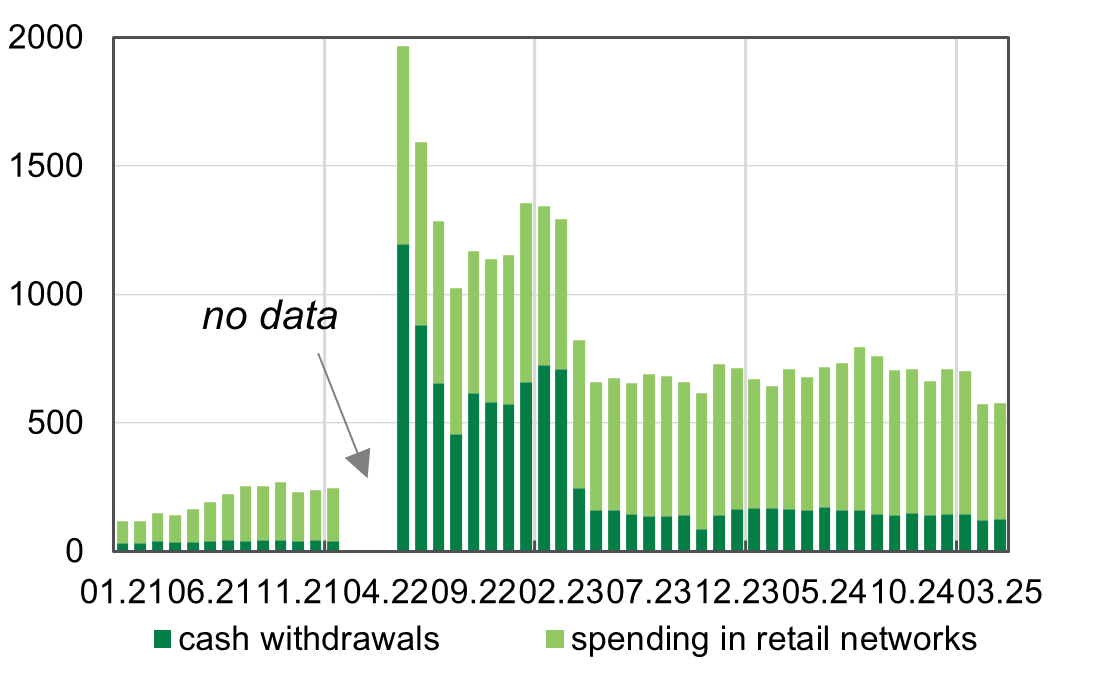
Source: NBU
In April 2025, the NBU conducted another round of surveys with six Ukrainian banks (PrivatBank, Universal Bank, PUMB, Raiffeisen Bank, Oschadbank, and Ukrsibbank) regarding the use of Ukrainian payment cards abroad (Chart 5). The current survey results cover the period from March 2022 to March 2025. The coverage rate of the third wave is 82% for cash withdrawals and 80% for transactions at retail outlets.
The results of the third wave of the survey showed the following:
- The largest volumes of transactions using Ukrainian payment cards abroad, as before, were recorded in Poland and Germany. At the same time, spending by Ukrainians in a given host country is not proportional to their numbers there, which may be explained by the availability and amount of social benefits, as well as the employment level among Ukrainian migrants. In particular, about 20% of Ukrainian migrants reside in Germany, while in the first quarter of 2025, only 10% of the total value of card transactions was recorded there (see Chart 4).
Chart 4. Geographic Breakdown of Migrants and Their Spending at Retail Outlets, % (Top 13 Countries = 100)
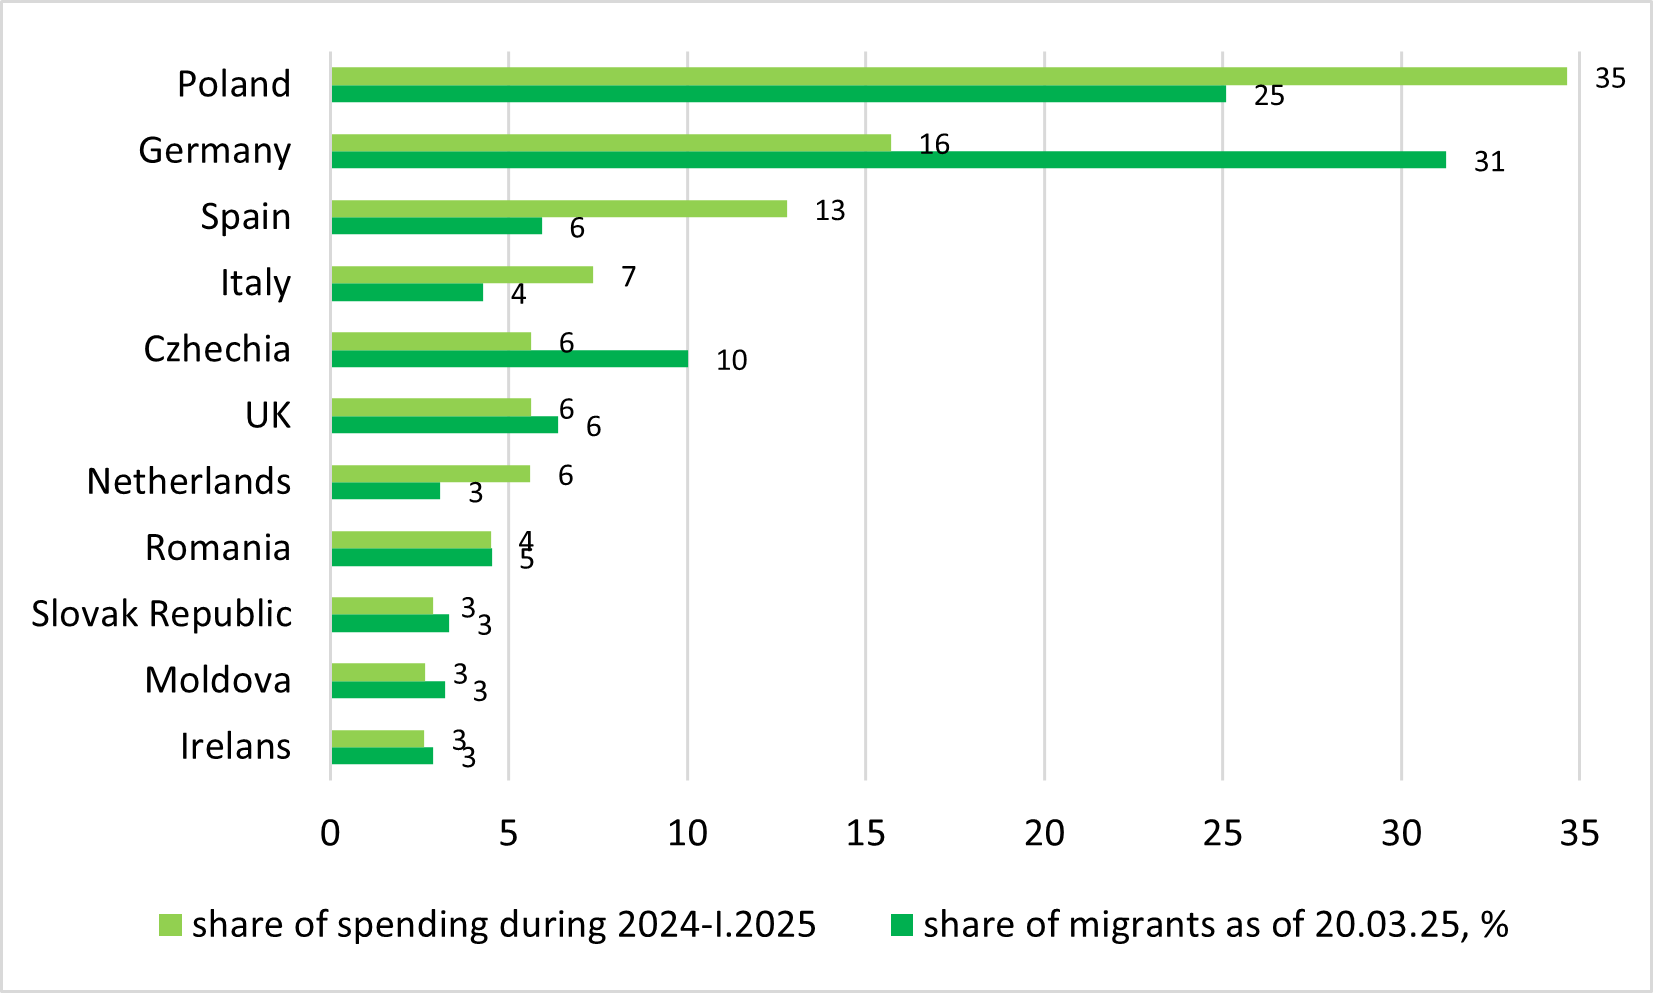
Source: UNHCR, NBU survey
- Despite a certain decline, overall migrant spending at retail outlets abroad remains high. The geographic structure of spending has remained relatively stable since the beginning of the full-scale invasion. About 20% of total spending takes place in Poland, 10% in Germany, and 8% in Spain (see Chart 6).
Chart 5. Transactions with Ukrainian Banking Cards Abroad (Based on Data from Six Banks), USD million
Source: NBU survey
Chart 6. Geographic Breakdown of Migrant Spending at Retail Outlets, % (Top 10 Countries = 100%)
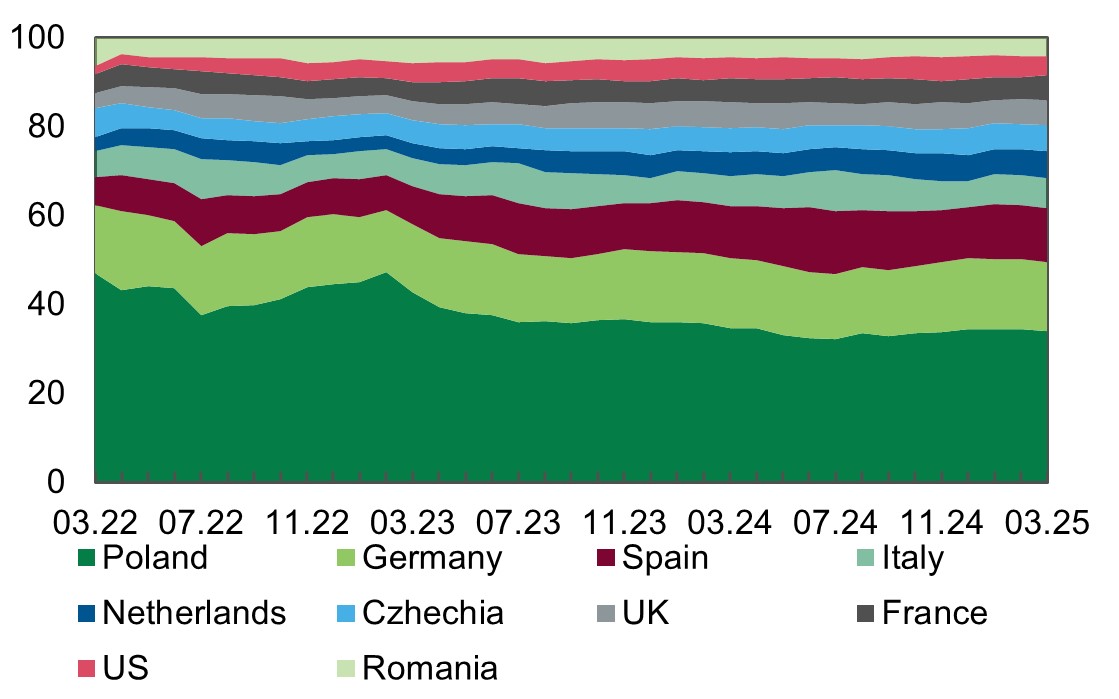
Source: NBU survey
- Due to enhanced effectiveness of financial monitoring measures and foreign exchange supervision, as well as a narrowing of the gap between the official and cash exchange rates, the volume of cash withdrawals abroad declined significantly in 2023 and has remained stable since July 2023. Compared to 2021, this level is still significantly higher: in 2021, the average monthly volume of cash withdrawals was USD 40 million, whereas in the first quarter of 2025 it reached USD 130 million (see Chart 3).
Chart 7. Structure of Cash Withdrawals Abroad, % (Top 10 Countries = 100%)
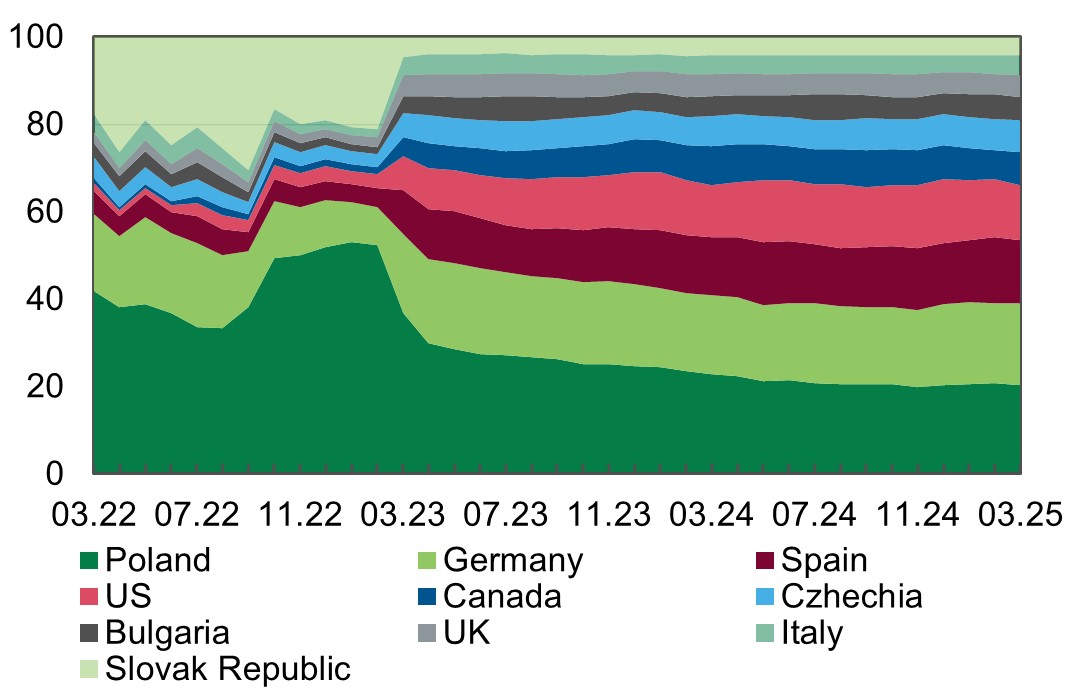
Source: NBU survey
Employment of Ukrainian Migrants Abroad
Ukrainians are increasingly finding employment abroad. According to the SEIS survey, in 2024 the employment rate of Ukrainian migrants rose significantly compared to 2023 in most countries and increased by 9 percentage points at the regional [1] level — to 64%. This figure is now only 7 percentage points lower than the equivalent weighted average for the population of host countries (71%). Taking into account the decrease in overall unemployment, the labor force participation rate among migrants in 2024 was 70%.
At the same time, employment levels vary across countries. In 2024, the employment rate of Ukrainian forced migrants in Poland ranged from 53% to 71%, according to various estimates; in Czechia, it was around 60% (approximately 30% of Ukrainian migrants there have more than one job); and in Romania, it was at 43%. High employment rates are observed in countries that have so far focused on providing temporary shelter rather than long-term integration of migrants. In these countries, migrants are quickly employed without substantial qualification requirements. As a result, a large share of Ukrainian migrants find themselves in low-skilled jobs, often below their level of education and qualifications.
The occupational structure of employment has remained largely unchanged: most individuals with temporary protection still work in low-skilled positions such as laborers in construction or manufacturing.
The lowest employment rates are observed in countries that provide high levels of social benefits. For example, Germany has one of the lowest employment rates of Ukrainians — around 25% — which can be attributed to its social insurance system, considered the most generous among all the countries hosting Ukrainian refugees. A Ukrainian in Germany can receive approximately EUR 950 per month (Bürgergeld plus housing support). A single mother with one child likely receives about EUR 1,300 per month, or roughly EUR 15,000 per year. By comparison, in Austria an individual receives about EUR 420 per month, while in Italy and France the amount ranges from EUR 300 to 400 per month—or about EUR 4,000–5,000 per year.
Language barriers and qualification mismatches further complicate integration of Ukrainians into European labor markets. Respondents with an intermediate level of local language proficiency reported nearly twice the employment rate compared to those with no language skills (9% of respondents). Even Ukrainians with only basic language skills (28% of the sample) show a noticeable increase in employment compared to those with no knowledge of the local language at all.
At the same time, education level does not seem to be a decisive factor in employment, as employment rates among Ukrainian migrants are nearly the same across all levels of education. This can be explained by obstacles to the recognition of foreign qualifications (including Ukrainian ones) by host countries, as well as other barriers that limit access to highly skilled employment — such as language proficiency and mismatches between qualifications and local labor market demand.
Data from Slovakia’s government Institute for Financial Policy shows that a significant share of Ukrainian migrants are employed in positions that do not require higher education, representing untapped potential in this labor force. Specifically, up to 7.8% of emigrants and 4.2% of labor migrants with higher education were working as auxiliary or unskilled workers. In addition, 13.7% of labor migrants and 5.9% of emigrants with higher education were employed as machine operators. Thus, the relatively high employment rate of Ukrainian migrants in certain European countries—around 50% in the United Kingdom, the Netherlands, and Lithuania in the fourth quarter of 2022—comes at a cost: many highly qualified Ukrainians are forced to accept low-skilled, unstable, and usually low-paid jobs.
As a result, the average wage level of refugees remains significantly lower than that of the local population. Despite a 28% increase in the regional weighted average wage of migrants in 2024, it is still 30% lower than the average wage of locals. In Poland, for example, wages for Ukrainians grew faster than those for Poles (51% compared to 46% over 2019–2023), yet they remain noticeably lower — by 15% in 2023.
The 2024 SEIS survey (Socio-Economic Insights Survey published on March 17, 2025, based on responses from 8,723 households representing 19,803 individuals) shows that, despite a reduction in the financial vulnerability of Ukrainian forced migrants, one in five still has an income below the poverty line. The situation becomes even worse if we take into account very high housing costs. Due to high homeownership rates among local residents — and hence the tight rental market — migrants spend a significant share of their income on accommodation. When housing costs are accounted for, their poverty rate [2] rises to 40%—more than three times higher than that of host communities.
Impact of Ukrainian Migrants on Host Country Economies
Analysis and a review of research show that the presence of a significant number of migrants from Ukraine has a positive impact on the GDP and budgets of host countries. For example, according to a study by Bank Gospodarstwa Krajowego (BGK), Ukrainians contribute more to Poland’s state budget in taxes than they receive in social assistance.
In 2024, Ukrainians, who accounted for about 5% of all workers in Poland, contributed approximately PLN 15.1 billion (EUR 3.6 billion) to the Polish state budget through taxes and social insurance contributions. At the same time, following a significant reduction in direct cash assistance to Ukrainian migrants as of July 1, 2024, a large share of support—around PLN 2.8 billion (approximately EUR 0.7 billion)—was provided to them through Poland’s primary child benefit program.
Ukrainians contribute to Poland’s GDP by increasing consumption and boosting trade with Ukraine. At the same time, they also send remittances back to Ukraine, though at a relatively modest scale. According to various estimates, Ukrainians account for between 0.5 and 2.4 percentage points of Poland’s annual GDP growth. A study by the National Bank of Poland found that their contribution to GDP growth rose from 0.5 percentage points during 2013–2018 to 0.7–1.1 percentage points in 2023. A Deloitte study for UNHCR states that the Polish economy quickly adapted and integrated a large number of Ukrainian migrants into its labor market, which in turn supported productivity growth. These factors helped offset any negative effects of increased labor market competition. As a result, in 2024, value added generated by Ukrainian migrants accounted for 2.7% of Poland’s GDP.
Thanks to the strong participation of migrants in the Czech Republic’s domestic labor market, the overall revenue–spending balance for the Czech economy is positive: in the long term, individuals with temporary protection are expected to contribute more than they receive. Government spending on support of Ukrainian refugees includes, among other things, humanitarian aid, which since September 1, 2024, has also covered rental assistance due to the expiration of the free accommodation period. In addition, as of February 2025, the benefit for persons with disabilities was increased. Expenditures also include support for healthcare and education.
In their turn, migrants contribute to the state budget through social insurance contributions, value-added tax (VAT), excise duties, and other revenue streams. Czech experts expect that in the near future, revenues generated by Ukrainian migrants will continue to grow, while expenditures on their support will gradually decline. This forecast is based on trends observed in previous years.
For example, in 2022, expenditures on Ukrainian migrants amounted to CZK 25 billion (over EUR 1 billion), while their contributions to the budget totaled CZK 12.6 billion (approximately EUR 0.5 billion). By 2023, the balance between expenditures and revenues had nearly leveled up: expenditures stood at CZK 21.6 billion (around EUR 0.9 billion), and revenues at CZK 21 billion (EUR 0.8 billion). In the first half of 2024, the Czech Republic recorded a net gain of CZK 4.4 billion (EUR 0.2 billion) from taxes and social insurance contributions paid by Ukrainian forced migrants, after accounting for expenditures: support-related spending amounted to CZK 7.3 billion (EUR 0.3 billion), while revenues reached CZK 11.7 billion (EUR 0.5 billion).
According to estimates by Slovakia’s governmental Institute for Financial Policy, Ukrainian forced migrants have paid more in taxes and contributions than Slovakia has spent on supporting them. Between 2022 and 2024, Slovakia’s gross public spending on assistance to Ukrainian migrants exceeded EUR 590 million, of which more than 65% was reimbursed through EU funds. These expenditures primarily covered initial integration support, housing subsidies (EUR 118 million), and costs related to integrating Ukrainian minors into the education system (EUR 75 million). In addition, the Slovak Republic provided humanitarian aid directly to Ukraine during the first year of the full-scale invasion. By September 2024, total spending on assistance to Ukrainian migrants and education for their children had reached 0.41% of GDP, of which 0.35% of GDP was refinanced through EU funds.
According to the Institute for Financial Policy, financial assistance to Ukrainian migrants decreased significantly in 2024—from EUR 231 million to EUR 98 million—primarily due to reduced housing support. At the same time, Ukrainian migrants continue to increase Slovakia’s annual tax revenues by 0.1–0.2% of GDP. The largest share of these revenues comes from labor market-related taxes, which are projected to reach EUR 165 million in 2025. Consumption tax revenues are also expected to rise, reaching EUR 78 million. Total tax revenues related to Ukrainian migrants are forecast to grow to EUR 231 million in 2025.
A Significant Number of Ukrainians Abroad Have Become Part of a New Reality
Ukraine’s future depends on how effectively key migration trends are taken into account.
The impact of migration on the Ukrainian economy and the prospects for the return of Ukrainians were among the central topics at the 9th NBU–NBP Annual Research Conference, held in Kyiv on June 19–20, 2025.
The event brought together researchers, policymakers, and practitioners to explore the opportunities and challenges of economic and financial integration during wartime and the postwar recovery period.
[1] The SEIS study includes Bulgaria, Czechia, Hungary, Moldova, Poland, Romania, Slovakia, Estonia, Latvia, and Lithuania.
[2] The poverty rate is defined as the share of the population with an income below the poverty line. For the purposes of this analysis, the poverty line is set at 50% of the median equivalised monthly income in the host country. This approach is consistent with Eurostat’s at-risk-of-poverty (AROP) methodology.
Photo: depositphotos.com/ua


Attention
The authors do not work for, consult to, own shares in or receive funding from any company or organization that would benefit from this article, and have no relevant affiliations