Russia’s attack on Ukraine has caused staggering human suffering and destruction. Since the full-scale invasion started, many Western leaders have pledged to ‘stand with Ukraine’ and announced major military and humanitarian support. In this column, I ask the following questions: What do the numbers say? How large is the support for Ukraine? Who are the most supportive governments? And what type of support do countries offer – military, humanitarian, and/or financial aid? The answer to these questions is often imprecise.
In the initial months of the war, the debate mainly focused on sanctions and other measures to hurt Russia (e.g. Bachmann et al. 2022); less attention was devoted to measures in support of Ukraine. Recent months, however, have a series of important contributions on aid to Ukraine and the required reconstruction efforts (Becker et al. 2022, Rashkovan and Eichengreen 2022, Shapoval et al. 2022). Nevertheless, systematic data remain scarce.
A systematic database on foreign support to Ukraine
The Ukraine Support Tracker by the Kiel Institute of the World Economy lists and quantifies the support of 40 donor governments plus that of the EU institutions (Trebesch et al. 2023) *. In the most recent update, we trace aid commitments between 24 January 2022 (the day several NATO countries put their troops on alert) and 15 January 2023. Our main contribution is to quantify the scale of aid to Ukraine in millions of euros or as percent of donor GDP, which allows for systematic comparisons across countries. We trace both financial and in-kind transfers and create a comprehensive ‘consensus’ database that brings together information from official government sources, existing lists of Ukraine aid, and media reports, now covering more than 1,000 individual donations. To quantify in-kind aid such as weapon shipments or ‘tonnes of foodstuff’, we assign a monetary value to each item using market prices and data on previous instances of international aid deliveries. The resulting database with sources is fully and freely available.
We mainly focus on bilateral (government-to-government) commitments transferred to Ukraine. This means that not all types of support are covered. In particular, in our baseline figures we do not add the costs of helping refugees who have fled Ukraine (but we do show results in additional figures). We also do not count private donations, mainly because reliable information across countries is not available. For international financial institutions like the IMF or the World Bank, we do track their support but report these results separately.
A main challenge for the quantification of aid flows is data transparency. We do our best to list and quantify all support measures that have become publicly known. But not all donations do become public. For better comparability across countries, we therefore create a ‘data transparency’ index that measures how detailed each government’s information on their Ukraine support is. We find considerable variation across countries, with some governments – such as France, Spain, and Poland – being rather opaque on their support (see Appendix Figure A1). The average scope of information sharing, however, is high, with often very detailed lists on donations and data availability, and transparency has clearly improved over the course of the war.
* Specifically, we trace commitments by 41 donors, including all G7 and EU member countries (31), plus Australia, New Zealand, Norway, South Korea, Switzerland, Turkey, India, China and Taiwan (9). In addition, we trace commitments by the EU institutions (i.e. the European Commission and EU Council), but also via the European Peace Facility (EPF) and the European Investment Bank (EIB).
The US and Eastern European countries stand out
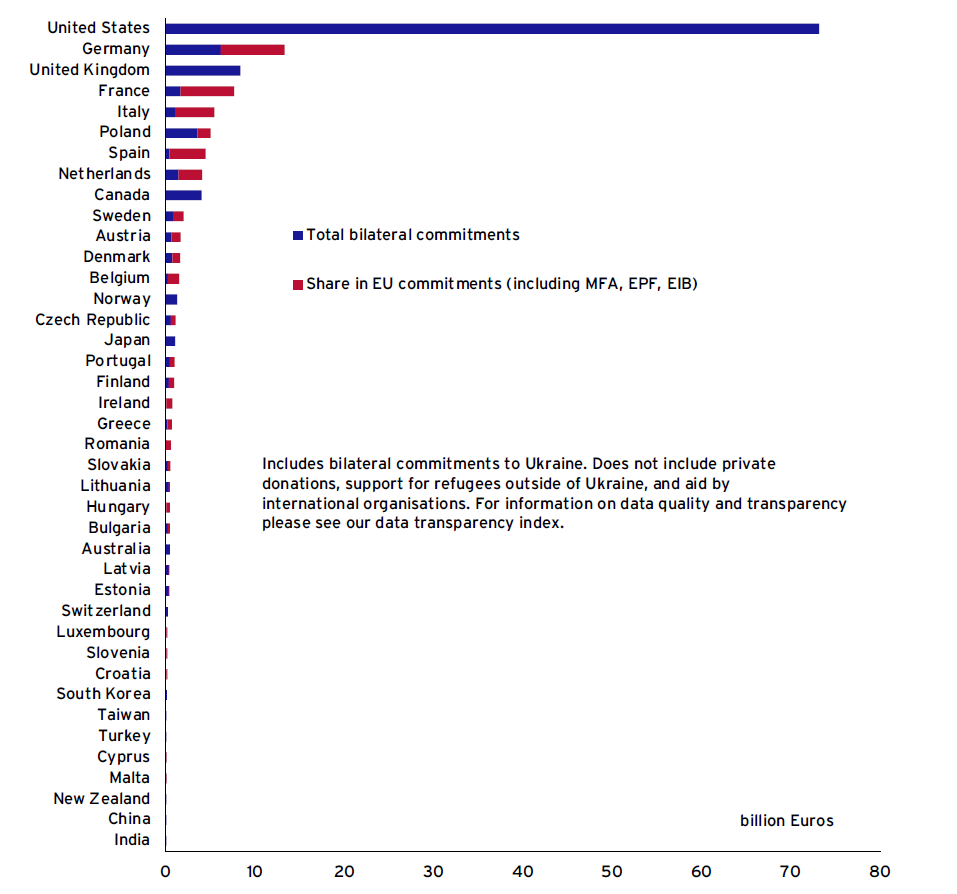
Figure 1 shows the first key insight – a breakdown of aid to Ukraine by donor group. In total, we trace over €144 billion in government-to-government commitments from 24 January 2022 until 15 January 2023. The US is by far the largest bilateral supporter of Ukraine, having committed €73.18 billion, more than 50% of the total commitments in our database. EU country governments committed a total of €20.1 billion bilaterally, plus €29.92 billion through the European Commission and Council, €3.1 billion via the European Peace Facility, and €2 billion through the EIB. This brings total EU commitments to €55.12 billion. It is remarkable that the US alone has committed considerably more than all EU countries combined, in whose immediate neighbourhood the war is raging.
FIGURE 1 AID COMMITMENTS TO UKRAINE ACROSS DONOR GROUPS (IN € BILLION)
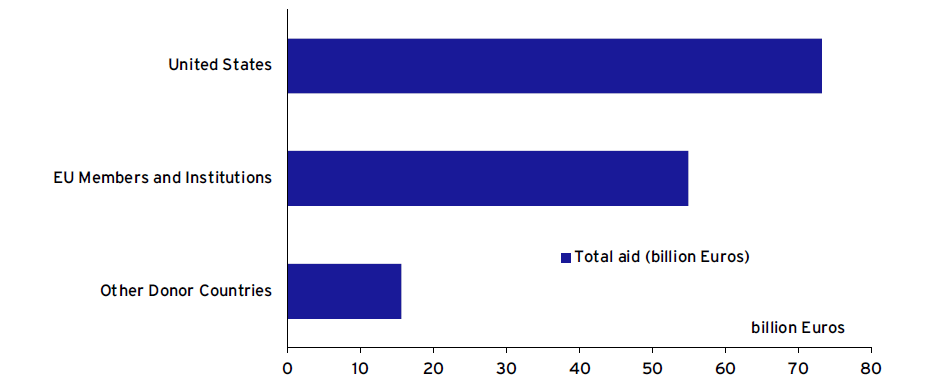
Note: This figure shows total bilateral aid commitments to Ukraine across different donor groups between 24 January 2022 and 15 January 2023. Other donor countries include the Anglo-Saxon countries (except the US), as well as China, Japan, South Korea, Taiwan, Turkey, Norway and Switzerland and India.
Figure 2 shows that there is striking variation in the bilateral support across countries. The US clearly stands out, followed by the EU institutions, and then the UK, and Germany. When we assign the EU commitments to the EU member countries, the overall patterns look similar, although some countries – such as Italy and Spain – move up the ranking considerably (see Appendix Figure A2).
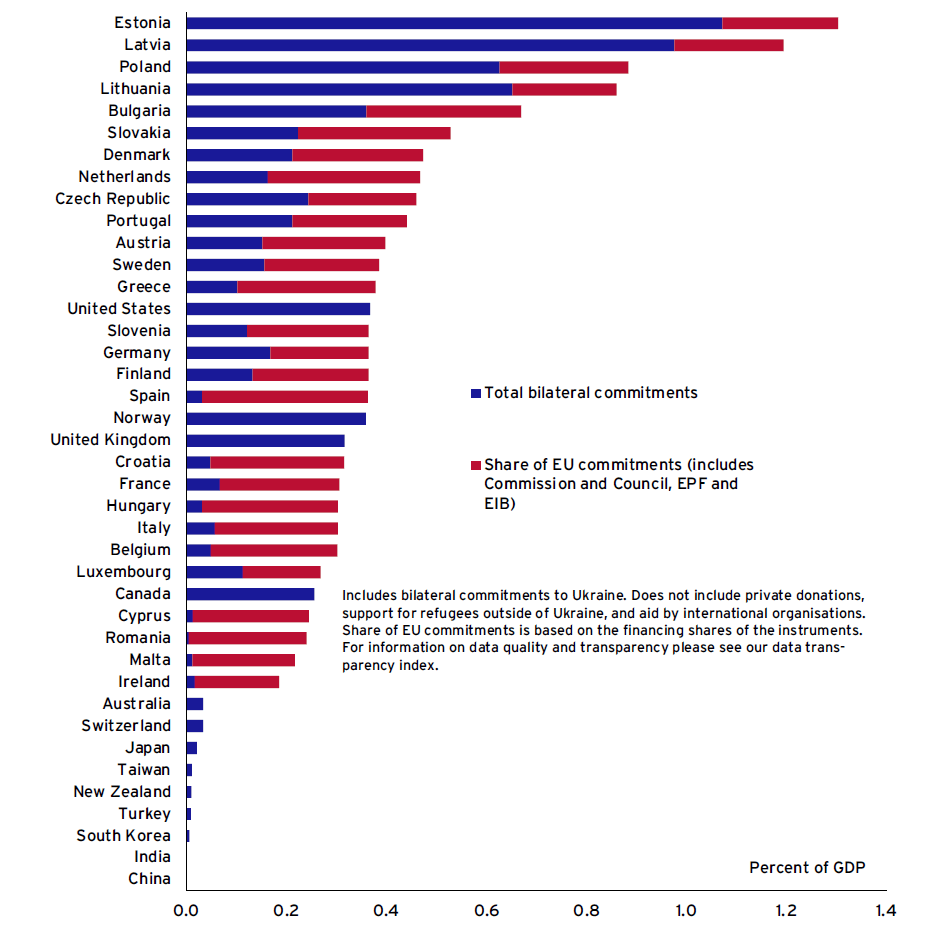
When measured as a percentage of donor GDP, the support of Eastern European countries stands out (Figure 3). The Baltic countries, Poland, the Czech Republic, and Bulgaria rank high, but the US is also among the top five donors when measured as a percentage of country GDP. The large US commitments, both in absolute and relative terms, are striking.
It is also striking that some of the richest Western European countries appear in the bottom third. Spain and Italy, for example, made bilateral commitments of just 0.06% and 0.03% of their GDP, respectively, according to our data. Other large countries such as Poland, the US, and the UK have committed up to ten times as much aid as a share of GDP. As shown in Figure A1, Spain and Italy are non-transparent, but even if the true scope of their support was twice as high than what has become publicly known – an unlikely scenario – then they would still rank in the bottom half. The same is true when reassigning EU-level aid to each EU country and then recalculating aid as a percentage of GDP (Figure A3).
FIGURE 2 TOTAL BILATERAL COMMITMENTS BY TYPE OF ASSISTANCE (€ BILLION)
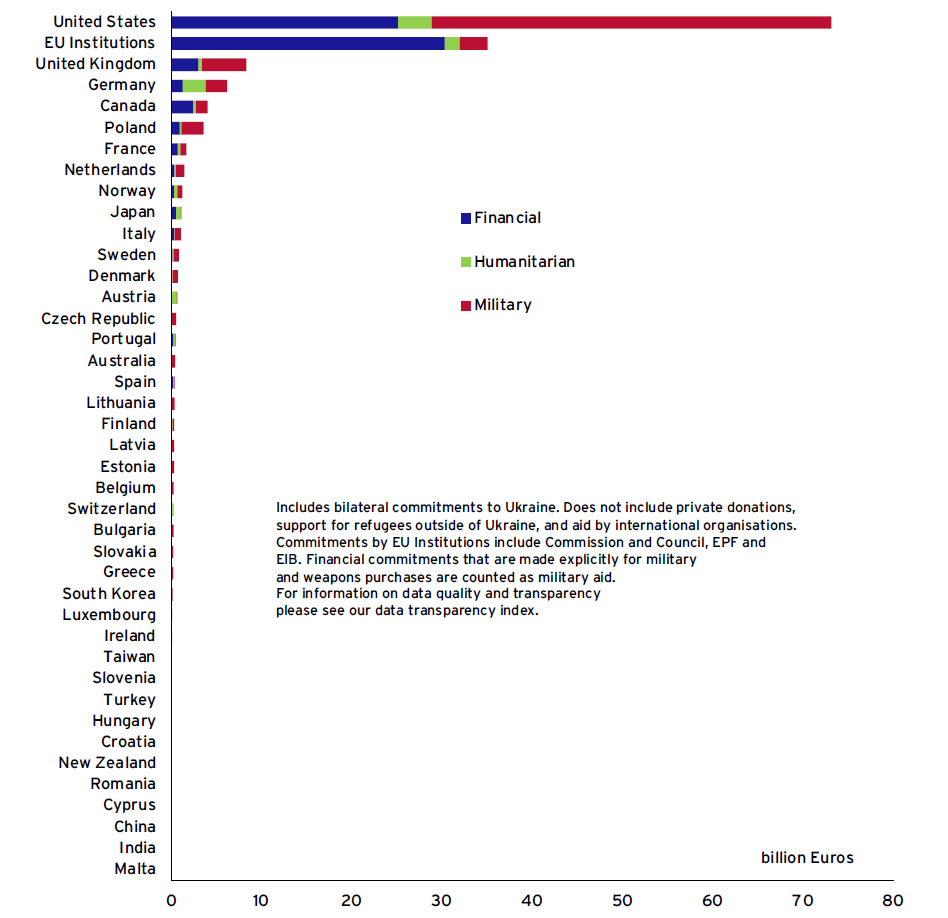
Note: This figure shows total bilateral aid commitments to Ukraine across donors in € billion (covering 24 January 2022 to 15 January 2023). Each bar shows the type of assistance, i.e., financial (blue), humanitarian (green), and military (red) aid. Cost estimates for hosting refugees are added in Figure 7 below.
FIGURE 3 BILATERAL COMMITMENTS AS A PERCENTAGE OF DONOR COUNTRY GDP
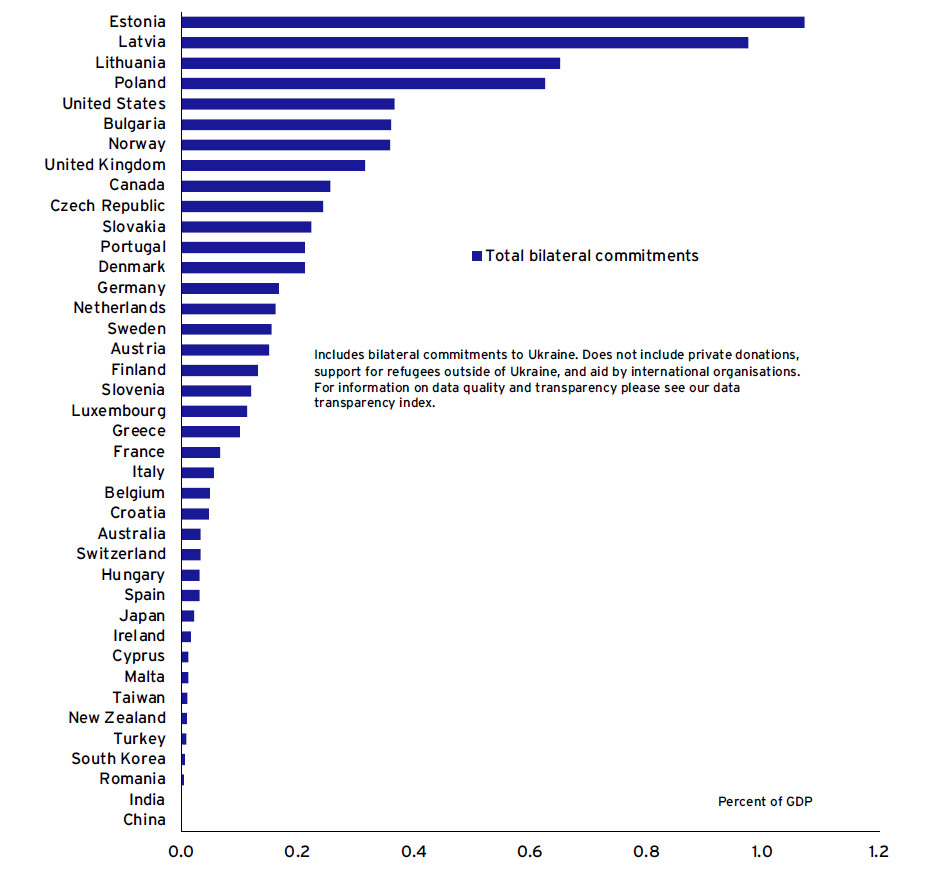
Note: GDP data for 2022 is from the World Bank.
Once we add estimates on the cost of hosting Ukrainian refugees over the year 2022, the distance between Eastern and Western European countries grows further (Figure 4, using estimates on refugee costs by the OECD 2022). Now eight out of the top ten supporters of Ukraine are Eastern European countries, while countries like France, Italy and Spain rank even further down.
FIGURE 4 ADDING THE COST OF HOSTING REFUGEES (TOTAL SUPPORT AS A PERCENTAGE OF DONOR GDP)
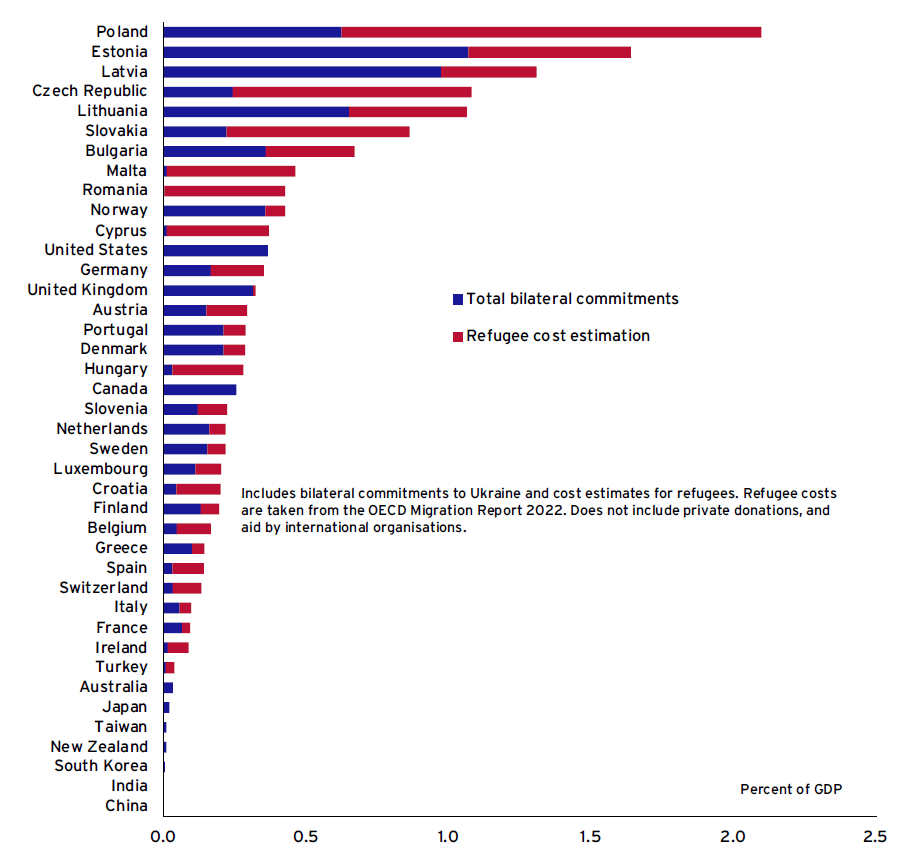
Note: This figure complements our main Figure 2 by adding estimates on the cost of hosting refugees from OECD (2022). GDP data (current US$) are taken from the World Bank.
New commitments are cyclical and often arrive with a delay
Figure 5 tracks aid over time and shows that commitments have been highly cyclical in 2022. After a strong increase in pledges after February, newly announced aid fell to almost zero over the summer, only to increase strongly again in the end of the year.
FIGURE 5 TOTAL BILATERAL ASSISTANCE, JANUARY TO DECEMBER 2022 (€ BILLION)
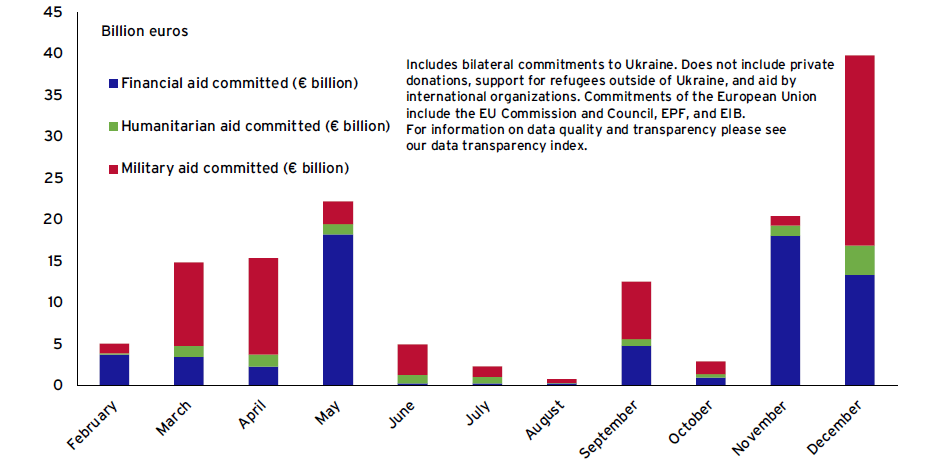
Note: This figure shows total bilateral aid commitments to Ukraine for all entries for which the commitment month is known.
Finally, we find that promised commitments are often disbursed with a delay. This can best be shown for financial aid, as we can combine our own data on commitments with detailed disbursement data provided by the Ukrainian Ministry of Finance. Figure 6 shows a very large gap between commitments and disbursements, in particular for the two largest donors – the EU and the US – which have each disbursed less than 50% of their total financial pledges.
The cyclicality and delays in foreign support shows the urgent need for better coordination of Western aid to Ukraine. Thus far, aid flows have been hard to predict and aid announcements often erratic and uncoordinated. A central agency and/or platform would be a major improvement to allow Ukraine to plan ahead and make sure its most urgent financial, military, and humanitarian needs are addressed (see also Rashkovan and Eichengreen 2022).
FIGURE 6 FOREIGN BUDGETARY SUPPORT: COMMITMENTS VERSUS DISBURSEMENTS, 24 JANUARY 2022 TO 15 JANUARY 2023 (BILLION EUROS)
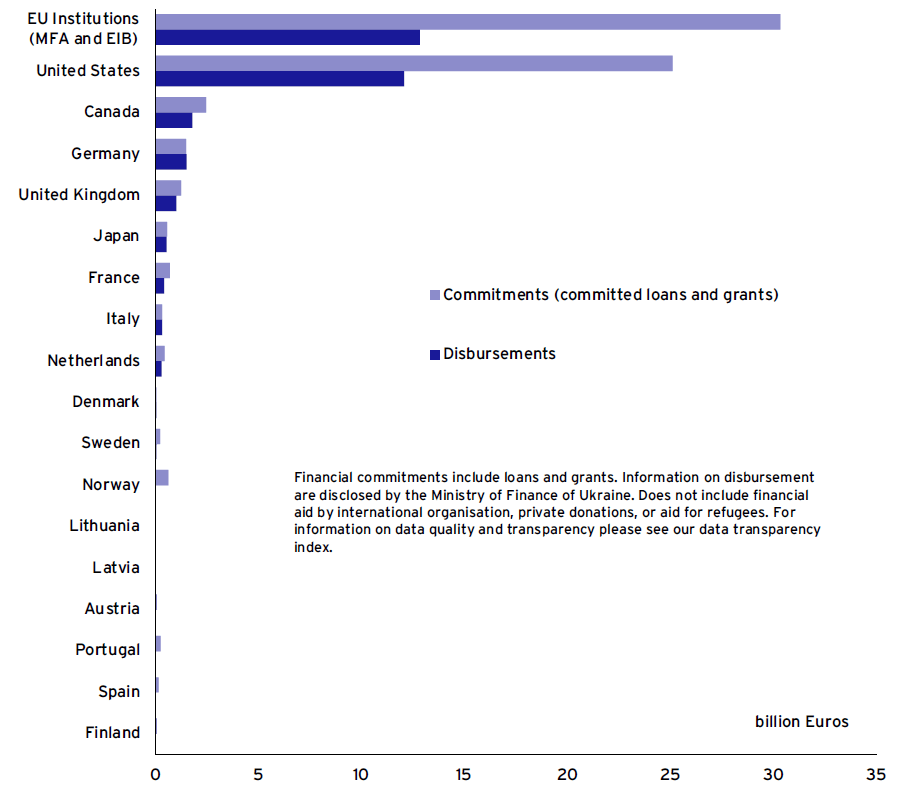
Note: This figure shows a ranking of financial donors, measured by the volume of external grants and loans given for budgetary support to the government of Ukraine (in billion euros). Light blue bars indicate commitments (from our dataset), while the darker blue bars show disbursements (using data from the Ministry of Finance of Ukraine).
Support to Ukraine is small compared to previous wars
In the rest of this chapter, I place the foreign support to Ukraine in a historical perspective. I combine data from our Ukraine Support Tracker project with historical data on military expenditures and military aid in previous wars. In this bigger picture, the international aid to Ukraine so far is surprisingly small.
Comparing to previous wars: sample and data
Identifying comparable wars is not straightforward and is complicated by data limitations. I therefore take a pragmatic approach and focus on a small but well-known sample of wars that (i) involved a major foreign power (in particular, the United States), and (ii) which are well researched and offer reliable data for comparison purposes. The final comparison sample is as follows:
- We start with World War II, for which detailed data on the US Lend-Lease support to the Allies exist, in particular to Great Britain, the USSR and France.
- We also gathered data on foreign military support in the Spanish Civil War (1936- 39), a typical case of a proxy war. Support for Franco’s Nationalists came from Fascist Germany and Italy, while the Republicans were supported by the USSR.
- We further collect US expenditures in major US wars of the 20th century, as estimated by the US Congressional Research Service (Daggett 2010). These data allow us to cover the Korean War (1950-53), the Vietnam War (focusing on 1965- 1975), the war in Afghanistan (focusing on 2001-2010), and the war in Iraq (2003-2010).
- In addition, the Gulf War (1990/91) is an interesting case of international support within a Western Alliance. The war was largely waged by US forces, but nonparticipants such as Germany, Japan, and South Korea provided large financial and military assistance to the US and other combatants to liberate Kuwait. Our data on this war come from multiple official sources.
We aim to make the data across these different wars as comparable as possible. For monetary values, we start by converting into US dollars, if not already given by the source, and then adjust for inflation using the GDP deflator by the US Bureau of Economic Analysis (BEA). We also compute expenses as a percent of GDP at the time. For the United States, we rely on GDP data from the US Bureau of Economic Analysis until 1980 and the IMF–WEO afterwards. In the case of the Gulf War, we use nominal GDP from the World Bank WDI database. To adjust for war duration, we calculate yearly average expenses (except for the case of the Gulf War, which lasted just seven months). For Ukraine we use the period currently covered by the Ukraine Support Tracker database (between 24 January 2022 and 15 January 2023).
The United States sent a 100 times more heavy weapons in World War II
To set the stage, we start by looking at the plain number of weapons committed by foreign powers in wars. High-quality data on weapon donations are available for World War II and for the Spanish Civil War. Figure 7 shows a comparison on the total number of weapons provided during these two wars compared to what was promised to Ukraine in the past year.
FIGURE 7 WEAPON SUPPORT IN MAJOR CONFLICTS: WORLD WAR II, THE SPANISH CIVIL WAR AND UKRAINE 2022 (IN-KIND MILITARY AID FROM FOREIGN POWERS, NUMBER OF ITEMS)
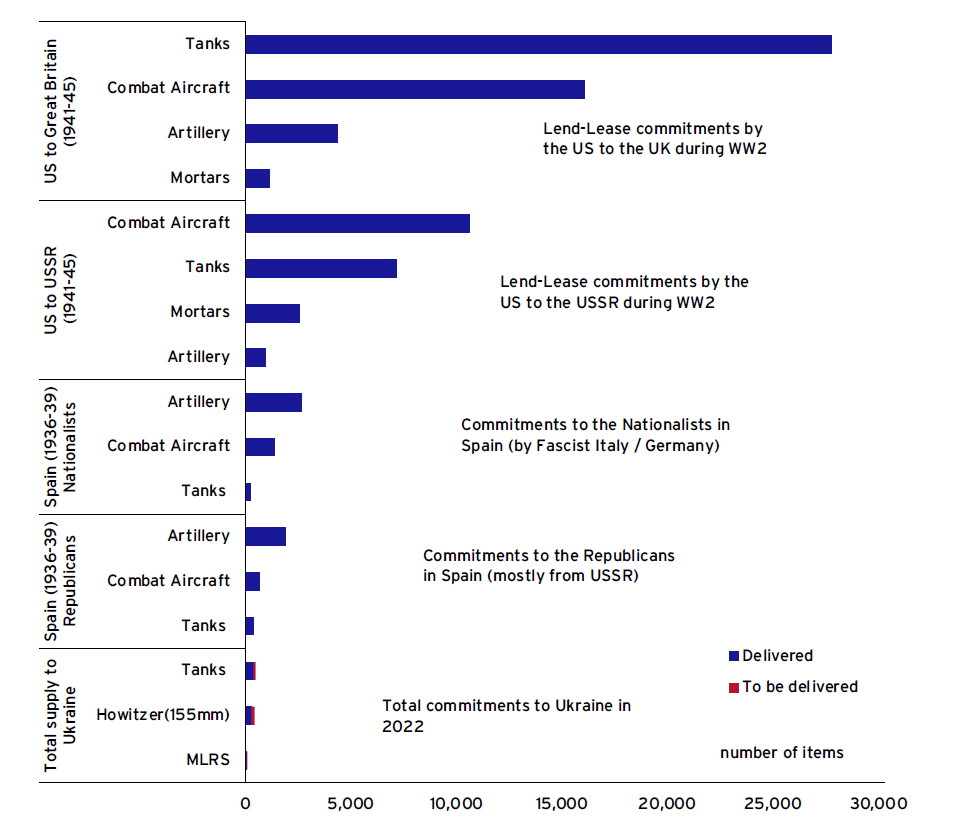
Note: This figure compares the number of weapons sent by foreign powers during WW2 and during the Spanish Civil War to the number of weapons committed to Ukraine thus far. For sources see Trebesch et al. (2023)
The difference in the scale of weapons committed is drastic. During 1941-45, the United States sent more than 25,000 tanks and more than 15,000 airplanes to Great Britain alone, and the USSR and France also received thousands of heavy weapons through the US Land-Lease programme. Compared to that, the total number of heavy weapons to Ukraine are just a fraction – fewer than 500 tanks and howitzers, and fewer than 100 multiple rocket launchers. Also, the tally of weapons sent by foreign powers during the Spanish Civil War clearly outnumber that sent to Ukraine.
Both the price and the technological sophistication of weapons have increased markedly over the past century. We therefore also compare the Allied support during World War ІІ as a percent of donor GDP (by the United States or the United Kingdom). As shown in Figure 8, the support to Great Britain through the Lend-Lease scheme corresponds to 11.6% in total, or 2.6% of US GDP when averaged by year. Next comes the USSR, which received Lend-Lease support on a scale 4.7% of US GDP in total, or 1.2% when averaging per year. These numbers on annual support are up to ten times higher than the military support from the United States or the United Kingdom to Ukraine in 2022 (0.21% and 0.18% of GDP, respectively).
FIGURE 8 FOREIGN SUPPORT DURING WORLD WAR II VERSUS UKRAINE 2022 (ANNUAL AVERAGE SUPPORT IN PERCENT OF DONOR GDP)
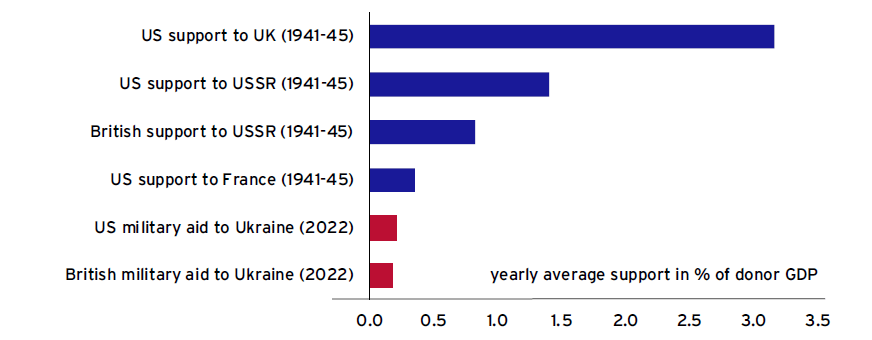
Note: This figure compares the scale of foreign military support by the US and the UK during World War II (blue bars, Lend-Lease program) to their military support to Ukraine 2022 (red bars). We report total aid divided by the number of years during which aid was provided (WW2: 1941 to 1945). For sources see Trebesch et al. (2023)
The United States spent far more in Korea, Vietnam or Iraq
In a next step, we look at more recent wars, in particular wars involving the United States, for which approximate cost estimates are available. We again average costs on a yearly basis and use US GDP at the time for the comparison.
Figure 9 shows the result. By far the costliest war, in terms of yearly US military expenses to GDP, was Korea (1950-53), followed by the wars in Vietnam and Iraq. In each of these wars, US military expenditures far outweighed the size of US military aid committed to Ukraine in 2022. Specifically, the estimates suggest that the US expenses for the Korean war were more than ten times higher than the amount committed to Ukraine in 2022 (0.21%). Similarly, the yearly expense numbers are almost five times higher for Vietnam, and three times higher for the Iraq war. The average yearly costs in Afghanistan are comparable to US commitments to Ukraine.
FIGURE 9 US MILITARY EXPENDITURES IN MAJOR WARS VERSUS UKRAINE 2022 (ESTIMATED YEARLY AVERAGES IN PERCENT OF DONOR GDP)
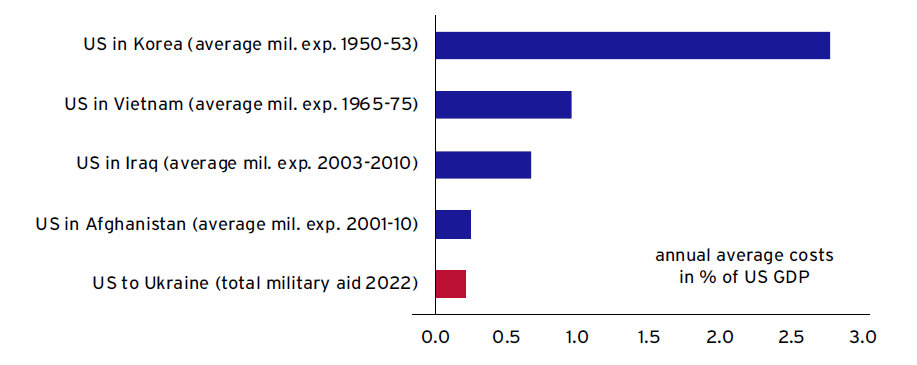
Note: This figure compares average annual US military expenditures in US wars to total US military aid to Ukraine in 2022 (both computed in % of US GDP at the time). Estimates on US military spending are from the US Congressional Research Service (Daggett 2010). US military aid to Ukraine is from our database. For details see Trebesch et al. (2023).
Germany spent three timed more to liberate Kuwait than for Ukraine in 2022
The last comparison focuses on the Gulf War (1990/91), which has some similarities to the Ukraine war. In both wars, a much larger neighbouring state started an unprovoked invasion, and in both wars Western countries formed an Alliance to repel the aggressor state. Specifically, the coalition against Iraq consisted of 35 countries, including a small number of states actively engaged in the war (such as the United States, the United Kingdom and France) and many non-participating states that granted financial and military support. As a result of this large-scale foreign aid, the United States was able to cover most of its own war expenses. Specifically, in a report to the US Congress, the Department of Defense estimated that of the $61 billion total incremental cost of the Gulf War (in 1991 dollars), US taxpayers only paid $7 billion (US Department of Defense 1992).
For total aid numbers we can draw on country-specific sources, shown in Trebesch et al. (2023). For Japan, total commitments to Kuwait and the US-led alliance are worth a total of ¥1.5 trillion, corresponding to $11.5 billion at the time. For Germany, we rely on official estimates showing that total financial and military aid amounted to 16.9 billion Deutsche marks (DM), or $10.5 billion in 1990 US$. Around DM 3 billion of this was military assistance, partly coming from stocks of the German Democratic Republic. For South Korea, official numbers on aggregate support are hard to come by. We therefore use Korean transfers to the US budget as counted by the US Department of Defense. The resulting sum of $355 million is a lower bound of actual support.
Figure 10 uses these data to compare the war support of these three countries in 1990/91 to their support to Ukraine in 2022, both as a share of country GDP at the time. For completeness, we also show total US expenses in the war, although a large part of this cost was covered by transfers from allied states. We compare total aid in 1990/91 to total aid to Ukraine from our database.
FIGURE 10 GULF WAR 1990/91 VERSUS UKRAINE 2022, EXPENDITURES AS A PERCENT OF DONOR GDP
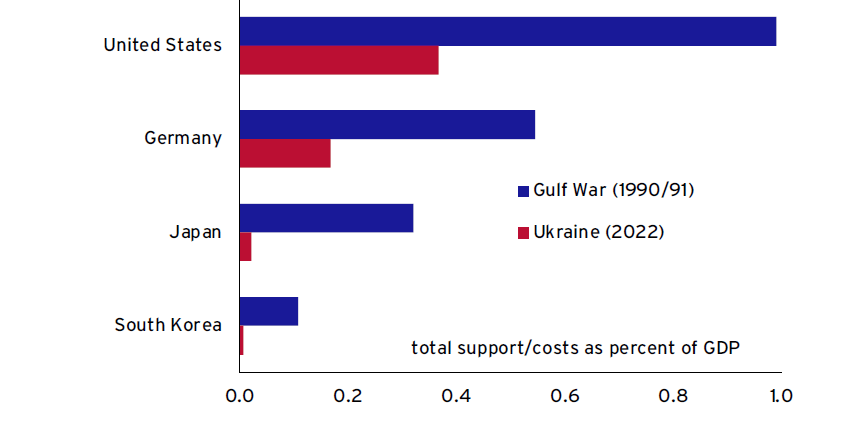
Note: This figure compares the value of support by Germany, Japan, and South Korea during the Gulf War 1990/91 as well as total US war costs, with the size of bilateral aid to Ukraine, scaled by country GDP. Details and sources in Trebesch et al. (2023)
The differences are large. Thus far, Germany has committed bilateral aid worth 0.17% of its GDP to Ukraine, but it committed three times as much to liberate Kuwait in 1990/91 (0.55% of GDP in 1991). The gap is even larger for Japan and South Korea, which have given only limited bilateral aid to Ukraine, especially when compared to the sizable commitments in the context of the Gulf War (0.02% and 0.01%, respectively).
References
Bachman, R, D Baqaee, C Bayer, M Kuhn, A Löschel, B Moll, A Peichl, K Pittel and M Schularick (2022), “What if Germany is cut off from Russian energy?”, VoxEU.org, 25 March.
Becker, T, B Eichengreen, Y Gorodnichenko, S Guriev, S Johnson, T Mylovanov, K Rogoff (2022), A Blueprint for the Reconstruction of Ukraine, CEPR Press.
Daggett, S (2010), “Costs of Major U.S. Wars”, Congressional Research Service, 29 June.
Eichengreen, B and V Rashkovan (2022) “How to organise aid”, in Y Gorodnichenko, I Sologoub and B Weder di Mauro (eds), Rebuilding Ukraine: Principles and Policies, CEPR Press.
Nell, J, O Bilan, T Becker, Y Gorodnichenko, T Mylovanov and N Shapoval (2022) “Financing Ukraine’s victory”, VoxEU.org, 29 September.
IISS – International Institute for Strategic Studies (2022), The Military Balance 2022, Taylor & Francis.
OECD (2022), International Migration Outlook 2022, OECD Publishing.
Trebesch, C, A Antezza, K Bushnell, A Frank, P Frank, L Franz, I Kharitonov, B Kumar, E Rebinskaya and S Schramm (2023) “The Ukraine Support Tracker: Which countries help Ukraine and how?”, Kiel Working Paper No. 2218.
US Department of Defense (1992), Conduct of the Persian Gulf War: Final Report to Congress, 1 April.
Annex
Figure A1. Data transparency index
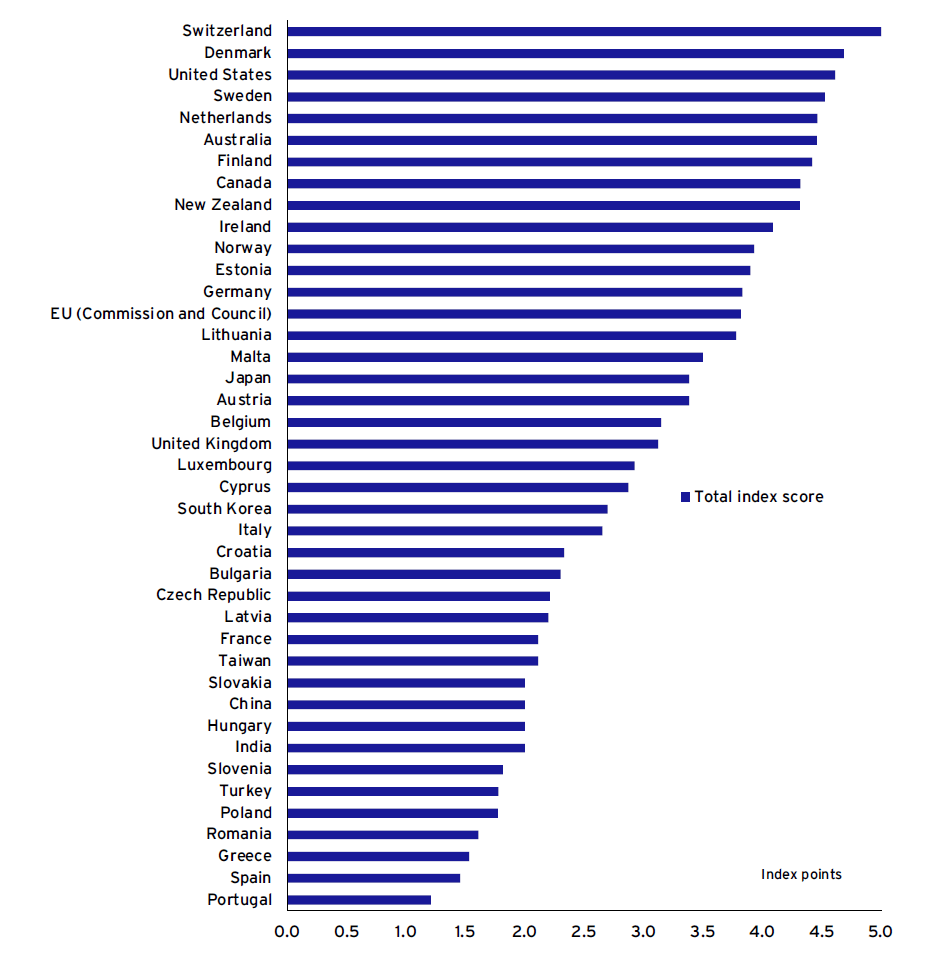
Note: This figure shows the data quality and transparency ranking for all donors. Higher index values indicate higher levels of data transparency (5 = best, 0 = least transparent). The index is based on 5 sub-indices on data quality and transparency by country, the first two being qualitative (0-1) and the remaining three being quantitative (share of items with detailed information): 1 Designated website (yes=1/no=0): Is there an official website on government aid to Ukraine? 2 Total value of commitments given (yes=1/no=0): Is the total sum of Ukraine support provided by the government? 3 Government information on individual items (share in percent): Share of committed individual items in our database for which we have an official source (shares from 0 to 1 computed for each country). 4 Monetary value of individual items given (share in percent): Share of committed individual items in our database for which we have a monetary value (shares from 0 to 1 computed for each country). 5 Exact number of weapons / military items disclosed (share in percent): Share of weapons and other in-kind military items committed for which we have the exact number of items (shares from 0 to 1 computed for each country). The final index score per country is the sum of these 5 sub-indices. A score of 5 is the highest possible and suggests full data transparency, while 0 is the lowest possible score.
FIGURE A2 REASSIGNING EU-LEVEL AID TO INDIVIDUAL EU COUNTRIES (BILLION EUROS) TOTAL BILATERAL COMMITMENTS JANUARY 24, 2022 TO JANUARY 15, 2023
Note: This figure (on bilateral aid in billion Euros) builds on the main Figure 2 but assigns EU-level commitments to each EU country using their respective donation shares. We no longer show the donor bar for “EU Institutions” as in Figure 4 and instead allot EU commitments across EU countries as follows: EU commitments (in particular European Peace Facility, Macro-Financial Assistance) is assigned based on each member country’s relative contribution to the EU budget. EIB commitments are assigned using each country’s weight in the EIB’s capital subscription shares.
FIGURE A3 REASSIGNING EU-LEVEL AID TO INDIVIDUAL EU COUNTRIES (AS A PERCENTAGE OF GDP) TOTAL BILATERAL COMMITMENTS JANUARY 24, 2022 TO JANUARY 15, 2023
Note: This figure shows aid commitments to Ukraine as a percentage of GDP. It builds on Figure 3, but reassigns EU aid shares to the individual EU countries.
#helpUkraine_helptheWorld
This publication is a part of a collection of essays initiated by the National Bank of Ukraine. Famous economists, political scientists and historians, experts recognized in the world, volunteered to share their thoughts and arguments on why helping Ukraine is helping the world. The complete book of essays can be found via the link.

Attention
The authors do not work for, consult to, own shares in or receive funding from any company or organization that would benefit from this article, and have no relevant affiliations