Since the start of the full-scale invasion and application of thousands of sanctions on Russia, Russian government agencies started to conceal data that would allow to estimate the effect of sanctions on Russian economy. This suggests that statistics revealed by Russian authorities may be “twisted” in order to hide the real state of affairs. Other (non-governmental) data sources confirm this conclusion.
“Lies, damned lies, and statistics”
Mark Twain or Benjamin Disraeli
“Lies, damned lies, statistics, and russian statistics”
Oleksii Plastun or not
Russia is the most sanctioned country in the world: estimates of the number of sanctions applied to it vary from 22 000 by Castellum (2024) to 34 200 by CORRECTIV but anyway this is the highest number in human history. According to Castellum data, Russia is sanctioned more than three times as much as Iran, and more than five times as much as Syria or North Korea.
The majority of these sanctions target the Russian economy. All key sectors of the Russian economy are sanctioned, including energy sector, metallurgy and machinery, coal and lumber industries, gold and diamonds, etc.
Despite this, in 2023-2024 Russian economy demonstrated stable growth: GDP increased by 3.6% in 2023 and is projected to grow by 3.2% in 2024 (IMF, 2024). Industrial production increased by 3.5% in 2023 (Statista, 2024). Moreover, employing the Atlas method, the World Bank included Russia into the group of high-income countries (Metreau et al., 2024).
A potential explanation for this phenomenon is simple: stable growth is a statistical fabrication by Russian authorities, such as Rosstat (Russian statistical agency). It is a form of propaganda used to create the image of “strong and invincible Russia”. Russia is portrayed as having overcome the burden of sanctions and successfully transformed and evolved. In reality, however, the Russian economy is under significant pressure, with some sectors on the brink of collapse.
A close analogue to this explanation is Russia’s elections, where results sometimes exceed 100%. For example, after the State Duma (Russian Parliament) elections in December 2011, graphs shown on television indicated that voter turnout in certain regions surpassed 100%. In Rostov Oblast, it was reported at 146%, in Voronezh Oblast at 129%, and in Sverdlovsk Oblast at 115% (RBC, 2016). The same is true for the fake “referendums” after the annexation of Crimea in 2014 or parts of other Ukrainian regions after 2022. The international community correctly does not recognize Russian elections democratic, however, it still treats Rosstat data as something real.
The Stockholm Institute of Transition Economics (SITE) at the Stockholm School of Economics claims that “since Russia’s full-scale war against Ukraine, economic indicators have become a part of the Russian propaganda.” (SITE, 2024). They warn that “key economic indicators such as inflation and real GDP growth should be treated with a significant degree of care and official numbers of these variables should not be cited without an explicit warning that they are part of the Russian propaganda narrative.”
How does Russia tweak the data?
There are many different instruments to moderate reality: propaganda, media framing, social media algorithms, manipulation of financial reports, surveys and polls, control of information flow, etc. Russia actively uses all of them (Aragão and Linsi (2022) discuss a number of methods which governments use to manipulate statistics).
For example, in 2022, most of the leading global automobile producers stopped production in Russia. However, google queries such as “plant is not working”, ” factory is closed”, “production stopped” etc. related to automobile production in Russia would return very few search results thus creating the impression that nothing changed and everything is working as usual. In reality, the automobile industry in Russia was frozen for months in 2022, until China helped them to relaunch production. Even Russian official data show that in May 2022 car production there fell by 96.7% (Shirokun, 2022). This is how the control of information flow works.
Perhaps the most actively used and the most efficient tool is manipulation of statistics. This includes not only “classic” tactics such as cherry-picking data or the use of small base effects to demonstrate significant growth, but also direct falsification of data.
In September 2024, former Chief Economist at the Institute of International Finance (IIF) Robin Brooks claimed that Russia was probably understating its current account surplus (Brooks, 2024). He based this conclusion on the fact that before 2022 there was an economic relationship between official indicators and other indicators not controlled by the Russian government. For instance, oil prices are positively related to the current account surplus of an oil exporting country, such as Russia, and this relation is rather stable. After 2022 the relationship was broken; this might be evidence in favor of data manipulation (falsification) by Russian officials.
Many analytical platforms and experts indicate that the Kremlin’s official policy is focused on strictly limiting access to data (Kokorin et al., 2024). Russian institutions have stopped publishing a number of sensitive and problematic datasets: all foreign trade data; data on gas and oil production; data on capital inflows and outflows; financial reports of many companies; data on airline and airport passenger traffic; many Central Bank data, including statistics on the structure of gold and foreign exchange reserves, etc.
“To be precise” project estimates that after February 24, 2022, at least 44 state agencies stopped publishing indicators/datasets that were previously public (old information still can be found on their web-sites). 35 of them removed statistical indicators (Cedar, 2024) and the rest of them removed official information (lists of regional divisions and subordinate organizations). 22 agencies hid indicators that were often cited by journalists and analysts. Almost 500 datasets have been removed from the official websites of federal government agencies alone over the past two years (Gi, 2024).
The most efficient tool to manipulate the data is methodology revisions: changes in the process of calculation of specific indicators. For example, after revising the methodology for GDP calculation in 2014, Russia’s nominal GDP increased by more than 5 trillion rubles or 6-7% (Bakhvalova, 2019). As a more recent example, the sharp depreciation of the ruble in late July and early August 2023 triggered a chain reaction of rising prices in the Russian economy. In an attempt to conceal the true extent of price increases, Rosstat decided to postpone (until indefinitely) the inclusion of data from online receipts in the calculation of the Consumer Price Index (Boyko and Romanov, 2023).
Rosstat potentially manipulates consumer price index data by (1) “adjusting” the set of goods and services used in the calculation; (2) changing weights of different goods in the index calculation; and (3) changing formula used to calculate the consumer price index (e.g. selecting different base values).
The set of goods and services used in the calculation of the consumer price index since the start of the full-scale invasion was updated four times: on 30 March 2022 (Rosstat order #165), on 23 December 2022 (order #975), on 19 December 2023 (order #665), and on 07 March 2024 (order #91). Note that the International Labour Organization recommends reviewing the set of goods and services used for calculation of inflation every five years.
Moreover, there were changes in the official statistical methodology for monitoring prices of consumer goods and services and calculating consumer price indices (Rosstat order from от 22.07.2022 #512). Since the annexation of Crimea in 2014, Rosstat issued 17 documents with changes to the methodology of consumer price index calculation (Rosstat, 2024).
As a result, Rosstat constantly updates and “corrects” its past data. Thus, Kopytok (2024) showed that in one year after the initial publication more than 50% of real disposable income indicators and about 45% of real income indicators were adjusted. Typically, these are positive adjustments. For example, Rosstat significantly updated two key indicators for the first quarter of 2023: the estimate of real monetary income increased by 2.9 percentage points, and the estimate of real disposable income rose by 4.3 percentage points. While these were the highest ever positive revisions, Rosstat did not provide any explanations for these changes.
The same is true for industrial production. In 2023, the data for 2022 were updated from -0.6% to +0.6%. For mining, the growth rate was revised from 0.8% to 1.3%, and for manufacturing from -1.3% to 0.3%.
Molyarenko (2019) identified manipulations in other spheres but for similar reasons. She claims that the manipulation of data in the public health and housing sectors in Russia can serve multiple administrative and financial purposes. For instance, the government runs health initiatives aimed at reducing the frequency of cardiovascular diseases. Thus, to “improve” results of these initiatives, doctors have been altering death causes. If a patient who died from a stroke also had a history of diabetes, the cause of death may be attributed to diabetes rather than the stroke. This practice allows the healthcare system to show better progress in reducing stroke-related deaths, even if the actual situation did not change much.
Molyarenko (2019) also noted that nominal growth in wages of doctors and teachers in Russia was achieved firstly by a statistical trick, i.e. adding bonuses to the base salary, and secondly, by increasing workloads (e.g. more teaching hours or patient consultations per shift) and reducing “excess” staff in the healthcare and education sectors. As a result, real wages for some doctors and teachers actually decreased.
Similarly, in the housing and communal services sector, local authorities often underreport the amount of dilapidated and wrecky housing. This manipulation reduces the official share of such housing, which helps local governments avoid the costs associated with repair and construction. It also prevents penalties or sanctions that could arise from having a higher proportion of unsafe or uninhabitable buildings and thus allows local governments to “save” money.
Revealing Russian data manipulation
A promising approach to detect statistical lies is based on the use of indirect economic indicators that are not subject to strong administrative or political control. For instance, discrepancies between official GDP figures and data on electricity production or freight volumes can point at possible manipulations, and when plugged into econometric models can help reveal real data. Also, metrics from alternative (non-government) sources can be used.
Thus, SITE (2024) estimates that adjusting Russia’s GDP growth for ROMIR price index data rather than official inflation would result in 2023 GDP growth of 3.6% turning into a 8.7% GDP decline. Estimates of GDP growth based on other models (oil consumption, GDP in USD) also show a GDP decline. Thus, we take a closer look at official inflation data and compare it to the ROMIR FMCG deflator index to see the extent of possible manipulation. We compare the correlation between these two measures of inflation in 2019-2021 and 2022-2024.
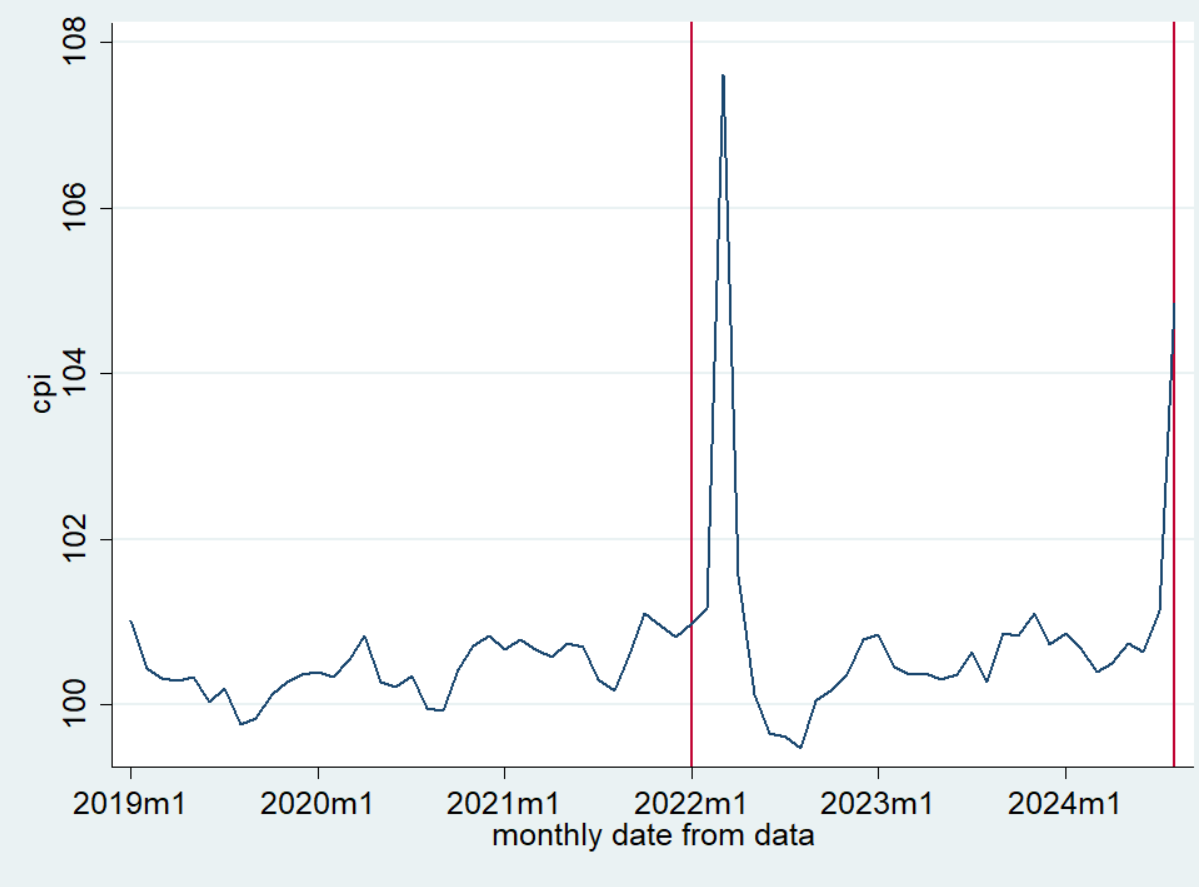
The Consumer Price Index (CPI) surged to 107.6 in March 2022, and then rather quickly returned to normal but started growing again in the second half of 2024 (figure 1).
Figure 1. The dynamics of Russian Consumer Price Index (CPI) January 2019 to August 2024, monthly data

Source: authors’ calculations based on Rosstat data
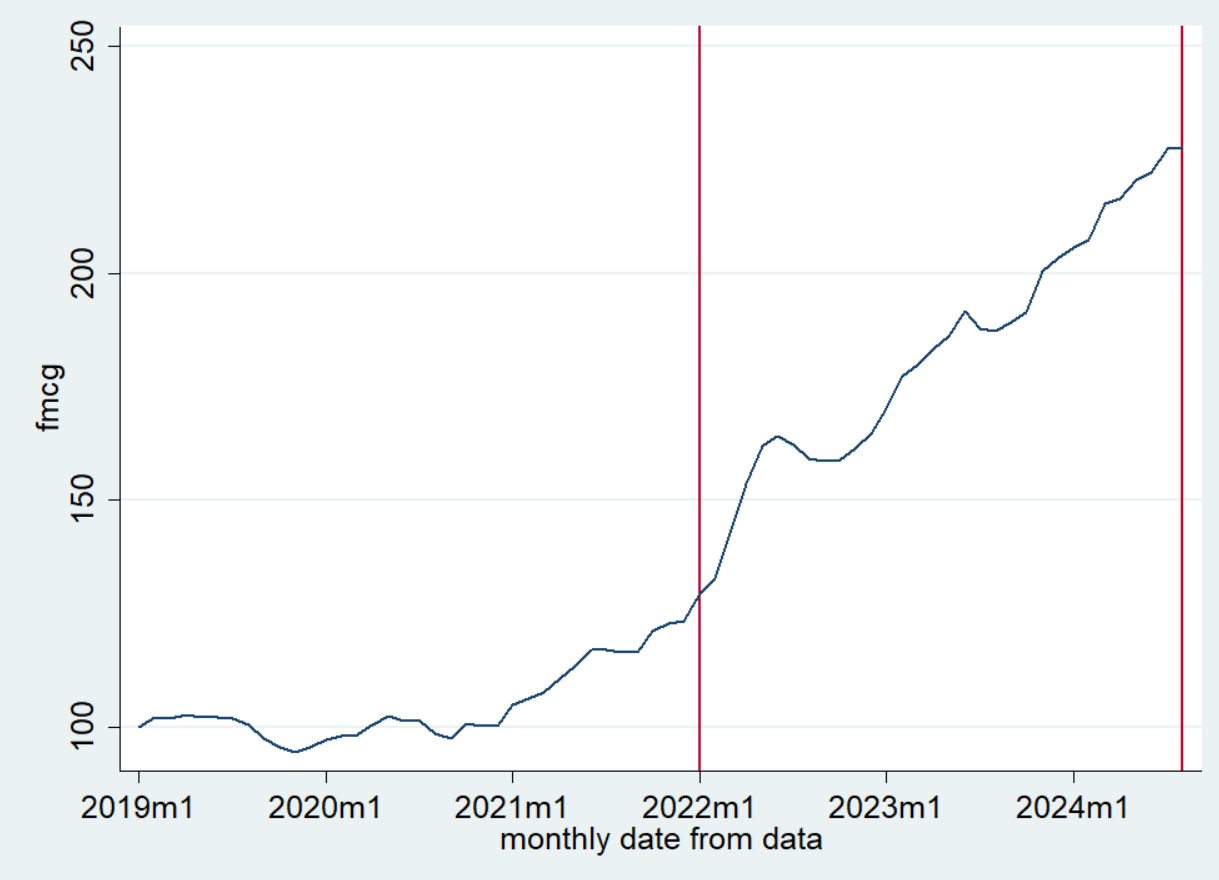
In contrast, the dynamics of the FMCG deflator, which reflects consumer inflation for everyday goods (food, hygiene products etc.), has been steadily increasing in 2022-2024, although it started accelerating already in 2021 (figure 2). As of August 2024, it reached its historical maximum of 227.7%.
Figure 2. The Dynamics of ROMIR FMCG Deflator for 2019–2024

Source: authors’ calculations based on Rosstat data
Correlation analysis reveals a significant shift in the relationship between the inflation rate and the FMCG deflator across the first (2019–2021) and second (2022–2024) periods. Specifically, before 2022 the correlation was positive (0.91) and afterwards it became negative (-0.6); both coefficients are statistically significant at 5%. This is confirmed by the linear regression analysis:
- predicted model No.1 (based on 2019–2021): infl= -14.207+0,182*fmcg;
- predicted model No. 2 (based on 2022–2024): infl= 25.322-0,088*fmcg.
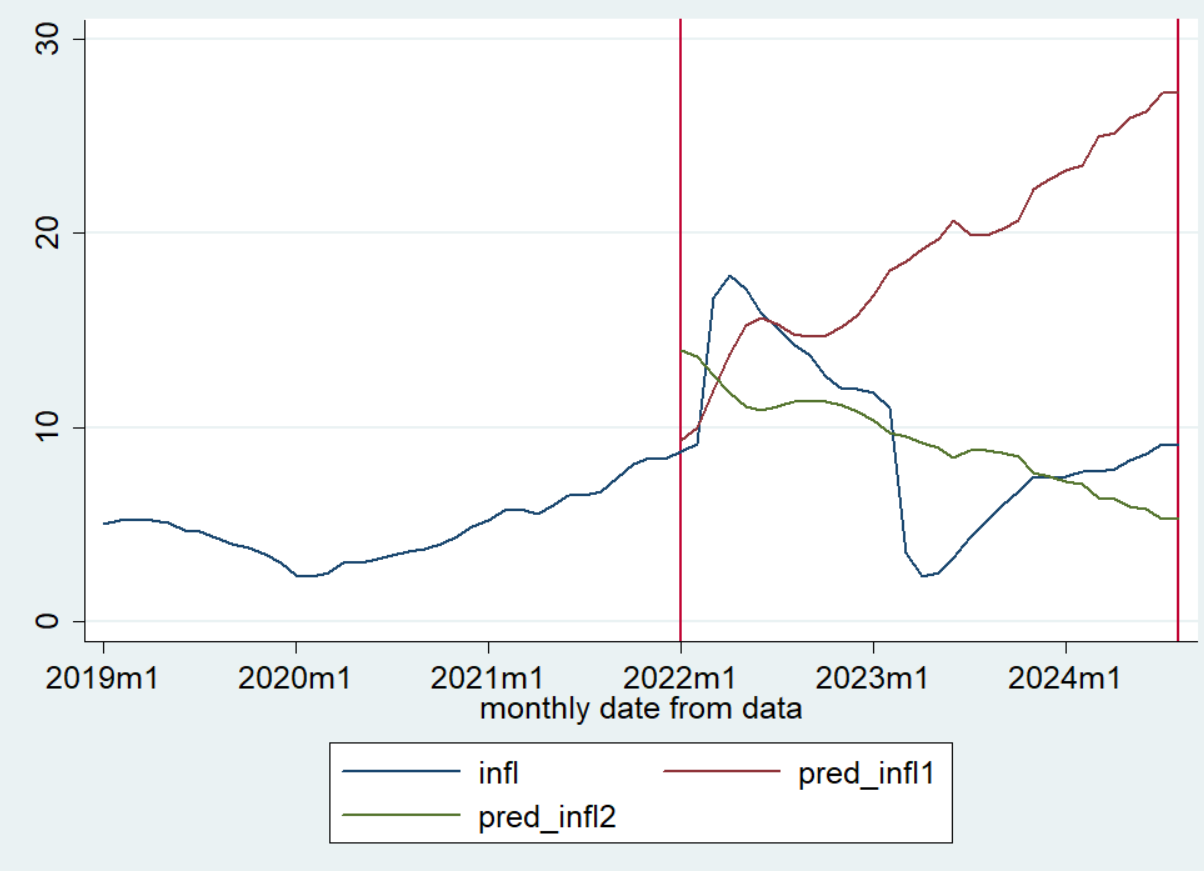
Next, we compared actual inflation data (infl) with predicted data for model_1, based on pre-invasion data: pred_infl1, and model_2 based on post-invasion data: pred_infl2 (figure 3).
Forecasting illustrates that if the relation between FMCG index and inflation index remained the same as in 2019-2021 (model_1), inflation would have grown sharply, potentially reaching 27.2% by August 2024. However, based on model_2 calculations, there is a decline in the indicator: this model suggests a decrease in the inflation rate to an anticipated 5.2%, compared to the official rate of 9.05% recorded in August. The difference between model_1 forecast and actual data is almost 3 times. This model (model_1) was working quite well for the case of pre-invasion data. This might be evidence in favor of data manipulation by Russian authorities.
Figure 3. Comparison of official inflation rate with predicted by the two models for 2022-2024

Source: authors’ calculations; note: blue line is the official inflation rate, red line – inflation rate predicted by model_1, green line – model_2 prediction
In general, these results align with those obtained by SITE (2024) or Brooks (2024): there is a significant positive bias (i.e. understatement of inflation) in the official statistical data. The differences between official and unofficial data can reach several hundred percent.
One potential explanation explored is the falsification of statistical data—official figures that suggest economic growth may be biased, with the actual situation differing significantly.
Based on inflation data analysis we can see that after 2022 the nature of relationship between official and unofficial inflation metrics in Russia has changed dramatically: from positive to negative significant correlation. Results based on models calibrated with pre-2022 data statistically differ from those generated on models calibrated with post-2022 data. Forecasts based on pre-2022 models differ by 2-3 times to the results of post-2022 model data and actual data from official sources. A potential explanation to this phenomenon is falsification of data from the Rosstat in order to demonstrate that sanctions are not working.
These findings raise doubts about the reliability of official statistics, implying they may have been manipulated to present a more favorable economic picture. So, never trust Russian stats.
References
- Aragão, R., & Linsi, L. (2022). Many shades of wrong: what governments do when they manipulate statistics. Review of International Political Economy, 29(1), 88–113.
- Bakhvalova M. (2019). Lies, Big Lies and Statistics. Why does Rosstat often change its data?
- Boyko, A., Romanov, R. (2023). Rosstat had to postpone the inflation assessment using online check data
- Brooks R. (2024). Russia is very likely understating its current account surplus
- Castellum. (2024). Russia Sanctions Dashboard.
- Cedar (Center for Data and Research on Russia). (2024). Can Russian official data be trusted? A map of the dangers of state statistics. Russia: Known Unknowns, Boris Nemtsov Foundation for Freedom, Ideas for Russia Initiative.
- CORRECTIV (2024). Sanctions tracker: Live monitoring of all sanctions against Russia.
- Gi B. (2024). Over the past two years, 44 government agencies have removed nearly 500 datasets from their websites.
- Guriev, S., & Treisman, D. (2019). Informational autocrats. Journal of Economic Perspectives, 33(4), 100–127.
- IMF. (2024). World Economic Outlook: The global economy in a sticky spot. International Monetary Fund.
- Kasyanchuk D. (2024). Unfinished figures. What data can we still use to judge the state of the Russian economy
- Kokorin, D., Gorskiy, D., Zubiuk, E., & Kote, T. (2024). Known unknowns: Studying Russia in conditions of growing non-transparency. Ideas for Russia Initiative. Boris Nemtsov Foundation for Freedom.
- Kopytok V. (2024) Rosstat consistently revises data retroactively
- Metreau, E., Young, K. E., & Eapen, S. G. (2024). World Bank country classifications by income level for 2024-2025. World Bank Blogs.
- Molyarenko, O. (2019). Generating State Statistics: A View from «Below»». «Eco», 49(10), 8–34.
- RBC. (2016) Churov explained the story about 146% in the elections.
- Rosstat (2023) Industrial production in Russia in January–July 2023
- Rosstat (2024). CPI Methodology
- Shirokun K. (2022). Record decline. Car production in Russia in May fell by 96.7%.
- SITE. (2024) The Russian Economy in the Fog of War.
- Statista (2024). Russia: Real gross domestic product (GDP) growth rate from 2019 to 2029
Photo: depositphotos.com/ua
Attention
The authors do not work for, consult to, own shares in or receive funding from any company or organization that would benefit from this article, and have no relevant affiliations


