The extensive corruption investigation at Energoatom underscores the importance of detecting and punishing corruption as early as possible. While corruption is costly everywhere, fighting it is literally a matter of life or death for Ukraine given the ongoing war. But how can one detect corruption quickly and at scale when by its very nature it is a concealed activity? Given that corruption continues to occur not just in budding democracies but in stable ones as well (e.g., Italy, France, Spain, and the UK), we obviously need more tools in our arsenal to prevent and flag it.
To this end, our recent work proposes a novel method to identify potentially problematic sectors using basic information from public procurement auctions. The intuition behind our method is simple. Suppose that you have 100 firms bidding on 100 independent contracts. If firms have similar costs, the probability of a given firm winning a given contract should be about 1/100. In other words, if firms are alike, one should observe an even distribution of contracts across firms. If we observe that a small subset of firms consistently wins a disproportionate share of contracts (say, one firm wins 20 out of 100 contracts), such a winning streak is unlikely to be due to chance and there could be another force that makes this firm so successful. This firm may have a significant cost advantage relative to other firms in the industry. Or this firm may rig auctions by corrupting public officials.
Without additional information, we can’t tell whether large deviations from this benchmark due to cost advantages or uncompetitive behavior. However, suppose that we have auction results for a country or industry where we know that corruption is not a big issue. In that case, any deviations from the uniform distribution are likely driven by variation in costs. This additional information helps us set a benchmark. If we observe much larger deviations in other countries than in this benchmark, that suggests that auction outcomes are being manipulated.
Once we understand this basic setup, we can consider more complicated settings where contracts vary in size. Observing one firm winning a disproportionate number of small contracts is likely less problematic than if that same firm wins many contracts worth tens of millions of dollars. To measure the concentration of contracts, we can use the Hirshman-Herfindahl Index (HHI), which is equal to the sum of squared shares of contracts. For example, suppose you have ten contacts each worth $1 million. The total value of contracts is then $10 million, and the HHI is therefore (1/10*100)^2+(1/10*100)^2+…+(1/10*100)^2=1000. Now consider a situation where you have 10 contracts but two contracts are worth $4 million each and each of the remaining contracts is worth $0.25 million. In this case, HHI=(4/10*100)^2+(4/10*100)^2+(0.25/10*100)^2+…+(0.25/10*100)^2=3250, which indicates a more concentrated distribution of contracts.
One can then show that a competitive allocation of contracts should be such that the HHI among winning firms should be close to the HHI of the contracts. In other words, if contracts are comparable in size, the total contract value awarded to each firm should be comparable in size too. If contracts are concentrated, then awards to firms should be concentrated too. How do we know that the gap between HHI for firms and HHI for contracts is big enough to be a cause for concern? To answer this question, we used bootstrapping, a statistical technique, to test whether the gap—we call it excess concentration—is statistically significantly different from zero or from the measure for a benchmark country or industry.
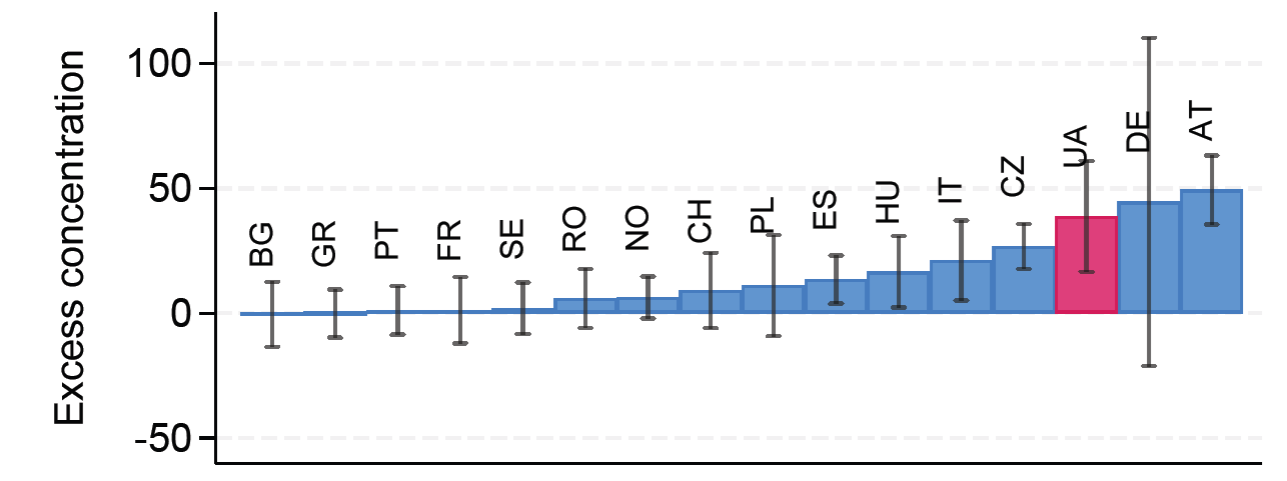
Using this method, we can score each country’s procurement auctions by sector and see how Ukraine compares to other European countries in 2017-2021. Figure 1 shows that Ukraine’s procurement of medical equipment, pharmaceuticals and personal care products is comparable to some of the best (in terms of lack of corruption or concentration) countries in Europe. Ukraine is similar to Germany and fares much better than Poland, Bulgaria, Lithuania, and Spain. Figure 2 paints a similar picture for procurement of transport equipment (buses, cars, railroad cars, etc.). More generally, Ukraine’s procurement in most sectors looks fairly similar to procurement in these sectors for other countries.
Figure 1. Procurement of medical equipment, pharmaceuticals and personal care products
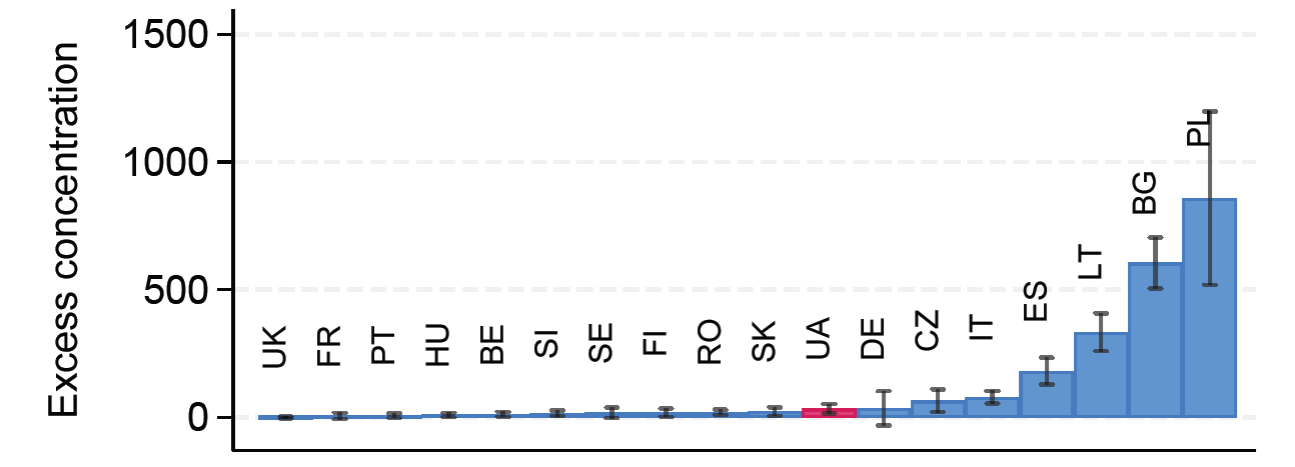
Figure 2. Procurement of transport equipment and auxiliary products to transportation
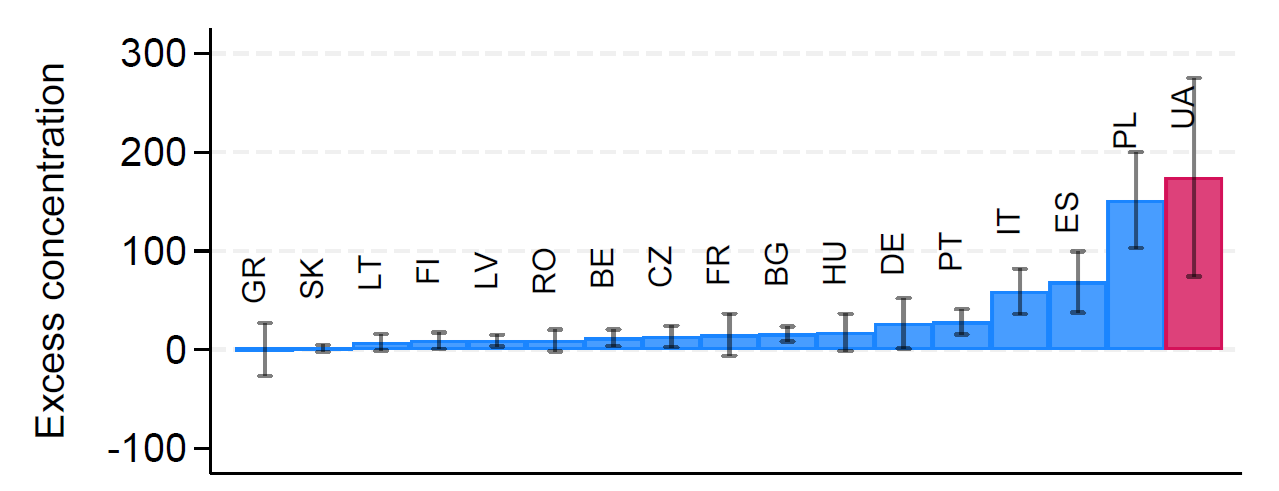
But the data also reveal two sectors demanding greater vigilance: construction and energy (defined as “petroleum products, fuel, electricity and other sources of energy”). Between 2017 and 2021, contract concentration in these sectors in Ukraine was notably higher than in most EU countries. Figure 3 shows that for energy, Ukraine compares poorly to EU countries, with the exception of Poland. It is worth noting that state-owned energy companies like Energoatom and Ukrenergo are generally auction organizers, not bidders for contracts themselves. However, our metric is designed to flag potentially problematic sectors regardless of which side engages in anti-competitive behavior.
High concentration in construction and energy should not be dismissed—but it does not automatically prove corruption. It is possible that only a handful of firms had the capacity to execute these projects at scale. Similar patterns appear in Spain’s pre-2008 highway boom and Poland’s EU-funded infrastructure surge of 2010–2013, although in the case of Ukraine’s construction industry, the allegations of corruption were widespread in the second half of our time period.
Our approach can therefore point to where corruption is more likely, allowing for more efficient use of scarce investigative resources. For example, while the revelations of a corruption network in Energoatom highlight Ukraine’s efforts to root out corruption, our metric suggests that Poland’s and, to a lesser extent, Spain’s and Italy’s, energy sectors also deserve additional scrutiny by anti-corruption authorities. Similarly, Poland’s, Bulgaria’s, Lithuania’s, and Spain’s medical procurement is potentially problematic (Figure 1) and may warrant additional investigative resources.
The heterogeneity in countries’ rankings in these and other sectors also underscore that anti-competitive behavior need not be uniform. It is possible to have well-functioning procurement markets coexist with poorly performing ones (e.g., France scores very poorly in the repair and maintenance services sector but is close to the competitive benchmarks in all others). Our metric avoids the all-or-nothing approach that labels entire countries as “corrupt” or “clean” and instead provides an actionable sector-specific flag.
Figure 3. Procurement in petroleum products, fuel, electricity and other sources of energy
Where do these findings leave us? When corruption scandals erupt in wartime Ukraine, they risk doing more than damage reputations—they can threaten lives, unity, and international support. The recent allegations involving Energoatom are no exception. But each investigation, each dismissal, each prosecution is proof that the system is functioning. Ukraine’s allies should see this not as weakness but as maturity. Our quantitative tools are designed to help, not to condemn. They point to where vigilance should be greatest—not because Ukraine is uniquely corrupt, but because it is uniquely open about its challenges and determined to overcome them.
Photo: depositphotos.com/ua


Attention
The authors do not work for, consult to, own shares in or receive funding from any company or organization that would benefit from this article, and have no relevant affiliations