In the last year before the full-scale invasion, almost all Ukrainian households had health expenditures with a median amount of $111 per year. Depending on the definition, 2.2% to 12.6% of households experienced catastrophic health spending.
Although some findings align with previous literature (e.g., private provider visits increase the probability of catastrophic spending), the insignificance of many socio-economic factors is surprising. However, the situation likely worsened after the full-scale Russian aggression, with informal payments remaining high, especially in the war-affected regions. Thus, focus on catastrophic health spending should remain a priority in Ukraine’s future reconstruction.
How much did Ukrainians spend on health in 2021?
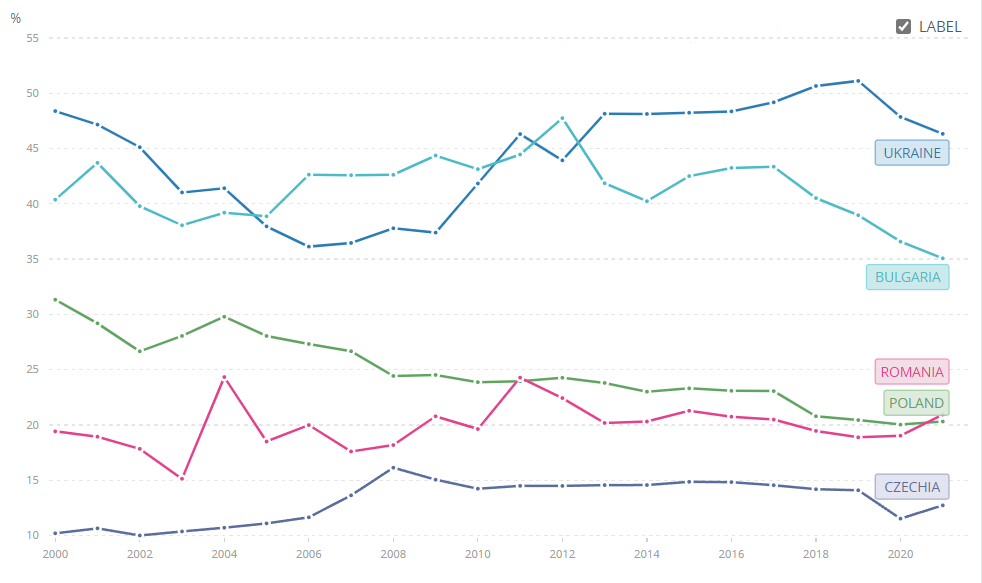
Despite a number of successful healthcare reforms implemented after 2017, Ukrainians still paid out-of-pocket almost half of all health expenditures before the full-scale war. Figure 1 shows that the share of out-of-pocket health spending in 2021 was 46.3% in Ukraine. For comparison, in Bulgaria, Czechia, Poland and Romania it was in the range of 12.7-35.7%.
Figure 1. Out-of-pocket expenditure (% of current health expenditure)
Source: World Bank
Even more problematic is the case of catastrophic health expenditures defined as out-of-pocket payments above a share of total household expenditure or non-food expenditure that forces families to sacrifice other basic needs, sell property, accumulate debts or become impoverished (Eze et al 2022). Health expenditures are commonly defined as catastrophic if they exceed 10% of total household expenditure or 40% of household non-food expenditure but a threshold of 25% for both definitions is also used (Aregbeshola and Khan 2018).
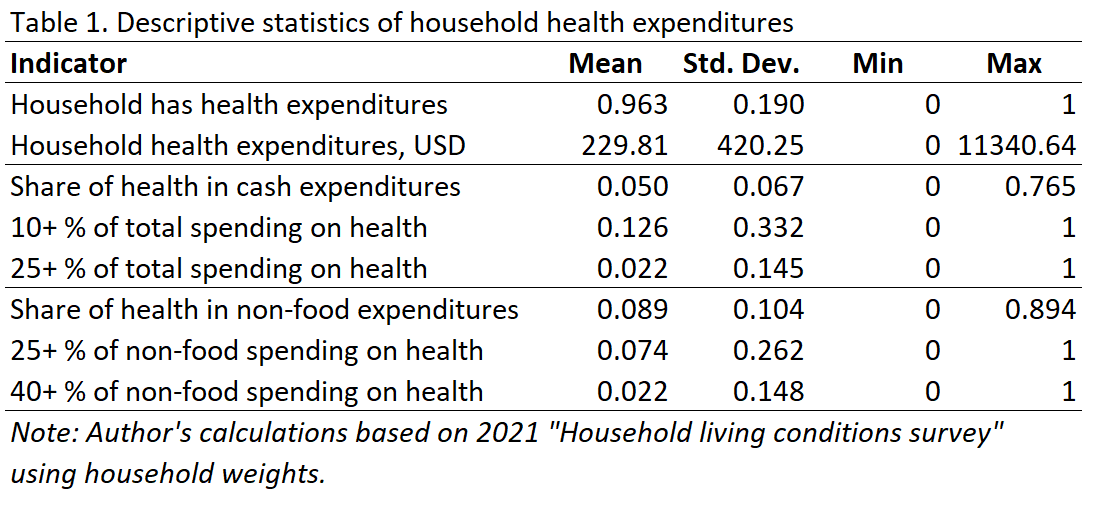
Table 1 shows descriptive statistics for different measures of health expenditures such as household health expenditures in USD and share of health in total cash and non-food expenditures. In addition, a few indicators of catastrophic health expenditures are introduced. For example, indicator “10+% of total spending on health” takes the value of 1 if a household spends more than 10% of family cash on health and 0 otherwise.
According to the 2021 “Household Living Conditions Survey” produced by Ukrstat, 96.3% of households report having health expenditures, indicating that health-related spending is nearly universal. The mean annual household health expenditure is $230, though there is considerable variation, with a standard deviation of $420 and expenditures ranging from $0 to a substantial $11,340.
The average share of healthcare in total expenditures is quite low (just 5%) but the maximum share was 76.5% indicating a presence of impoverishing health conditions for some households. A notable 12.6% of households allocate 10% or more of their total spending to health, but only 2.2% spend 25% or more of total family budget on health. In terms of non-food expenditures, health expenses constitute an average share of 8.9%, with the maximum reaching almost the entire family budget of 89.4%. 7.4% of households spend over 25% of their non-food budget on health, and 2.2% allocate at least 40% of their non-food spending to health. These figures reflect significant variation in health expenditure burdens among Ukrainian households.
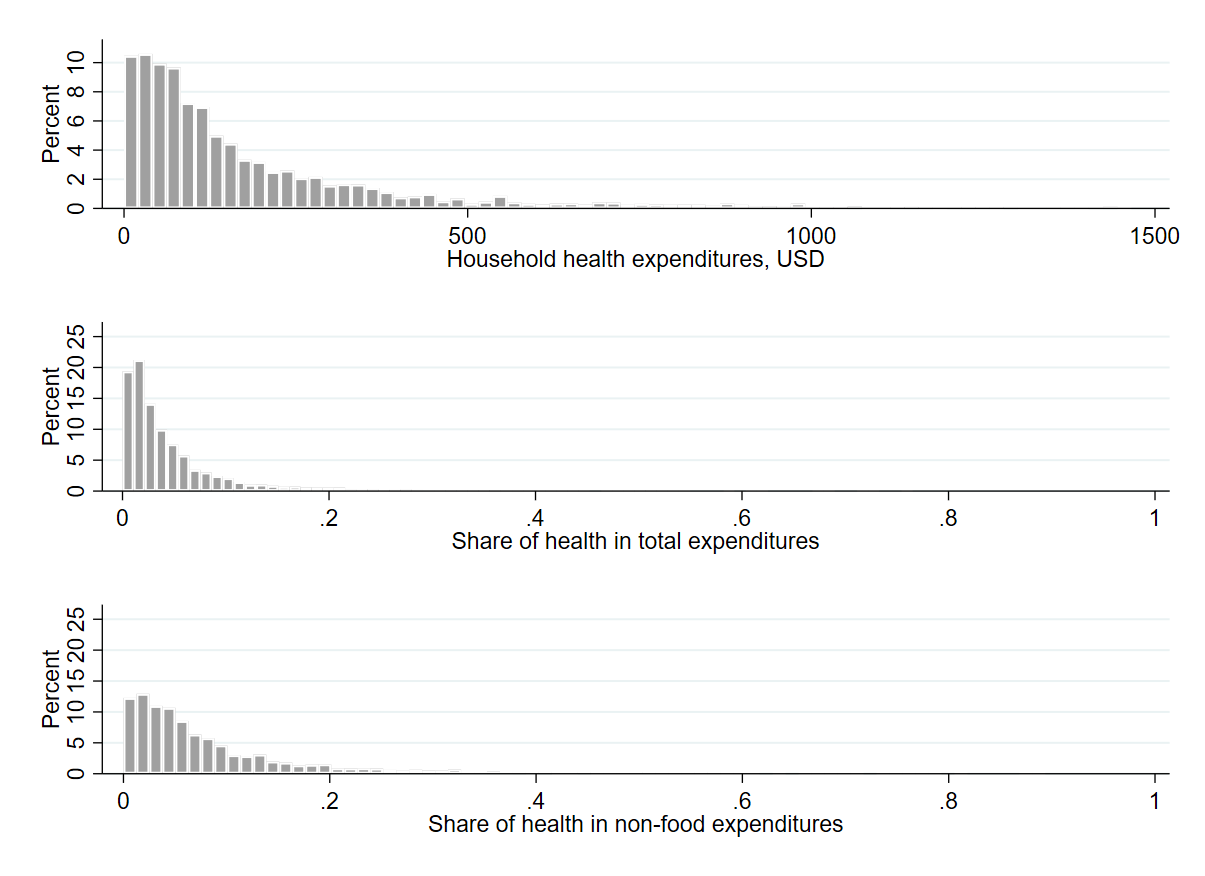
Figure 2 shows the distribution of household health expenditures in Ukraine in 2021, also revealing significant variability. While most households spend modest amounts on health (under $500 per year), with expenditures being heavily skewed towards the lower end, a few households still incur much higher costs of $1500 and above.
Figure 2. Histograms of household health expenditures
Note: Author’s calculations based on 2021 “Household living conditions survey” using household weights. Household health expenditures above three standard deviations from the mean ($1490.56) are not shown on the top graph as outliers.
Similarly, the share of health expenditures in both total and non-food expenditures is generally low for most households, with the distributions tapering off quickly at around 10-15% of households. However, some households allocate a significant portion of their budgets to health, with maximum shares reaching nearly 90% of non-food spending. While health expenditures typically remain a minor part of household budgets, some households face substantial health-related financial burdens. Households that face potentially catastrophic health expenditures are investigated further below.
Covariates related to health spending in Ukraine
This article uses the “Household living conditions survey” for 2021 collected by the State Statistics Service of Ukraine (UkrStat). The data about health expenditures are available at the household level only. Hence, the unit of analysis is a household but individual characteristics are aggregated at the level of the household and included into models.
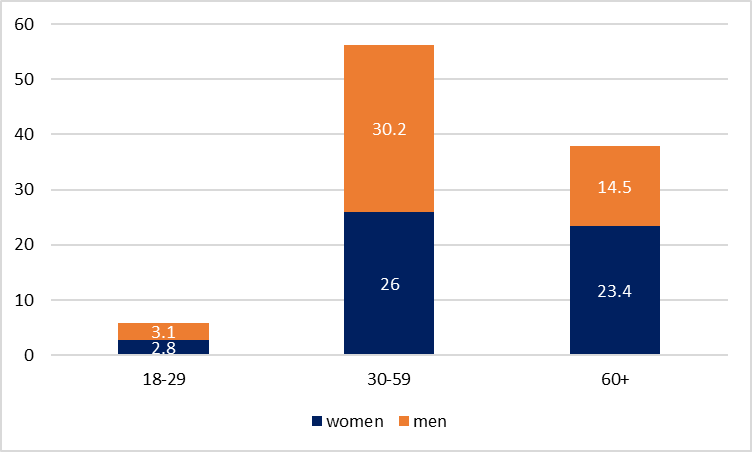
The survey includes many socio-demographic and socio-economic characteristics of households which are described next. In particular, there are 2.8% of households with women heads aged 18-29 (base category). Approximately 26.0% of households are headed by women aged 30-59, about 23.4% by women aged 60 and above, only about 3.1% by men aged 18-29, around 30.2% by men aged 30-59, and about 14.5% by men aged 60 and above (hereinafter household weights from UkrStat are used).
Figure 3. Distribution of households by sex/age of head
The average household size is 2.54 members, with 43.9% of households having children under 18 years old and a significant 62.3% having members over 60. Notably, 60.8% of households have at least one member with a higher education, while only 11.3% have members with just basic education (and high school being the base category). The data also reveals that 60.0% of households have at least one retiree (which potentially captures a different household dimension compared to age), but only 4.5% have an entrepreneur, providing a snapshot of the employment and retirement landscape in Ukrainian households.
About 39.7% of households live in cities with over 100,000 inhabitants, while 28.0% are in smaller cities with under 100 thousand people, indicating a predominantly urban population (with the base category being the countryside). Only 4.1% of households fall below the official minimum subsistence income level, suggesting relatively low levels of extreme poverty. An average household has 2.35 rooms, indicating modest but not cramped living spaces. However, there are significant infrastructure challenges: 14.2% of households lack running water, 14.6% lack indoor toilets, and a substantial 47.9% lack hot running water (but may still have a boiler or similar arrangement), highlighting areas for potential improvement in basic amenities.
On the positive side, 39.3% of households have access to a land plot, and 29.9% own livestock, suggesting a significant presence of small-scale agriculture, which could contribute to household self-sufficiency in particular in small cities and countryside.
The dataset also includes aggregated statistics about the number of household members visiting particular types of healthcare providers. Family doctors are the most frequently visited, with an average of 1.79 household members visiting a family doctor per year (this indicator is calculated as follows: if in a household consisting of 4 people three members visited a doctor in the previous 12 months and one didn’t visit, its value would be 3 for this household. Non-integer indicators are obtained when we average across households). Polyclinics are the second most visited, with an average of 0.82 household members visiting them in a year. For dental care, slightly more household members visit private dentists (0.20) than public ones (0.19). Visits to private doctors (excluding dentists) are less common, at 0.12 per household. Emergency medical aid is used infrequently, with only 0.05 household members per household on average calling for such services. Non-traditional or homeopathic providers are the least visited, with a very low average of 0.004 visits per household per year. These statistics indicate a healthcare system where primary care, particularly family doctors and polyclinics, plays a central role, with a notable presence of private providers in certain areas like dental care.
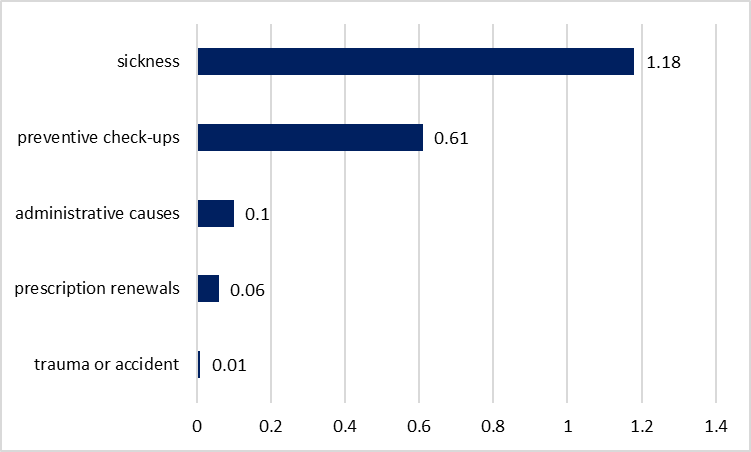
The dataset also includes the reason for the last visit to a provider aggregated at the household level which to some extent may capture typical patterns of healthcare use (figure 4). Sickness is by far the most common reason for visiting a healthcare provider, with an average of 1.18 members per household selecting it. Preventive check-ups are the second most common reason for the last visit, with an average of 0.61 household members per household undergoing such inspections. Other cases are much less common. These statistics suggest a healthcare utilization pattern where curative care for illnesses dominates, but there’s also a significant emphasis on preventive care.
Figure 4. Reasons for last visit to a provider, average number of household members visiting per year
Determinants of catastrophic health expenditures
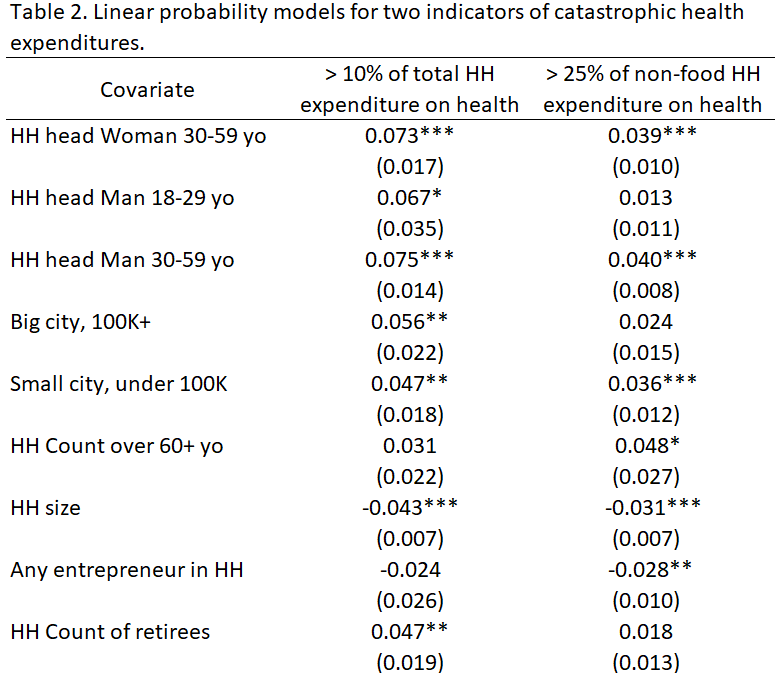
Two indicators of catastrophic health expenditures are further investigated — 10 or more percent of total family budget or 25 or more percent of non-food expenditures – because the other two indicators represent only 2.2 percent of households. Models use robust standard errors with household weights and clustering at the region (oblast) level. Although models that follow don’t necessarily have causal interpretation they still identify important insights about correlates of catastrophic health spending in Ukraine. Only coefficients significant at the 1% level in both models are reported unless otherwise noted.
Households headed by women aged 30-59 have a 7.3 percentage points higher probability of exceeding 10% of total expenditures and a 3.9 percentage points higher probability of exceeding 25% of non-food spending on healthcare. Similarly, male household heads aged 30-59 face increased probabilities of 7.5% points and 4.0% points for the corresponding measures. These differences can be explained by the fact that the base category is a household led by a woman aged 18-29, who may have low healthcare spending due to relatively good health. Conversely, larger household sizes are associated with decreased likelihoods of catastrophic expenditures, with coefficients of -4.3% and -3.1% points for health expenditures exceeding 10% of total family budget and 25% of non-food expenditures, respectively.
Households in small cities (population under 100K) have a 4.7 p.p. higher probability of healthcare expenditures exceeding the 10% threshold of total spending (significant at 5% only), and 3.6 p.p. higher probability that their health spending exceeds 25% of non-food expenditures compared to villages. Likewise, respondents in big cities face an elevated risk (by 5.6 p.p. significant at 5%) of spending more than 10% of the family budget on health services compared to respondents in the countryside. One possible explanation is that the cost of treatment is higher in cities leading to a higher probability of catastrophic expenditures. It is also possible that in cities people have access to more expensive specialized healthcare, which is unavailable in villages.
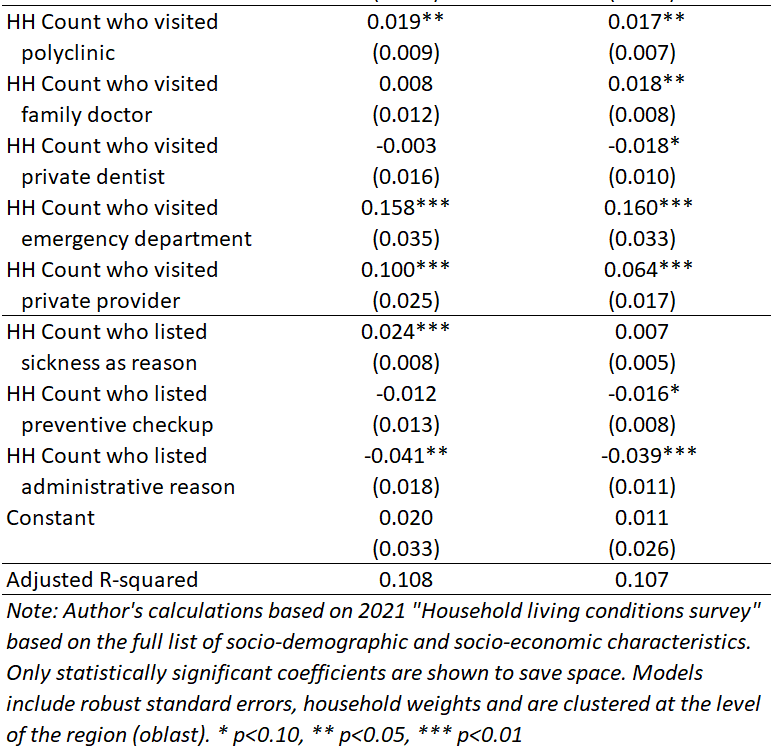
Visiting a polyclinic by each additional member of the household is associated with an increased likelihood of 1.9 p.p. and 1.7 p.p. to exceed the 10% of total expenditures and 25% of non-food spending respectively. Calling for emergency services dramatically raises these probabilities by 15.8 p.p. and 16.0 p.p. (but there are very few such instances in the data potentially indicating a serious health condition). Additionally, visiting a private provider increases the likelihood by 10.0 p.p. and 6.4 p.p. respectively.
Households are 2.4 percentage points more likely to spend over 10% of their total budget on healthcare for each additional member who visited a provider due to illness compared to those whose last visit was due to other reasons. Administrative reasons for the last visit, on the contrary, significantly reduce the likelihood of catastrophic health spending, decreasing it by 4.1 p.p. for the 10% threshold of total spending and 3.9 p.p. for the 25% threshold of the non-food expenditures.
Other factors do not show a significant effect on the likelihood of catastrophic spending. Somewhat surprisingly, economic factors (such as having less than the minimum subsistence level of income or lacking amenities) are not associated with higher risks of catastrophic health expenditure.
Discussion
Increasing the role of primary health care (PHC) as a major pillar of Universal Health Coverage (UHC) is one of the most promising strategies in reducing the burden of catastrophic health expenditures in the world. The WHO showed for a sample of 133 countries that poorest households and particularly those with older, dependent adults, have the highest financial burden which further justifies UHC to cover people of all ages (World Health Organization 2022). In addition, community-based health programs and health education, which are essential to primary health care, empower individuals with the knowledge and resources necessary to reduce the burden of chronic conditions (World Health Organization, 2019). Health systems should focus on cost-effective primary care that can reduce unnecessary and harmful care and also prevent inappropriate hospital admissions (Kruk et al 2018). Poor households can also be protected from catastrophic health expenditures by reducing health system’s reliance on out-of-pocket payments and providing more financial risk protection (Xu et al. 2003).
In the context of Ukraine during the last year before the full-scale invasion, almost all households had positive health expenditures, with the average spending of $230 per household per year. Depending on the definition used, 2.2% to 12.6% of households have suffered from catastrophic health spending.
While some of the findings are consistent with the previous literature (i.e., visiting a private provider increases the probability of catastrophic spending), the unimportance of many socio-economic gradients is somewhat surprising (Aregbeshola and Khan 2018).
The situation could have worsened after the start of the full-scale Russian aggression in 2022. For example, the prevalence of informal payments (which could become catastrophic for certain medical conditions) remained high, especially in the war-affected regions (Terentii, K. 2024). Hence, the topic of catastrophic spending should remain a priority (when the data become available) in the future reconstruction of Ukraine.
References
- Aregbeshola, B.S. and Khan, S.M., 2018. Determinants of catastrophic health expenditure in Nigeria. The European Journal of Health Economics, 19, pp.521-532.
- Eze, P., Lawani, L.O., Agu, U.J. and Acharya, Y., 2022. Catastrophic health expenditure in sub-Saharan Africa: systematic review and meta-analysis. Bulletin of the World Health Organization, 100(5), p.337.
- Kruk, M. E., Gage, A. D., Arsenault, C., Jordan, K., Leslie, H. H., Roder-DeWan, S., … & Pate, M. (2018). High-quality health systems in the Sustainable Development Goals era: time for a revolution. The Lancet Global Health, 6(11), e1196-e1252.
- Terentii, K. 2024. Informal payments for health care services in Ukraine: the impact of war. Vox Ukraine.
- World Health Organization. 2019. Primary health care: Closing the gap between public health and primary care through integration. World Health Organization.
- World Health Organization. 2022. Valuing health for all: Rethinking and building a whole-of-society approach. The WHO Council on the Economics of Health for All – Council Brief #3.
- Xu, K., Evans, D. B., Kawabata, K., Zeramdini, R., Klavus, J., & Murray, C. J. (2003). Household catastrophic health expenditure: a multicountry analysis. The lancet, 362(9378), 111-117.
Disclaimer. This research was financed with U4U non-residential fellowship by UC Berkeley Economics/Haas which didn’t have involvement in the research design, collection, analysis, or interpretation of data, or in the writing of the report.
The author does not work for, consult, own shares in or receive funding from any company or organization that would benefit from this article, and have no relevant affiliations.
Photo: depositphotos.com/ua/
Attention
The author doesn`t work for, consult to, own shares in or receive funding from any company or organization that would benefit from this article, and have no relevant affiliations
