On October 26, 2014, Ukraine had snap elections to Verkhovna Rada, Ukraine’s parliament. A key reason for the snap elections was to restore legitimacy of the parliament after members of the outgoing parliament voted for the so-called dictatorial laws on January 16, 2014. The legitimacy of the newly elected parliament hinges on whether elections were fair. While a number of reputable organizations such as OSCE reported that elections were not fraught with fraud, the rumors of fixed elections continue to circulate in the media. In this post, we use statistical tools to assess whether such rumors have any foundation.
Specifically, we use three statistical methods to detect anomalies that are often linked to election fraud. Finding such anomalies does not prove that fraud in fact happened but it does raise doubts and calls for further investigation. Since results are often hard to interpret in an absolute sense, we use 2012 parliamentary election as the benchmark in our analysis since the election was perceived as dubious.
Tool #1. Voter turnout and party shares
Perhaps the most popular form of fraud is to throw in voter ballots for a party. An implication of this “trick” is that one should see a correlation between the turnout of voters and the share of votes going to a given party. However, interpretation of such correlation may be more complicated in cases where the distribution of voters’ party preference and their activity is not random. For example, people in region A may be more energized than people in region B. To the extent people in region A favor party X rather than party Y, which is favored in region B, we can observe a correlation between turnout and the share of votes going to party Y. One can address a concern like this by controlling for characteristics of various regions – that is, run a regression of this type
![]()
where p, r, s respectively index parties, regions (we use election commission districts) and polling stations; is the share of votes that went to party p at polling station s in region r; is the turnout of voters at polling station s in region r; constant is specific to the region and captures all peculiarities about this district; error is the regression residual. If there is no fraud, one should find the estimate of b close to zero.
We run this regression on the data from the 2012 and 2014 parliamentary elections to put results in perspective. We find that in the 2012 election, the share of votes going to the Party of Regions, the winner of 2012 election and the party of disgraced Viktor Yanukovych, was strongly positively related to voter turnout. Specifically, the estimate of b suggests a one percent increase in voter turnout associated with about 0.24 percent increase in the share of votes that went to the Party of Regions. We can rule out that this estimate of b is by chance. In contrast, the estimates of b for all other parties, except Svoboda, are negative. This result is consistent with the view that the Party of Regions was “stealing” votes from other parties. Note that the coefficient on the Communist party is the most negative suggesting that the Communist party suffered the most from such “stealing”.
In contrast, the share of votes going to People’s front, the winner of the 2014 election, does not show any correlation with voter turnout. Poroshenko bloc, the second most popular party in the 2014 election, does show a positive correlation between the share of votes going to the party and voter turnout. This is potentially troubling but the degree of the correlation is much smaller than that of the Party of Regions in 2012 – the sensitivity of the Poroshenko bloc share to turnout is 5 times smaller than that of the Party of Regions. Overall, results for the 2014 election indicate that the scope of fraud was much smaller than in 2012.
|
Panel A: 2012 elections |
|||||
| Party of regions | Tymoshenko bloc | Udar | Communist party | Svoboda | |
| (1) | (2) | (3) | (4) | (5) | |
| turnout | 0.244*** | -0.062*** | -0.065*** | -0.115*** | 0.025*** |
| (0.020) | (0.012) | (0.006) | (0.009) | (0.008) | |
| Observations | 33,474 | 33,474 | 33,474 | 33,474 | 33,474 |
|
Panel B: 2014 elections |
|||||||
| People’s front | Poroshenko bloc | Samopomich | Opposition bloc | Radical party | Batkivschina (Tymoshenko) | Svoboda | |
| (1) | (2) | (4) | (5) | (6) | (7) | (8) | |
| turnout | 0.003 | 0.049*** | -0.006 | -0.028*** | -0.016*** | 0.020*** | -0.003 |
| (0.008) | (0.015) | (0.004) | (0.008) | (0.005) | (0.005) | (0.003) | |
| Observations | 29,497 | 29,497 | 29,497 | 29,497 | 29,497 | 29,497 | 29,497 |
Notes: The dependent variable is the share of votes going to a party indicated in the first row of each panel. Standard errors are clustered by region (election commission districts). The unit of observation is a polling station. ***, **, * denote statistical significance at 10, 5, and 1 percent respectively.
Tool #2. Voter turnout and contribution of extreme stations
Fraud is likely to be concentrated in a relatively small number of polling stations but these stations can bring a significant share of votes at the national scale. It is suspicions if a bulk of votes comes from a handful of polling stations with very high turnouts. Obviously, some polling stations can have large turnouts but, statistically, they should make little difference for the total number of votes going to any given party. Intuitively, it is possible statistically to have high turnout rates for polling stations with a few registered voters but high turnout rates are not very likely to happen in polling stations with a large number of voters. For example, if a polling station has 5 registered voters, it is relatively likely that all 5 voters show up and vote. In contrast, if a polling station has 10,000 potential voters, it is extremely unlikely that all 10,000 would show up.
One way to detect this anomaly is to examine the cumulative contribution of polling stations as a function of turnout. If everything is fair, one should observe that as turnout approaches 100%, the share of votes going to a given party at the national level flattens. In other words, a flat part of the cumulative distribution signals that these extreme polling stations make no effect for the results at the national level. On the other hand, if the cumulative distribution rises with turnout close to 100%, there is a reason to worry: these polling stations not only have statistically unlikely turnouts, but also votes unusually concentrated for a given party.
Figure 1 below plots such cumulative distributions for the Party of Regions in 2012, People’s front in 2014, and Poroshenko bloc in 2014. Note that for the last two parties the curves are flat after about 90 percent turnout. In contrast, the curve for the Party of Region continues to rise all the way up to 100%. This positive slope is a clear sign of potential fraud: large districts had unusually high voter activity and these districts were atypically strongly in favor of the Party of Regions. Again, when we put the 2014 election vis-à-vis the 2012 election, we have less evidence of a fraud in 2014.
Figure 1. Contribution of extreme polling stations
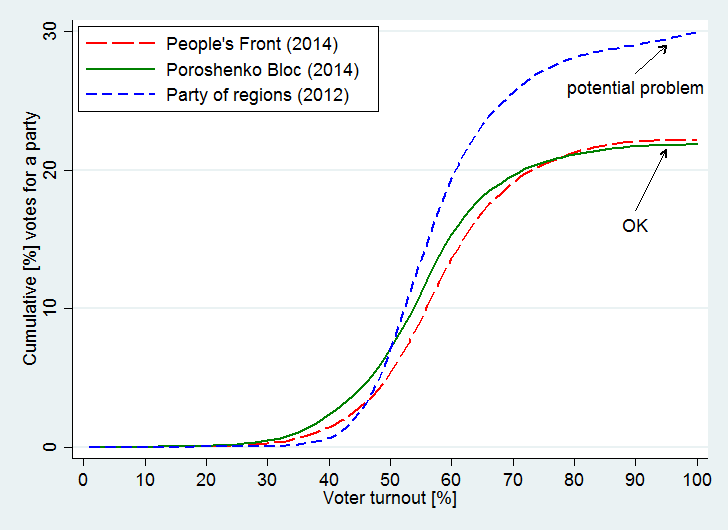
Notes: the horizontal axis shows turnout of voters. The vertical axis shows the cumulative contribution of polling stations with turnout lower than indicated on the horizontal axis to the total share of votes at the national level.
Tool #3. Benford’s law
Around 1938, physicist Frank Benford found that a simple relation could describe the distribution of first digits in real-life data. Specifically, in about 30% of cases, the first digit in real-life data is “1”; in about 18% of cases the first digit is “2”, and so on. This relationship was called Benford’s law. Hal Varian, a famous economist (now the chief economist at Google) and a former colleague of one of the authors, suggested that the law could be used to detect election fraud. Specifically, if the number of votes cast for a given party in areas where this party got more than the typical share of votes, Benford’s Law is violated; one should look more closely into those areas. Intuitively, perpetrators at a polling station cannot appreciate that their manipulations alter the distribution of data at the aggregate level and so these manipulations make aggregate data look unnatural.
Figure 2 plots the distribution of first digits as predicted by Benford’s law (black line) and the distribution for the Party of Regions in 2012 (blue line with squares) and for the combined votes for People’s front and Poroshenko bloc in 2014 (red line with circles). Note that the red line is close to the black line, which is consistent with minimal manipulation of election results. On the other hand, the blue line clearly departs from the black line. Specifically, there are too many 1’s, 7’s, 8’s, 9’s, and too few 2’s, 3’s, and 4’s. While it is hard to interpret the absolute trends in shares, the relative departure from Benford’s law in 2012 was clearly much larger than that in 2014, which can be interpreted as a lower level of fraud in 2012.
Figure 2. Benford’s law
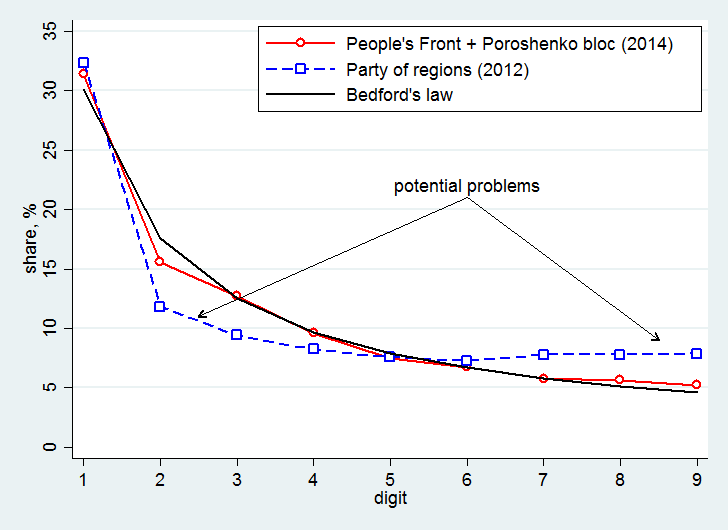
Notes: the horizontal axis shows the first digit in the number of cast ballots across polling stations. The blue line shows the distribution of digits for polling stations (2012 election) where the Party of Regions got the share of votes larger than the median share. The red line shows the distribution of digits for polling stations (2014 election) where People’s front and Poroshenko bloc combined got the share of votes larger than the median combined share.
Mark Twain once famously said that there are three types of lies: “lies, damned lies, and statistics.” Apparently, he was not aware of elections in Ukraine where election results could tell lies far worse than statistics could tell. Our statistical tools suggest that the scale of election fraud in the 2014 election was considerably smaller than in the 2012 election. To the extent one believes in statistics, he or she can take our results as a sign of science approving election results in 2014.
An afterword. Ukraine has a mixed electoral system, with 53,2% of seats allocated under party lists and 46,8% allocated in 198 constituencies. Our analysis was conducted only for the party lists. A part of the public discussion in Ukraine focuses on the question of whether Ukraine should move to 100% party list system in order to remove alleged abuse in the individual constituencies. Hence, it would be valuable to complement the analysis in this post with that of the anomalies in the remaining 198 constituencies. It is also extremely interesting to consider the counterfactual composition of the new Ukrainian parliament if the turnout in the East affected by the security crisis were on par with that in the rest of the country.
Data
2014: 99,52% voting stations covered, stations located abroad not included
2012: 99,59% voting stations covered, stations located abroad not included
2014 data
Accessed 30.10.2014
2012 data:
Accessed 03.11.2012, currently not available for some technical reasons
Files used for analysis are available here
This is a revised and extended version of the post appeared on the Monkey Cage Blog at the Washington Post


Attention
The authors do not work for, consult to, own shares in or receive funding from any company or organization that would benefit from this article, and have no relevant affiliations