Despite Ukraine’s declared orientation towards gender equality, the areas of activity of Ukrainian enterprises can still be arbitrarily divided into “male” and “female“. In this article, we used data from the State Statistics Service of Ukraine to analyze which industries and types of enterprise have come closest to the equal distribution of managerial positions among women and men, as well as where male/female managers prevail.
Key findings
- The female employment rate fell from 58% in 2010 to 44% in 2020.
- Although women make up almost half of Ukraine’s working population, they hold the highest positions in only 27% of the 329,000 enterprises surveyed (for more details, see “Data and Methodology”).
- The proportion of female managers decreases with an increase in the size of the enterprise. The exceptions are education, healthcare, governance and administrative services, as well as information technology (IT).
- Women are often heading enterprises working in the education, trade, tourism and beauty industries. Excavating and procurement companies, and those producing equipment and metal products are the ones with the least women managers running them.
- In different regions, women are running nearly the same proportion of enterprises, namely 20-30%. A relatively higher proportion of female managers is seen in the south-eastern regions (26-28%).
- Most female managers (77.5%) are in charge of communal enterprises (i.e. hospitals, kindergartens, parks, etc.) and trade unions (61.6%). The smallest number of women managers are found in religious organizations (4.6%) and state-run enterprises (3.1%).
This article was created with support from the UNDP project “Civil Society for the Development of Democracy and Human Rights in Ukraine” implemented with financial support of the Ministry of Foreign Affairs of Denmark.

Context
People’s behavior and decisions are often influenced by stereotypes, specifically when choosing a profession or career. Research shows that segregation in Ukraine is both horizontal (occupations are divided into “female” and “male”) and vertical (i.e. managerial positions are mainly held by men).
According to a UN Recovery and Peacebuilding Program survey (2020), nearly 60% of Ukraine’s population believe that there is a gender-based division of occupations in our society. Occupations requiring the skills to operate machinery or physical strength, e.g. locomotive or tractor drivers, construction workers, and steelmakers are believed to be “male” by most respondents, while occupations like accountants, florists, fitness trainers, nutritionists, etc. are considered to be “female”. 38% of respondents believe that “women should not seek to master typically “male” trades” (49% of boys and 31% of girls aged 13-23 fully or partially agree with this statement).
The presence of gender-specific stereotypes and segregation in vocational training and employment is also addressed in a study by O.Kupets (2010) for the International Labor Organization. During the survey, respondents noted that among the factors which are most likely to limit women’s access to better paid, more prestigious jobs and exacerbate existing inequalities are discrimination by employers and gender stereotypes. At the same time, the study shows that due to the “traditional” responsibilities associated with unpaid care work, women begin to build a career after turning thirty. For instance, the level of economic activity of women aged 20-29 and 30-39 differed by 7.6 percentage points (72.3% and 79.9%), while this difference among men was only 1.3 percentage points (88,6% and 89.9%, respectively). Employed women focus mainly on the public sector: specifically on education, healthcare and governance (46.1%). Talking about industry, their main focus is on the food and consumer goods industry (20.2%).
Kostiuchenko (2019) found that as of 2018, the proportion of women among professionals in the area of physics, mathematics and engineering, and technical specialists in applied sciences and technology was three times less than men (with women making up 22-24% in this area). At the same time, girls have the best ZNO scores in mathematics (Mykhailishyna (2018)), with the difference being 8.6 points. Therefore, a lack of mathematical skills or interest in this subject cannot account for such a split in the profession.
In the energy sector (that is usually considered to be “male”), the proportion of women workers is still quite low, namely 23-27% in 2013-2017. Furthermore, women in the energy sector are 3.4 percentage points less likely to occupy managerial positions than men (Diachuk et al., 2019).
A UNDP study on the gender distribution of business managers and individual entrepreneurs found that considerably more female managers are engaged in educational enterprises (73%) and household activities (82%), while an average of 85% of enterprises in the transport, construction and excavating industries are run by men. The proportion of female managers in Kyiv (34%) is the lowest among the regions of Ukraine, while it is the highest in the Donetsk, Luhansk and Khmelnytskyi regions (over 45%). The biggest number of legal entities and individual entrepreneurs are located in small towns (with a population of 15-70 thousand), and the smallest – in large cities (with over 900 thousand population).
A low proportion of women is also seen in Ukrainian politics, although Zakharova and al. (2017) identified positive trends. There were only 12 women (3%) in the first convocation of the Verkhovna Rada, and already 53 (12%) in the eighth. Parliament of the ninth convocation (as of August 2019 – the first session for the deputies of the Verkhovna Rada of the ninth convocation) had 21% of female MPs. The 2020 local elections were the first to apply gender election quotas in practice. Although they did not work as intended everywhere, there is time to work on the mistakes before the next election.
Ukrainian laws lay the foundations for ensuring gender equality. The Code of Labor Laws adopted in 1971 and later amended is still in effect today focusing on ensuring equal rights and opportunities for women and men. Article 24 of the Constitution of Ukraine (1996) also guarantees the equality of men and women, including in vocational training, work and reward for it.
At the same time, Order No.256 of the Ministry of Health on approving the list of heavy work and work with harmful and dangerous working conditions, prohibiting the employment of women was in force in Ukraine from 1994 to 2017. This list included 458 professions like boiler operator, planisher, bricklayer, driver (bulldozers and some other types of machinery), assembler, grubber, etc. Because the Order was abolished not so long ago and not in full, it is not surprising that many of these professions remain purely “male” in the minds of people.
To overcome this perception, in 2020, the Communication Concept in the Field of Gender Equality was approved by the Cabinet of Ministers. Among the ways to address gender inequalities listed in the Concept is the promotion of wider participation of women and men in areas of work in which they are less represented.
According to the State Statistics Service of Ukraine (SSSU), women make up 48% of the employed population in Ukraine (about 8 million out of 15.6 million workers).
Figure 1 shows the trend in the proportion of employed women and men (among all women and men) during 2010-2020.
Figure 1. Female and male employment, 2010-2020, %
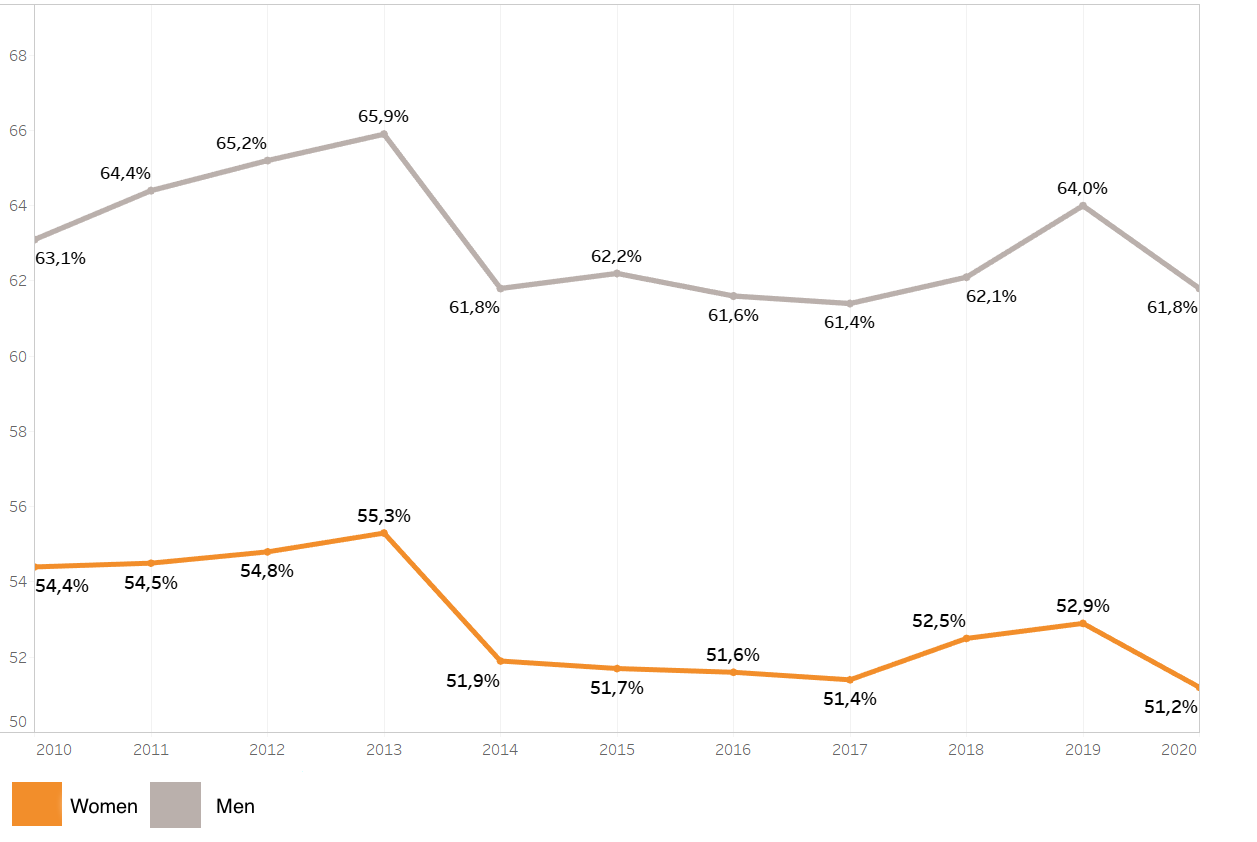
Source: SSSU data
During 2010-2012, approximately 58% of women were employed. This proportion fell to 52% in 2013-2014. In 2020, the proportion of employed women and men was 51.2% and 61.8% respectively, which may be due to lockdowns.
Figure 2 shows the trend in the proportion of self-employed women and men in the total number of economically active women and men during 2010 -2019.
Figure 2. The trend regarding self-employed women and men aged 15-70, 2010-2019, %
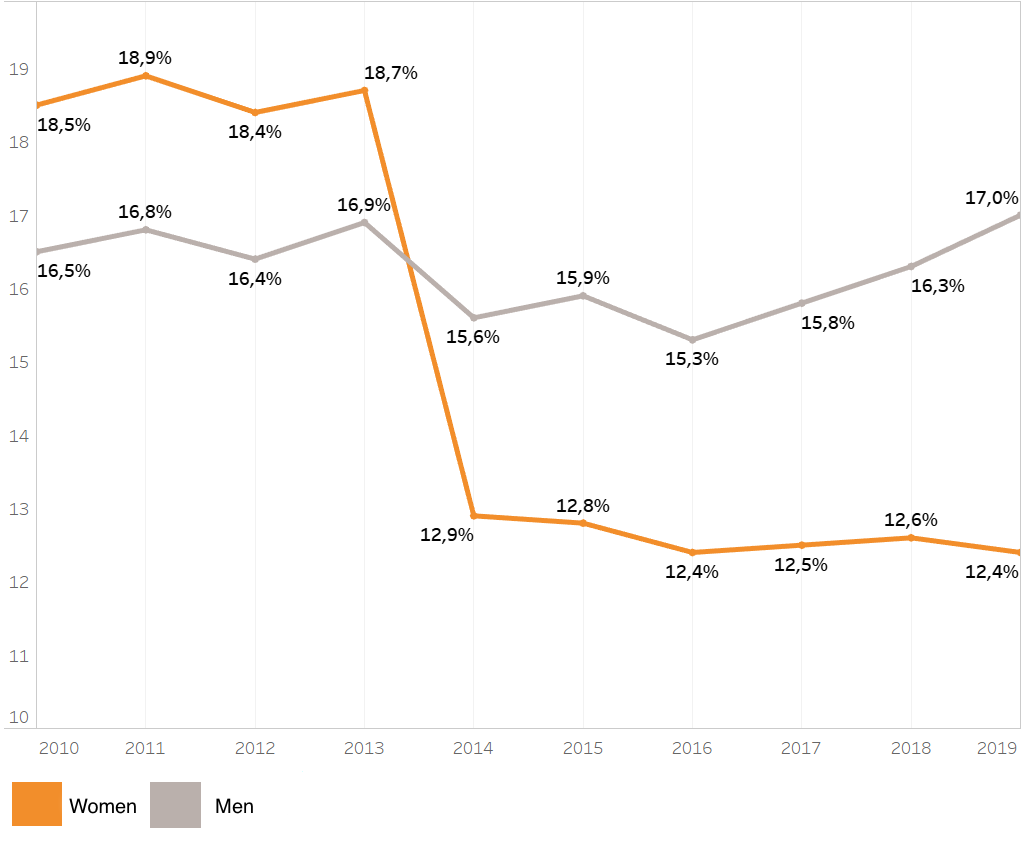
Source: SSSU data
During 2012-2013, the proportion of self-employed women was, on average, 18.6%. Because the temporarily occupied territories were excluded from the calculation, there was a sharp decline in the proportion of self-employed women, from 18.7% to 12.9% since 2014, with the proportion of self-employed men declining only by 0.7%. This may indicate that in the temporarily occupied territories, the proportion of self-employed women had been much higher than the proportion of self-employed men. During the years 2014-2019, the average proportion of self-employed women was 12.6%.
The proportion of female employment in various occupations changed slightly from 2010 (Figure 3). In most occupations, the proportion of female workers declined somewhat. Slight increases in the proportion of skilled women working with tools, female office employees and managers were recorded.
Figure 3. The proportion of employees by occupation type, 2010 and 2019,%
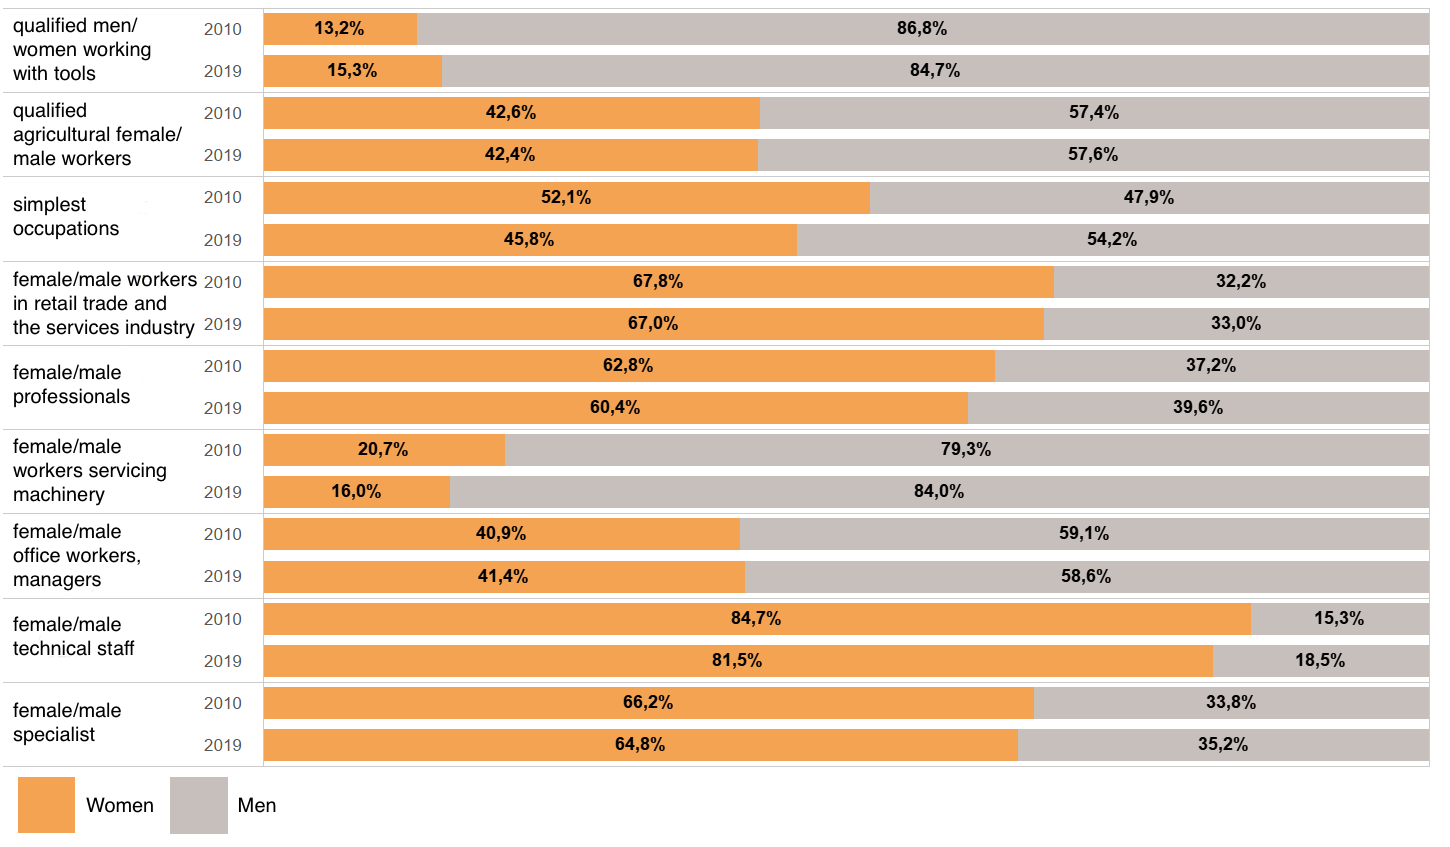
NOTE 1 “Technical staff” means those in positions requiring a “junior specialist” or lower qualifications level. It could be male and female press operators, cashiers, postal workers, etc.
Note 2: Follow the link for a full-size image.
Source: SSSU data
Methodology and data
During desk research, we used a sample that included data of active financial and non-financial enterprises (S11 and S12 according to the Classification of Institutional Sectors of the Economy (CISE) in Ukraine as of January 1, 2020 – nearly 387 thousand enterprises, which is 28.6% of the total number. About a thousand of them are separate divisions of foreign legal entities). For each enterprise, the following information is available:
- the legal status of the enterprise (legal entity or separate division of a legal entity);
- size in terms of the number of employees: up to 10 people (a micro-enterprise), 10-49 people (a small enterprise), 50-249 people (a medium enterprise), and over 250 people (a large enterprise);
- organizational and legal form (KOPFG code);
- region (KOATUU code);
- area of activity;
- number of male and female employees;
- gender of the manager (female/male). The manager’s gender was identified with the help of an algorithm based on the given name, surname and patronymic. It was not possible to identify the manager’s gender only for three companies from the entire sample.
About 58 thousand enterprises reported having zero (male or female) employees or abstained from answering. These enterprises were excluded from the analysis because it was impossible to determine their size. Thus we obtained a sample of nearly 329 thousand enterprises.
Results
As of January 1, 2020, women held managerial positions only at 26.7% of the enterprises under review.
Does the number of women and men in managerial positions depend on the size of the enterprise? Yes, the proportion of male managers increases along with the size of the enterprise (Figure 4).
Figure 4. The proportion of men and women in managerial positions by enterprise size, %
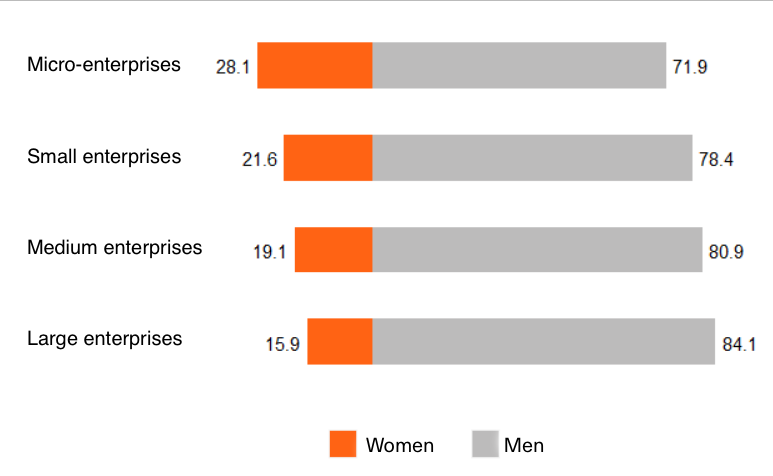
Source: SSSU data
That is the case in most industries (Figure 5). Education, provision of healthcare services and social assistance, governance and administrative services, as well as IT, stand out in the overall picture. In these areas, the picture differs from a general trend whereby the proportion of female managers decreases with an increase in the size of the enterprise.
The proportion of women among the managers of small and medium educational enterprises is, therefore, higher. There are only 12 large enterprises in the area of education, and they are all headed by men. In IT, the proportion of enterprises headed by women is nearly the same for enterprises of all sizes (29-31%). In healthcare and social assistance, this proportion is nearly the same for micro-, small and medium enterprises, while it is lower for large enterprises. In governance and social insurance, the proportion of female managers in micro- and large enterprises is more than twice as high as in small and medium enterprises. And for administrative services, the proportion of female managers in small, medium and large enterprises is almost the same.
Figure 5. The proportion of managers by industry and enterprise size, %
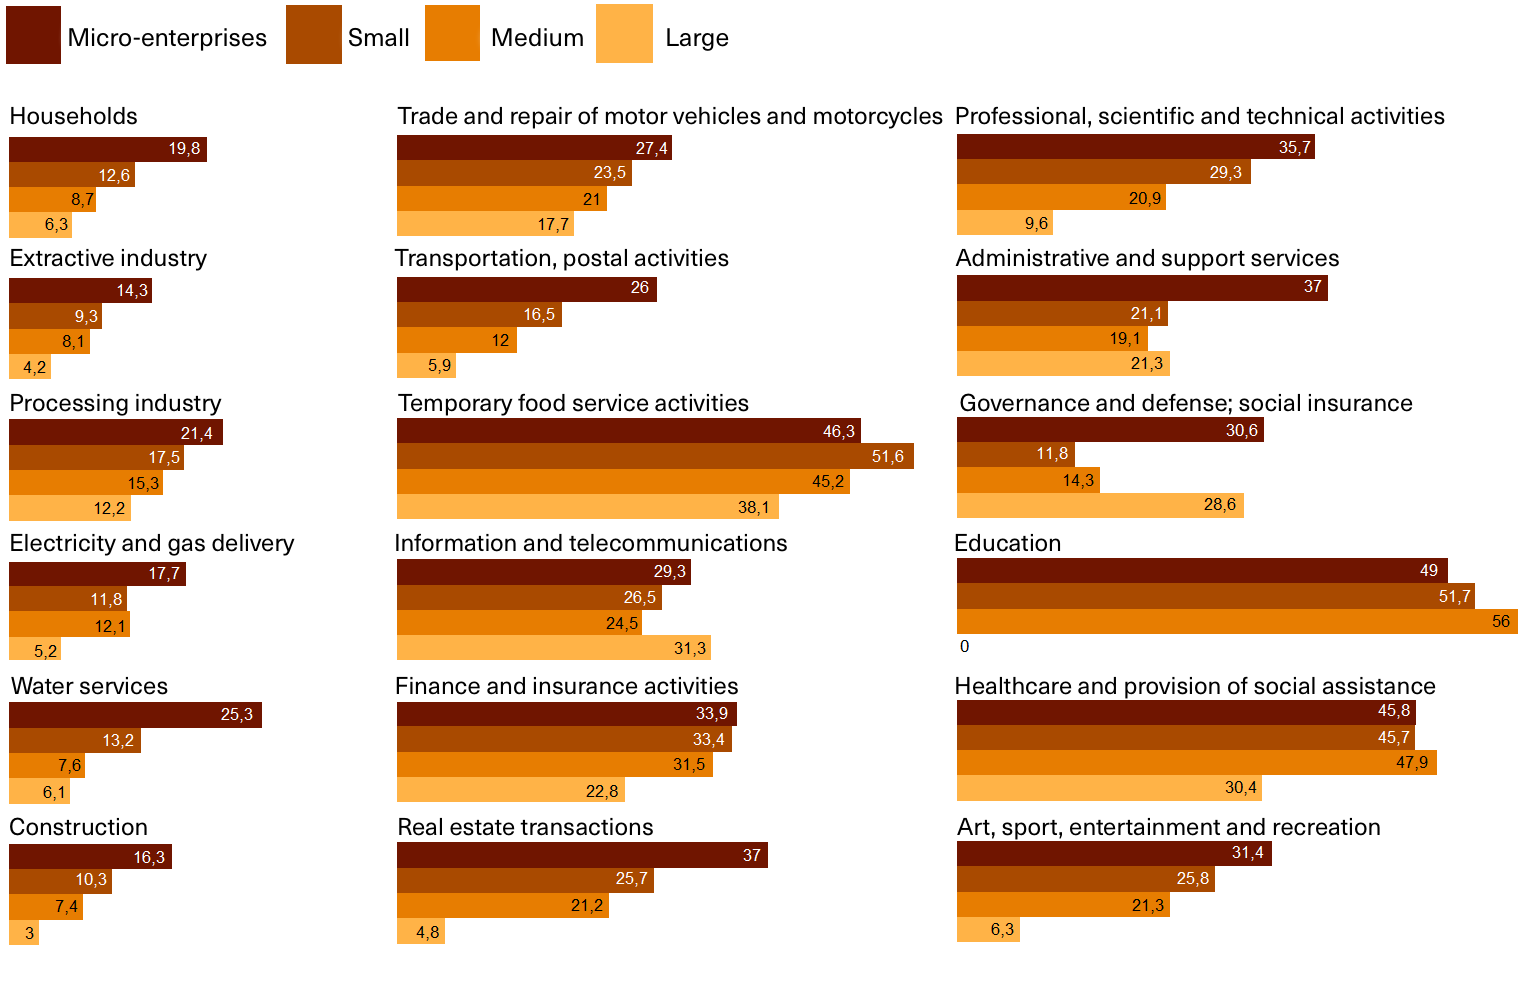
Note. Follow the link for the table with data and full names of industries
Note 2: Follow the link for a full-size image
Source: SSSU data
In Figure 6, the employment areas with the highest proportion of women and men in management are shown. The table for all areas is available here.
Women most often run enterprises in the education, beauty, trade, and tourism industries. The enterprises run by female managers the least are those engaged in nonferrous metal casting and hunting, as well as in industrial production of equipment and other metal products. The highest gender parity areas comprise manufacturing fur products, selling newspapers and stationery at retail, providing other types of social assistance without lodging, and vocational education. Therefore, in Ukraine, a division into male and female jobs is still there.
Figure 6. Areas with the largest proportion of women and men in management,%
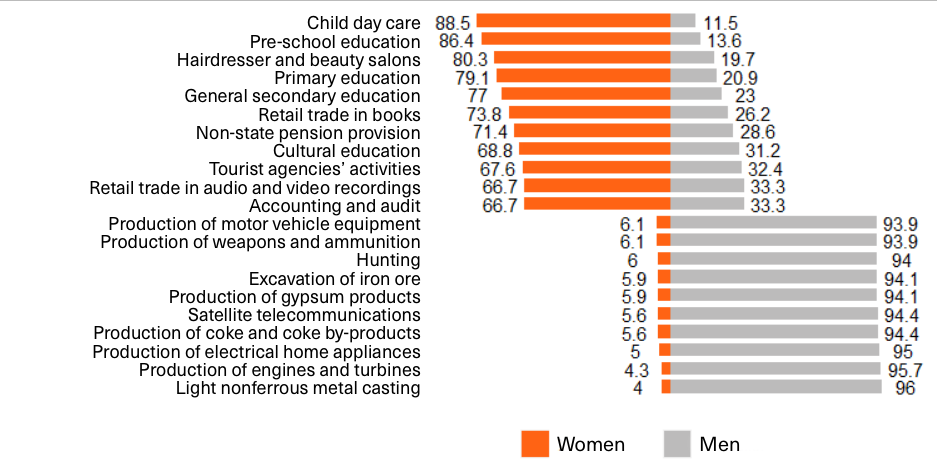
Source: SSSU data
Does the proportion of women-run enterprises vary by region?
In the regional context, there is almost no difference (Figure 7): in most areas, the proportion of female managers is 70-80%, with women running 20-30% of enterprises. At the same time, the proportion of female managers is slightly higher in the south-eastern regions, especially in the Odesa region, as well as in Kyiv.
Figure 7. Distribution of the proportion of female managers by region
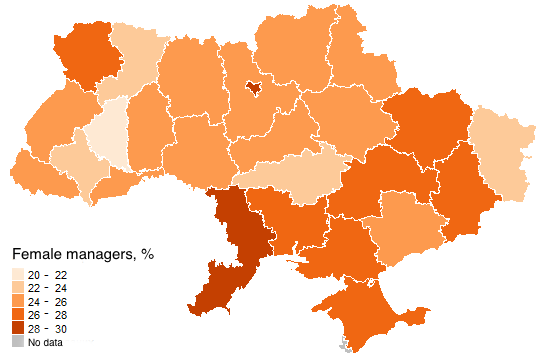
Source: SSSU data
The authors of the UNDP report noted that the proportion of female managers of legal entities and individual entrepreneurs in Kyiv (34.33%) is the lowest among all regions of Ukraine, with the highest proportion observed in the Donetsk, Luhansk and Khmelnytsky regions (over 44.5 %). According to the results of this study, the highest proportions of female managers of legal entities are observed in Kyiv (28.9%) and the Odesa region (28.4%), and the lowest in the Ternopil region (20.6%). These discrepancies are accounted for by the fact that our study includes only legal entities, while the UNDP report contains data about both legal entities and individual entrepreneurs.
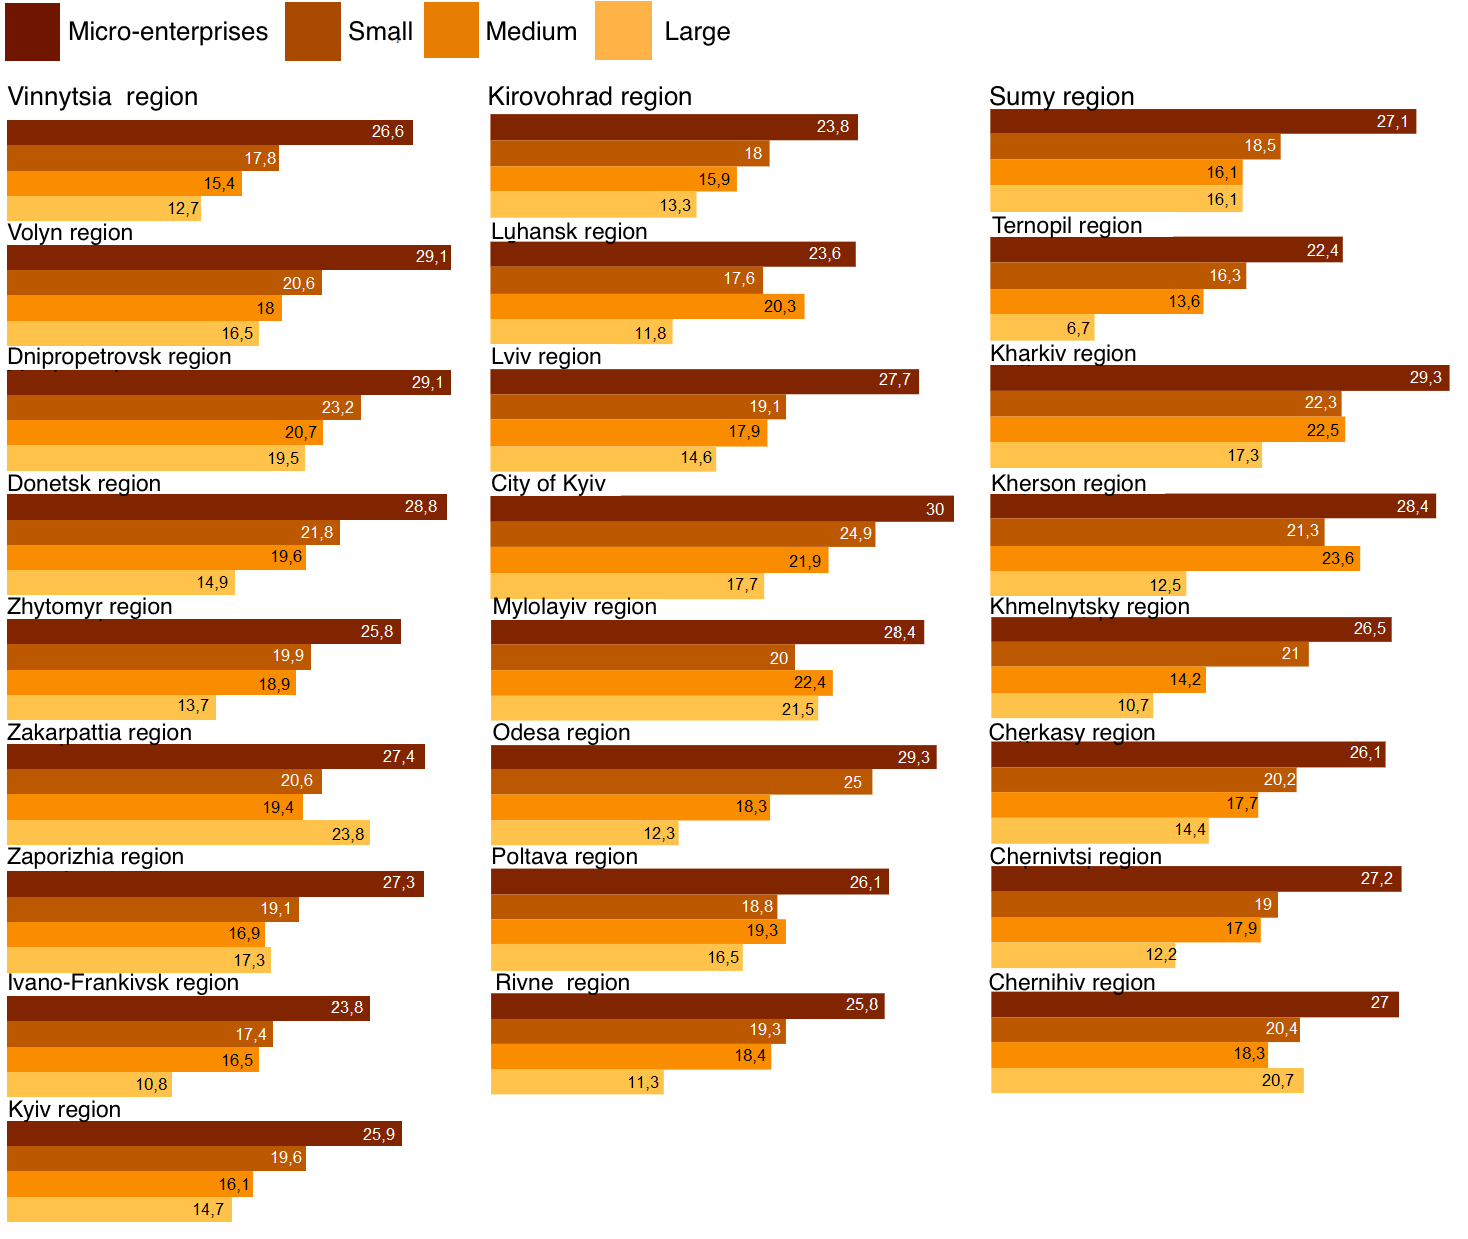
In nearly every region apart from Zakarpattia, Mykolaiv and Chernihiv, the case remains the same: the bigger the enterprise, the smaller the proportion of female managers.
Figure 8. The proportion of female managers by region and enterprise size, %
In Figure 9, we looked at regional differences in the proportions of female managers running enterprises in different industries. The length of each horizontal line in the Figure shows the difference in the proportions of female managers in the regions where they are the highest and lowest for a particular industry. It turns out that in some industries, the proportion of female managers is nearly the same for all regions. These are for the most part the “traditional” branches like agriculture or industry. For example, in construction, the proportion of female managers is the lowest in the Volyn region (10.4%) and the highest, but still low, in the Donetsk region (18%).
By contrast, in finance and insurance, the lowest proportion of women-run enterprises is seen in the Zhytomyr region (13%) and the highest (56.5%) in the Luhansk oblast. The difference between these regions is quite large. In the hotel and restaurant business, the proportion of female managers also greatly varies by region: from 28% in the Kirovohrad region to 62% in the Volyn region.
Figure 9. The proportion of female managers by industry and region,%

Note 1: Due to the incomplete observations in the sphere of Governance, the results can be ignored.
Note 2. “maximum” and “minimum” indicate the values of the region with the largest and smallest proportion, respectively; “industry average” is the average value of the proportion among all regions.
Source: SSSU data
Additionally: whether the type of enterprise affects the proportion of female managers
Apart from the data referred to in the “Data and methodology”, we analyzed the SSSU observation “Women-run entities by organizational and legal form“, as of January 1, 2021.
Most female managers (a whopping 77.5%) run communal entities (i.e. legal entities engaged in non-profit activities such as hospitals, kindergartens, parks, etc.). Significantly fewer female managers run for-profit communal entities, namely 33.8%. A large proportion of female managers run trade unions (61.6%).
Men and women are equally represented in the management of self-organized institutions (house, street, or neighborhood committees) and associations of co-owners of an apartment building or condominium (“OSBB”), consumer associations and private organizations (i.e. privately-owned museums, kindergartens and schools).
The lowest number of female managers is seen in religious organizations (4.6%) and state-run enterprises (3.1%). Also, very few women run concerns (7.5% of managers).
Conclusions
In Ukraine, a division of economic sectors into “female” and “male” is still very noticeable. Women are more likely to run small enterprises with a social component such as education and healthcare establishments, trade unions, consumer associations, and the like. While at the same time, one is more likely to come across a male manager in large industrial enterprises. State-run enterprises and religious organizations remain an exclusively “male” thing. Given the positive trends in other areas, we hope that such a clear demarcation will eventually become a thing of the past and that everyone will choose a line of work based on their preferences rather than legal constraints (which, fortunately, were largely lifted in 2017) and social pressure.
Appendices
Appendix 1. Classification of enterprises by size
| Size | Number of employees |
| Micro-enterprise | up to 10 |
| Small enterprise | up to 50 |
| Medium enterprise | up to 250 |
| Large enterprise | over 250 |
Source: Part 2 of Article 2 of the Law on Accounting. zakon.rada.gov.ua/laws/show/996-14#Text
Appendix 2. Women-run legal entities, by region
Appendix 3. Women-run legal entities by organizational and legal form

Attention
Автор не є співробітником, не консультує, не володіє акціями та не отримує фінансування від жодної компанії чи організації, яка б мала користь від цієї статті, а також жодним чином з ними не пов’язаний