The research was initiated by the State Statistics Service of Ukraine jointly with the World Health Organization to compare Ukraine’s implementation of the Sustainable Development Goals using global and national measurement scales based on UN ESCAP’s methodology with Goal 3: Good Health and Well-being as a case study.
Global and National Measurements of Ukraine’s Progress in the Goal of Good Health and Well-Being (a pilot study)
The COVID-19 pandemic has been a real challenge for healthcare systems around the globe, negatively affecting countries’ prospects for achieving the Sustainable Development Goals (SDGs). It has made it more difficult to achieve many goals – for example, overcoming poverty, ensuring gender equality and quality education. However, in this article, we focus on Goal 3: Good Health and Well-being. What progress in this goal has been made in Ukraine? Read the article to learn how we measure it and what indicators it is appropriate to collect in order to obtain a more complete picture.
The Sustainable Development Goals adopted by all UN members states in 2015 as a universal call to action to end poverty, protect the planet and ensure well-being. To keep track of the progress towards the goals, the UN Statistical Commission has developed SDG Indicators. Each country that has joined the initiative can use these indicators or adapt them to their needs, considering the availability of data. The indicators in the first approach are referred to as “global” and in the second, as “national”.
The report “Towards a Healthier Ukraine: Progress on the Health-Related Sustainable Development Goals 2020, prepared by experts from the World Health Organization, showed that Ukraine’s approach to nationalizing SDG indicators sometimes complicates the comparison of Ukraine’s achievements with other countries’ achievements.
In this article, we measure Ukraine’s progress towards achieving the Good Health goal by applying global indicators. In our opinion, Ukraine should introduce another 15 indicators to the national system of progress measurement for this goal, as recommended by the UN.
The article was written within partnership of the World Health Organization, State Statistics Service of Ukraine and think tank VoxUkraine “Health-Related Sustainable Development Goals and Health in Ukraine”. Under the project, the partner organizations jointly held four public discussions on methods of monitoring and measuring countries’ progress towards achieving SDGs, principles of defining SDG indicators, particularly in healthcare, and Ukraine’s capacity to review the indicators and targets of the Sustainable Development Goals. Videos of the events can be found on the YouTube page of the State Statistics Service of Ukraine (1, 2, 3, 4).
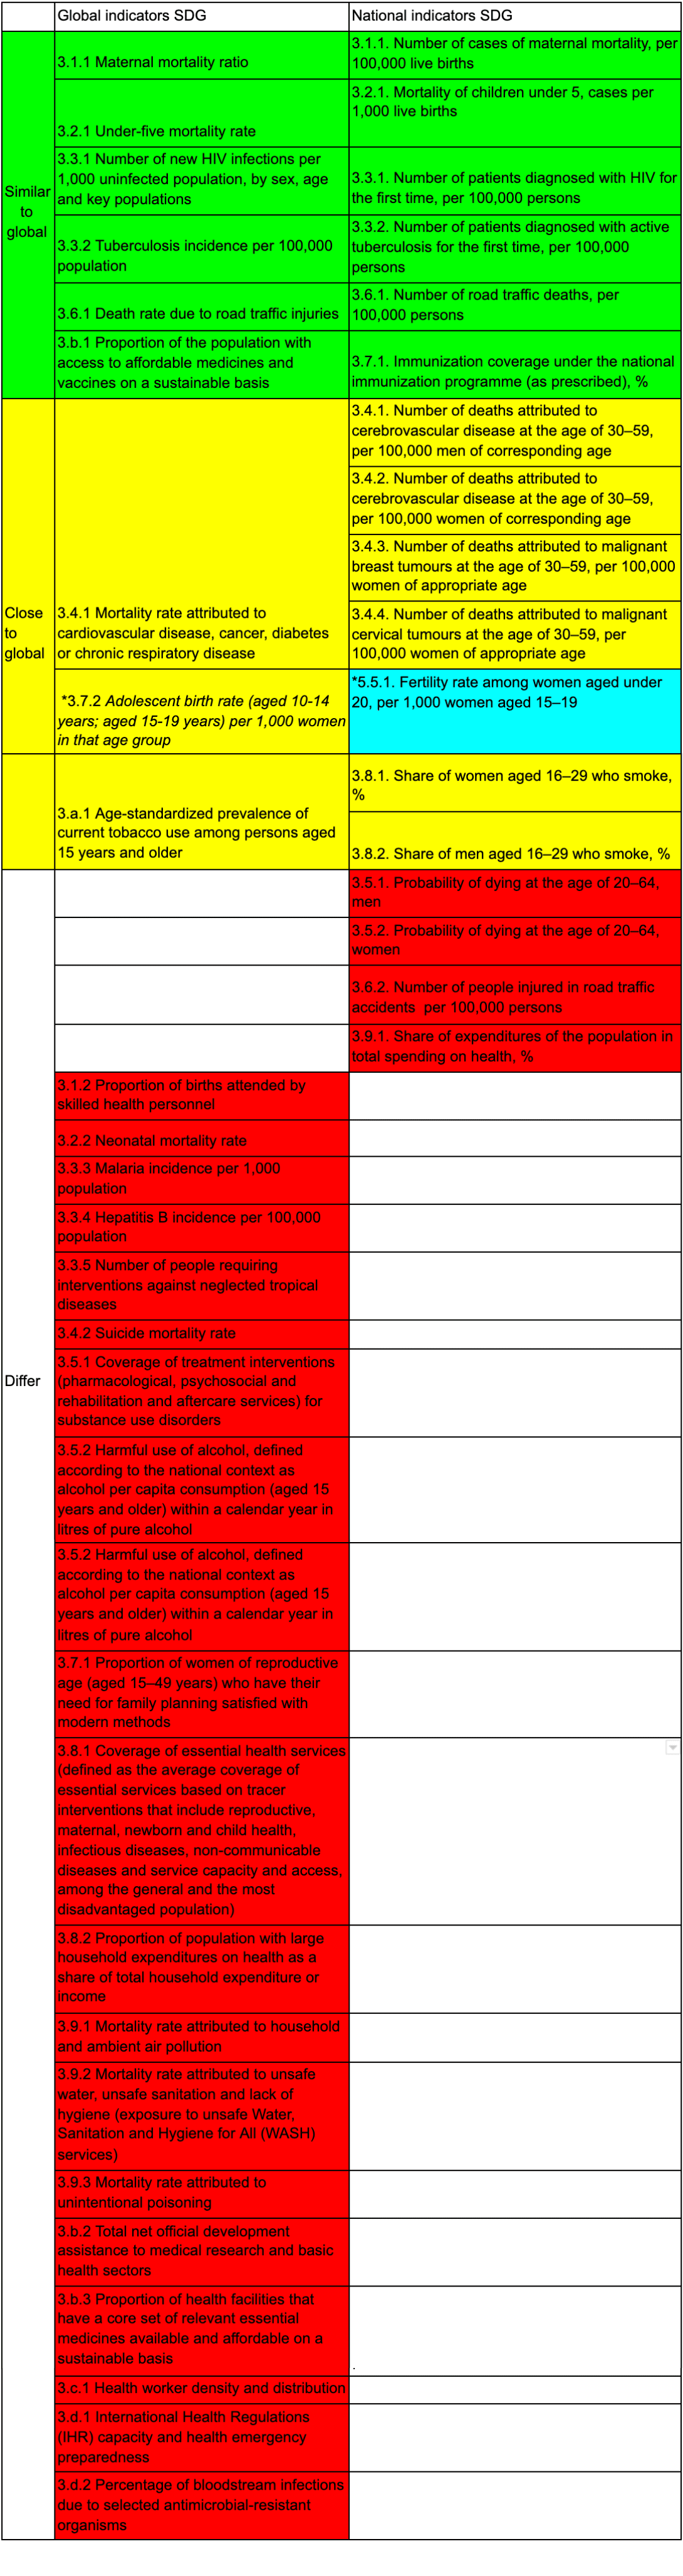
Ukraine measures progress towards achieving the Sustainable Development Goals using 183 indicators. 22 of them fully correspond and 72 are analogous to the global indicators, with the remaining 89 being added by Ukraine to the SDG framework with consideration to our national specifics.
The global indicator framework for Goal 3 – Good Health and Well-being – includes 28 indicators. Ukraine adapted it to form the national framework of 16 indicators (Figure 1). The national framework includes the following 8 global indicators: maternal mortality ratio, under-5 mortality rate, number of new HIV infections, tuberculosis incidence, death rate due to road traffic injuries, current tobacco use among persons (men and women), and proportion of the target population covered by vaccines (with one more indicator being included within the Gender Equality goal). The global mortality rate attributed to cardiovascular diseases, cancer, diabetes or chronic respiratory diseases is presented in Ukraine by 4 indicators (mortality attributed to cerebrovascular (non-infectious) diseases, mortality from breast and cervical cancer). Ukraine also keeps track of 4 other indicators that are not part of the global framework: death probability at 20-64 years for women and for men, number of people injured in road accidents, and proportion of household expenditures as a share of total health expenditures (see Table 1 in the Appendices).
Ukraine does not monitor 19 indicators of the global indicator framework for SDGs, such as proportion of births attended by skilled health personnel, neonatal mortality rate (newborns up to 28 days of age), malaria and hepatitis B incidence, number of people requiring interventions against neglected tropical diseases, suicide mortality rate, etc.
Figure 1. Comparison of the list of global nationalized indicators for the third Sustainable Development Goal “Strong health and well-being”
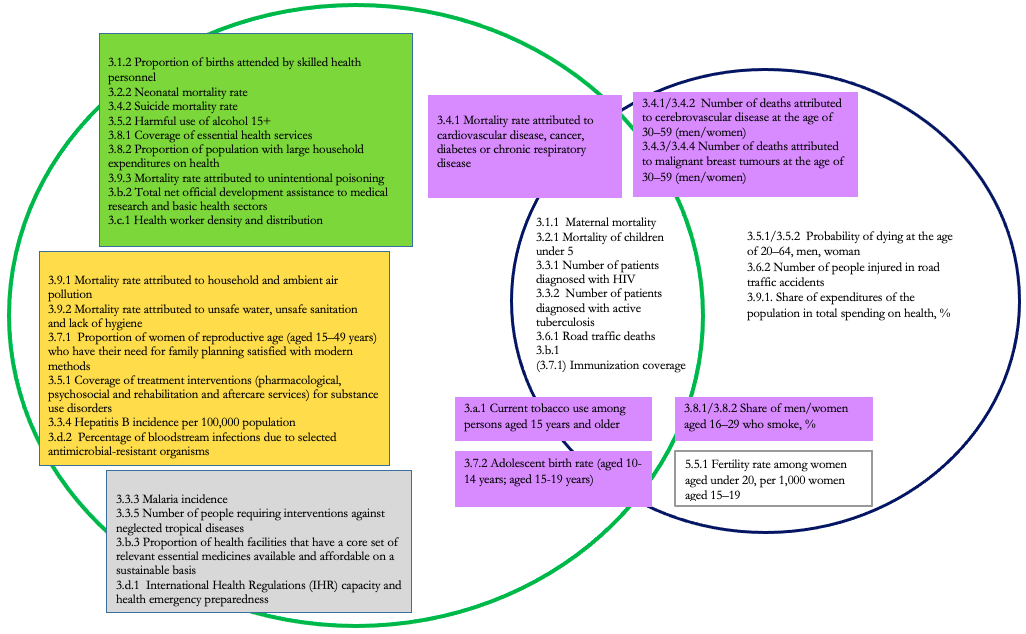
In this figure, blue denotes national indicators, green denotes global indicators (those within the intersection of the circles belong to both). Purple denotes indicators that partially reflect but are not identical to global indicators (they can be explained further). In the left part of the Figure, there are indicators that we recommend including within the national ones. Green denotes those, for which there is data in the UN system (with the data on expenditures with an asterisk most likely being incorrect). The yellow rectangle contains those for which there is no data in the UN. The grey rectangle contains indicators that are irrelevant to Ukraine.
see Table 1 in the Appendix for the full names of the indicators
Methodology
For each indicator in the national framework, the government set targets that Ukraine intends to achieve by 2030. In order to understand whether a country is moving towards this Goal at a sufficient pace, the UN Economic and Social Commission for Asia and the Pacific (UNESCAP) developed a methodology for measuring countries’ progress towards the SDGs.
In this approach, two indices are used by the UNESCAP to assess progress towards the SDGs: current status and anticipated progress gap.
The initial data for calculating the indices for each SDG indicator are the actual value of the indicator from 2000 to the current year and the target value for 2030. If no index values are available for some years, the available data is used. If the target value for the indicator has not been set, it can be calculated based on the values and behavior of the indicator in other countries in the region. Target values can be set by applying a “champion area” approach. According to this methodology, a target value for each indicator should be set based on the data from the top five countries in the region that have the highest rate of change or the best value for a similar indicator. Details of the calculation of target values are provided in the next section.
The known values of the indicator are used to calculate the trend for its rate of change (Fig. 2). The value of the indicator on the trend line in 2000 is the status of the indicator (applied value) in the base year, and its current status in 2020. The line connecting the base and target value shows the desirable rate of change, i.e. the trend of how fast the indicator must change each year to reach the target value.
Figure 2. Visual presentation of the UNESCAP methodology
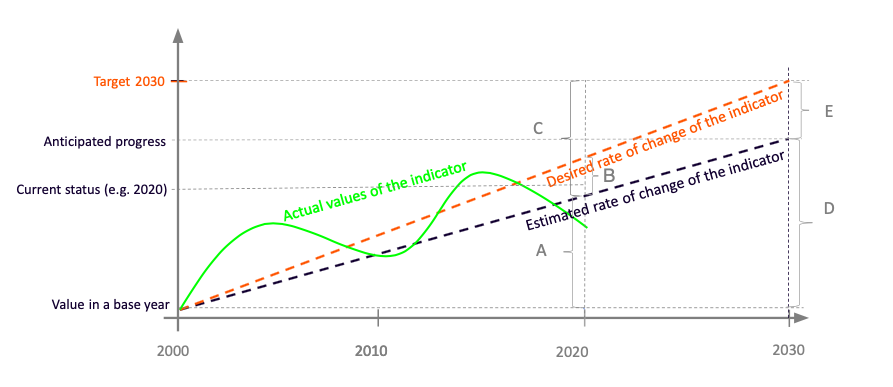
Source: Simplified visualization of the UNESCAP methodology, compiled by the authors
Data
In order to measure Ukraine’s progress towards achieving the SDGs by applying global indicators, we used data from 2000 to 2019 from the database of the statistics division of the UN Department of Economic and Social Affairs. It provides enough information for calculation for 19 of the 28 global indicators. Of these indicators, the government included 9 indicators within Ukraine’s national SDG framework.
The UN database has no data for Ukraine regarding such indicators as malaria incidence, proportion of health facilities that have a core set of relevant essential services, percentage of bloodstream infections due to selected antimicrobial-resistant organisms. The indicator of neglected tropical diseases is not relevant for Ukraine because, according to the UN, such a phenomenon is very rare in our country. In terms of hepatitis B incidence, coverage of treatment interventions for substance use disorders, proportion of women of reproductive age requiring reproductive healthcare service, mortality rate attributed to environmental and ambient air pollution, unsafe water, unsafe sanitation and lack of hygiene and health emergency preparedness, the UN database has available data for Ukraine for 1 or 2 years only. This is not enough to measure progress according to the UNESCAP methodology. The proportion of household expenditures on health is available only until 2014. Data on development assistance to medical research does not seem reliable because, in different years, the amounts differ by orders of magnitude. We do not, therefore, use them in our calculations (Table 3 in the Appendices).
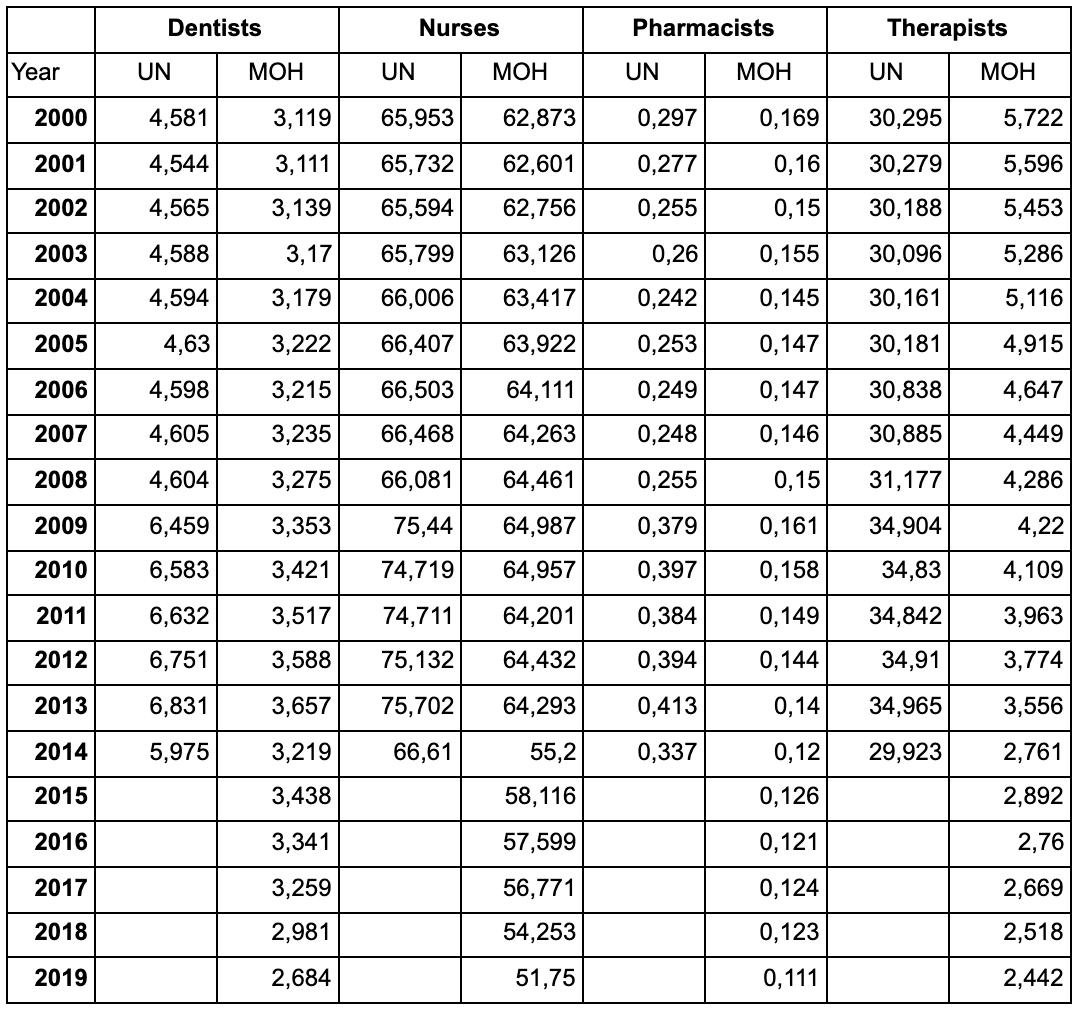
To calculate the indicator “Health worker density and distribution (dentists, female/male nurses, pharmacists, general practitioners)”, we used data from the Center of Medical Statistics of the Ministry of Health, since there was a significant discrepancy between them and the indicators from the UN database. Besides, some UN data are reported until 2014, while Ukrainian data continues to be collected (see Table 4 in the Appendix).
We set target values for global indicators based on a “champion area” approach. To set the target, we took the UN data for the region of Eastern and Central Europe, wherein lies Ukraine (Figure 4). In setting the targets, we proceeded from the premise that the indicator level, which the leading countries managed to achieve could be reached by other countries in the region.
In this methodology, there are two approaches to calculating the target value for each indicator: the average of the top five countries in the region or the average rate of progress of the five outstanding countries. The first approach is used when the rate of change may show irrelevant values. Thus, if countries started from a very low indicator level and hence grew very quickly, such growth rates become unrealistic in the future (e.g. this problem is seen with regard to the proportion of those vaccinated). If the rate of progress allows one to obtain relevant values, it is used to calculate targets. This is explained in more detail on the UNESCAP website.
Figure 3. Countries in the Eastern European region according to the UN classification, including Ukraine
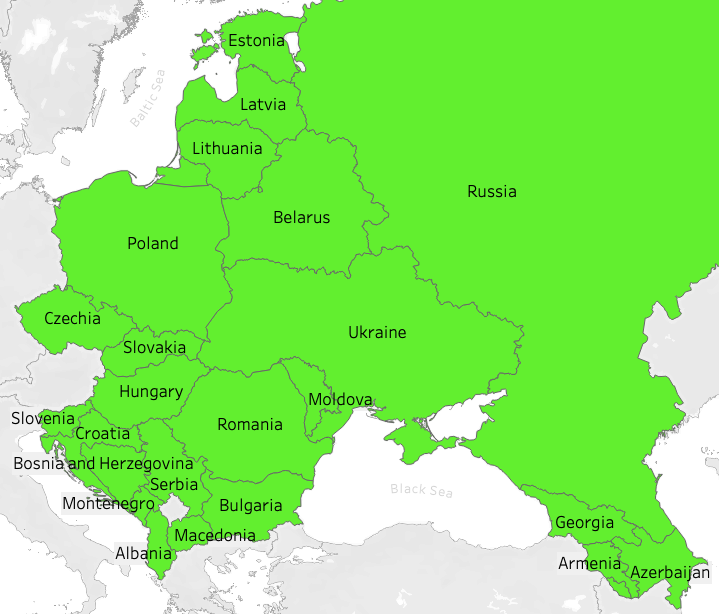
Source: Compiled by the authors based on the UN data
For each indicator, we defined
(1) the level achieved: the best value of the indicator in each country according to the available 2010-2019 data (highest or lowest, depending on specific indicators)
(2) the top 5 countries by the indicator level: the five countries that have the best level of a certain indicator according to the available 2010-2019 data
(3) the level of the top 5: the average indicator of the best values in each of the top five countries
(4) the average rate of change of the indicator in 2010-2019: the coefficient for the independent variable in linear regression, which tells you how much the indicator value depends on the year;
(5) the top 5 countries by the rate of change of the indicator: five countries with the highest rate of change of the indicator in desirable directions
(6) the rate of the top-5: the average rate of change of the indicator in the top five countries by the rate of change of the indicator
(7) the indicator value at the rate of the top 5 for Ukraine: the indicator value for Ukraine is calculated based on the assumption that the indicator will change at a rate equal to that of the top five
(8) the target value of the indicator for Ukraine: the projected value of the indicator based on the rate of the top five if this value is in the interval between the current status and the level of the top five, or the level of the top five in other cases.
To ensure the integrity of the approach in measuring Ukraine’s progress towards achieving global indicators (Table 2 in the Appendices), we calculated target values for them even in cases where the national list has a similar indicator and a target value for it.
Graph 1. Comparison of targets for comparable national and global indicators
National and target values calculated based on a champion area approach
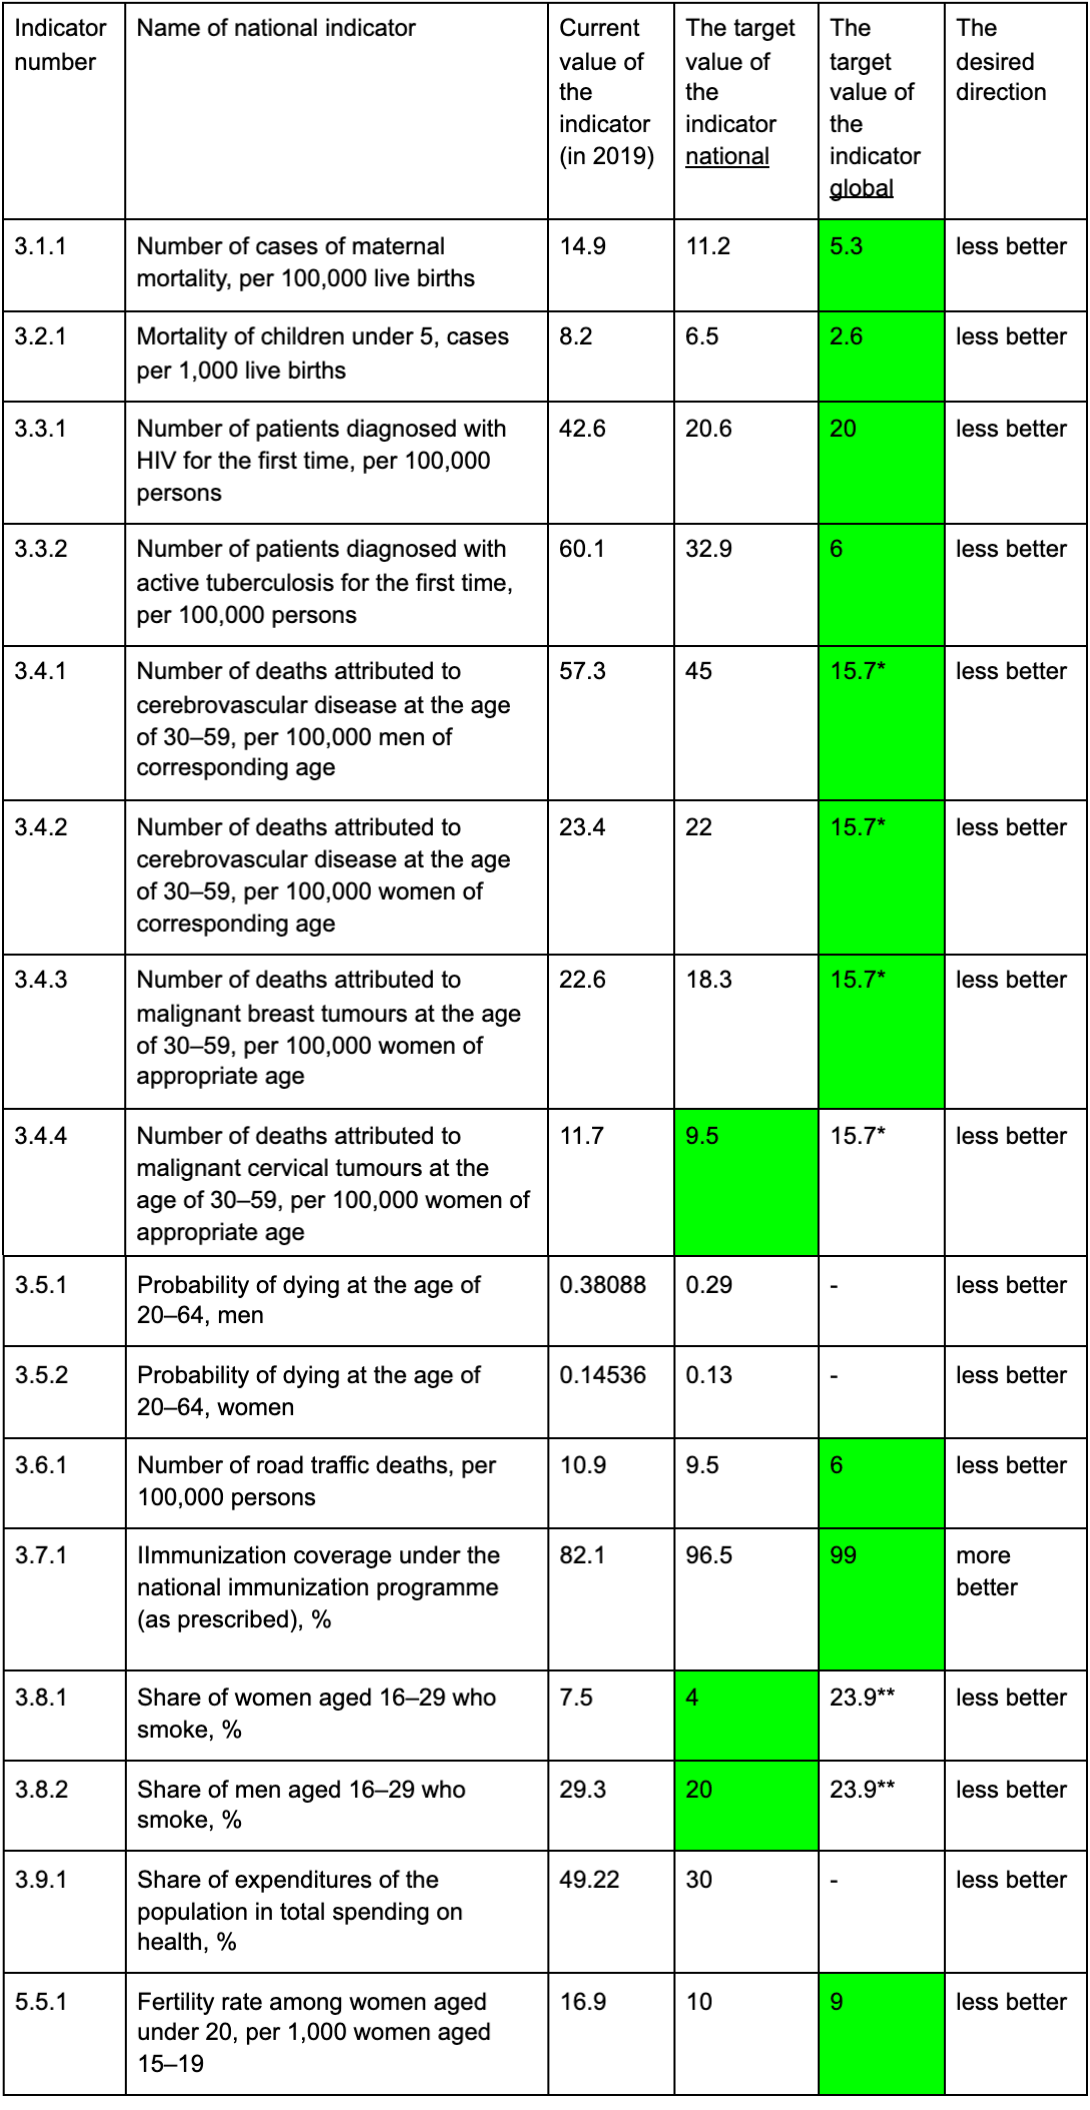
Source: Compiled by the authors based on the State Statistics Service of Ukraine and UN data
NB: see Table 1 for the full names of the indicators
* in the global system is presented as a single indicator
** in the global system is presented as a single indicator
Graph 1 shows that the targets set by Ukraine are for the most part higher than the calculated values. On the one hand, setting ambitious goals may not allow Ukraine to achieve the Good Health goal on time, but on the other hand, it could be an effective incentive and guideline in accelerating progress in certain indicators.
Results
If we compare the progress towards achieving SDG 3 “Good Health”, the global indicators (using a champion area approach to define targets) look more optimistic. However, if the current trend continues, the goal will not be achieved by 2030, both on a national or global level.
The progress calculated by applying national and global indicators shows that the rate of change in some indicators is insufficient to reach the 2030 targets. Specifically, there has been a slow improvement in the mortality rate of men aged 20-64, maternal mortality, road deaths and suicides, tuberculosis incidence, teenage pregnancy and the proportion of household expenditures in the total health expenditures.
According to some indicators, we are even moving away from the desired outcomes. This concerns the number of smokers with HIV and tuberculosis in the national indicator framework and the proportion of the target population covered by all vaccines and health worker density in the global framework.
Figure 4. Ukraine’s progress in achieving the SDG according to the national system of indicators (UNESCAP methodology)
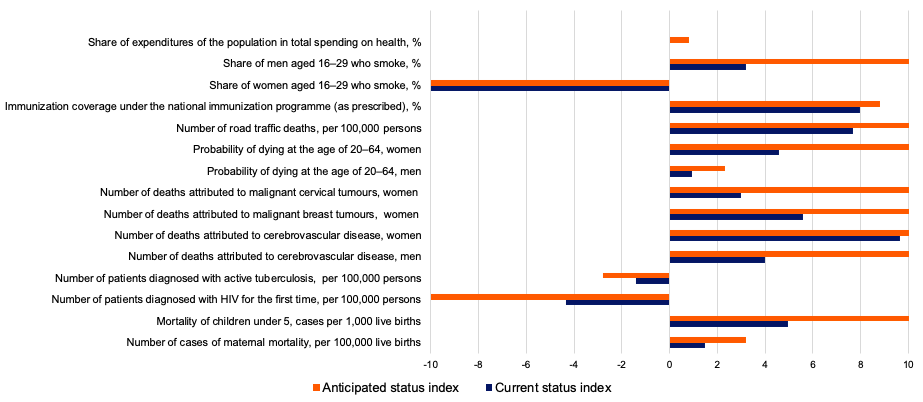
Note. The current status index shows Ukraine’s progress in achieving the Third Goal as of 2019. According to the indicator “Share of household expenditures in total health expenditures,%”, the current status index is 0, because Ukraine has not shown progress since 2015. The index of the anticipated state shows the forecast of progress as of 2030.
Here you can find interactive figures with Ukraine’s progress in achieving the Goal 3 according to the national system of indicators. Please keep in mind, that only Goal 3 filled in with correct information, other Goals appears just as an exapmle.
Figure 5. Ukraine’s progress in achieving the SDG according to the global system of indicators (UN ESCAP methodology)
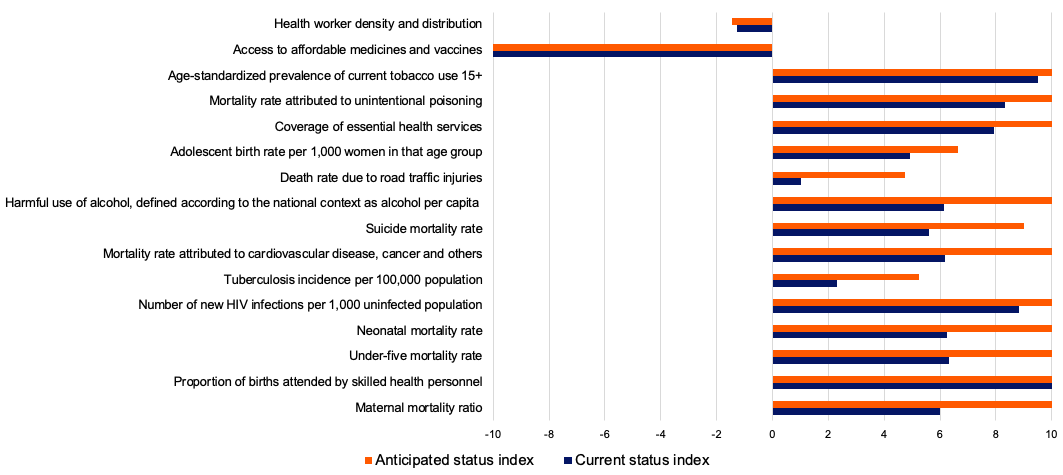
Note. The current status index shows Ukraine’s progress in achieving the Third Goal as of 2019. The index of the forecasted state shows the anticipated progress as of 2030.
Here you can find interactive figures with Ukraine’s progress in achieving the Goal 3 according to the global system of indicators. Please keep in mind, that only Goal 3 filled in with correct information, other Goals appears just as an exapmle.
Ukraine shows even better progress in terms of global indicators than in terms of national ones. The lagging behind of the national indicators may be partly due to the fact that the national indicator framework focuses on the weaknesses of the Ukrainian healthcare system getting “sore spots” in focus.
Recommendations
Clarifying the wording for some indicators is advisable.
The way some indicators are phrased may create the opposite set of incentives in the process of achieving them. For example, this concerns the national indicator “Number of patients diagnosed with HIV for the first time in their life per 1,000 population”. If the country’s problem is insufficient HIV testing, an increase in the number of tests may be considered an improvement, which will mean more newly diagnosed patients. In this case, the number of recorded HIV cases in official statistics will increase. If the testing covers all those infected, it will be desirable to reduce this rate in official statistics. At the same time, a decrease in the number of patients due to problems with HIV testing cannot be considered a positive sign. Using the global indicator “Number of new HIV infections per 1,000 uninfected population, by sex, age and key population” could eliminate this uncertainty.
There is a similar problem with the indicator “Health worker density and distribution (dentists, female and male nurses, pharmacists, general practitioners)”, which, in the UN data, denotes the number of health workers of a certain specialty per 10,000 population. It is obvious that one nurse per 10,000 population is not enough and 200 nurses is excessive, so at times, it may be necessary to increase the number of health workers and, at other times, to reduce them. The optimal number of health workers in each country should be determined taking into account the principles of operation and the funding of the healthcare system, the division of responsibilities among health workers, and the accessibility to healthcare (including due to geographical or infrastructural barriers).
We suggest that the following indicator be used for Ukraine, but we would like to draw attention to the need for a careful approach to defining targets for it.
In the national indicator “Adolescent birth rate per 1,000 women aged 15-19 years”, age should be divided into that “under the age of majority” and that “at the age of majority”, since there is a difference between bearing a child as a teenager at 15 years (and, probably, the reasons that led to pregnancy) and at 18-19 years, when a woman is an adult, able to get married and take responsibility for her decisions. The global indicator “Adolescent birth rate (aged 10-14 years; ages 15-19 years) per 1,000 women in that age group” also has this shortcoming, but it has an important additional feature, namely collecting statistics on early (even more problematic) birth rate at 10-14 years.
The indicator “Total net official development assistance to medical research and basic health sectors per capita” amounting to millions of dollars in 2018, is not clear about what kind of assistance is provided, which can result in discrepancies when developing a methodology to calculate it. Very high differences in this indicator’s values, both within one country and between countries in the region, could be indicative of its being problematic. For example, the lowest value of -0.4 was recorded in Montenegro in 2017 and the highest value of 68.8 in Ukraine in 2016 (the latter is the best value in the region followed by 36.2 in Bosnia and Herzegovina in 2016). However, this figure was 4.7 in Ukraine in 2004. Research in the field of healthcare and funding major medical fields can become a driver for achieving the Good Health goal, but in order to see the real state of affairs in this area, it is advisable to clarify the definition of this global indicator for Ukraine by specifying what type of assistance is meant (general funding of these areas from the state budget, subventions, individual grant programs, etc.).
A regular review of the indicators in Ukraine is advisable, based on international best practices.
It is important to remember that the Sustainable Development Goals only provide supplementary guidance on the path to good health and well-being. Therefore, they can be revised and amended as needed, abandoning irrelevant indicators in favor of those that will track the country’s movement in its truly high-priority areas.
Indicators of the state of healthcare in Ukraine in the national framework for the Sustainable Development Goals cover only a part of the indicators provided by the global SDGs, namely 9 out of 28 (one of them is included within the Gender Equality goal). Our analysis showed that some global indicators are not so relevant for Ukraine (e.g. 3.3.3 Malaria incidence per 1,000 population or 3.3.5 Number of people requiring interventions against neglected tropical diseases), while other ones would help keep track of the processes that are of importance to Ukrainian society (suicide mortality rate, mortality rate for newborns up to 28 days of age, universal health coverage index, etc.).
Expanding the list of indicators to include global indicators does not mean narrowing the space for reflection of the national indicators, and hence it will have only positive aspects, enabling a better analysis of the state of healthcare in Ukraine.
Conclusions
The COVID-19 pandemic has once again demonstrated the need for coordination between countries, societies and international organizations. The WHO Global Action Plan on Physical Activity and Health 2018-2030 broadly covering physical and mental health, enhanced quality of life and well-being shows that an effective promotion of a healthy lifestyle across the globe and in Ukraine in particular requires enhanced international, regional and national coordination.
An important step in creating a common understanding of the key challenges in the field of healthcare can be the introduction in Ukraine of the global SDG indicators that are relevant to us. This will allow us to “speak the same language” with other UN member states and coordinate our efforts more effectively to ensure people’s well-being and good health.
Annex
Table 1. Comparison of global and nationalized indicators
Note. * Global indicator 3.7.2 from the third goal Good Health and Well-Being corresponds to indicator 5.5.1. from the fifth goal “Gender Equality” in the Ukrainian system of SDG
Table 2. Method of calculating the target value for Ukraine according to the global system of indicators
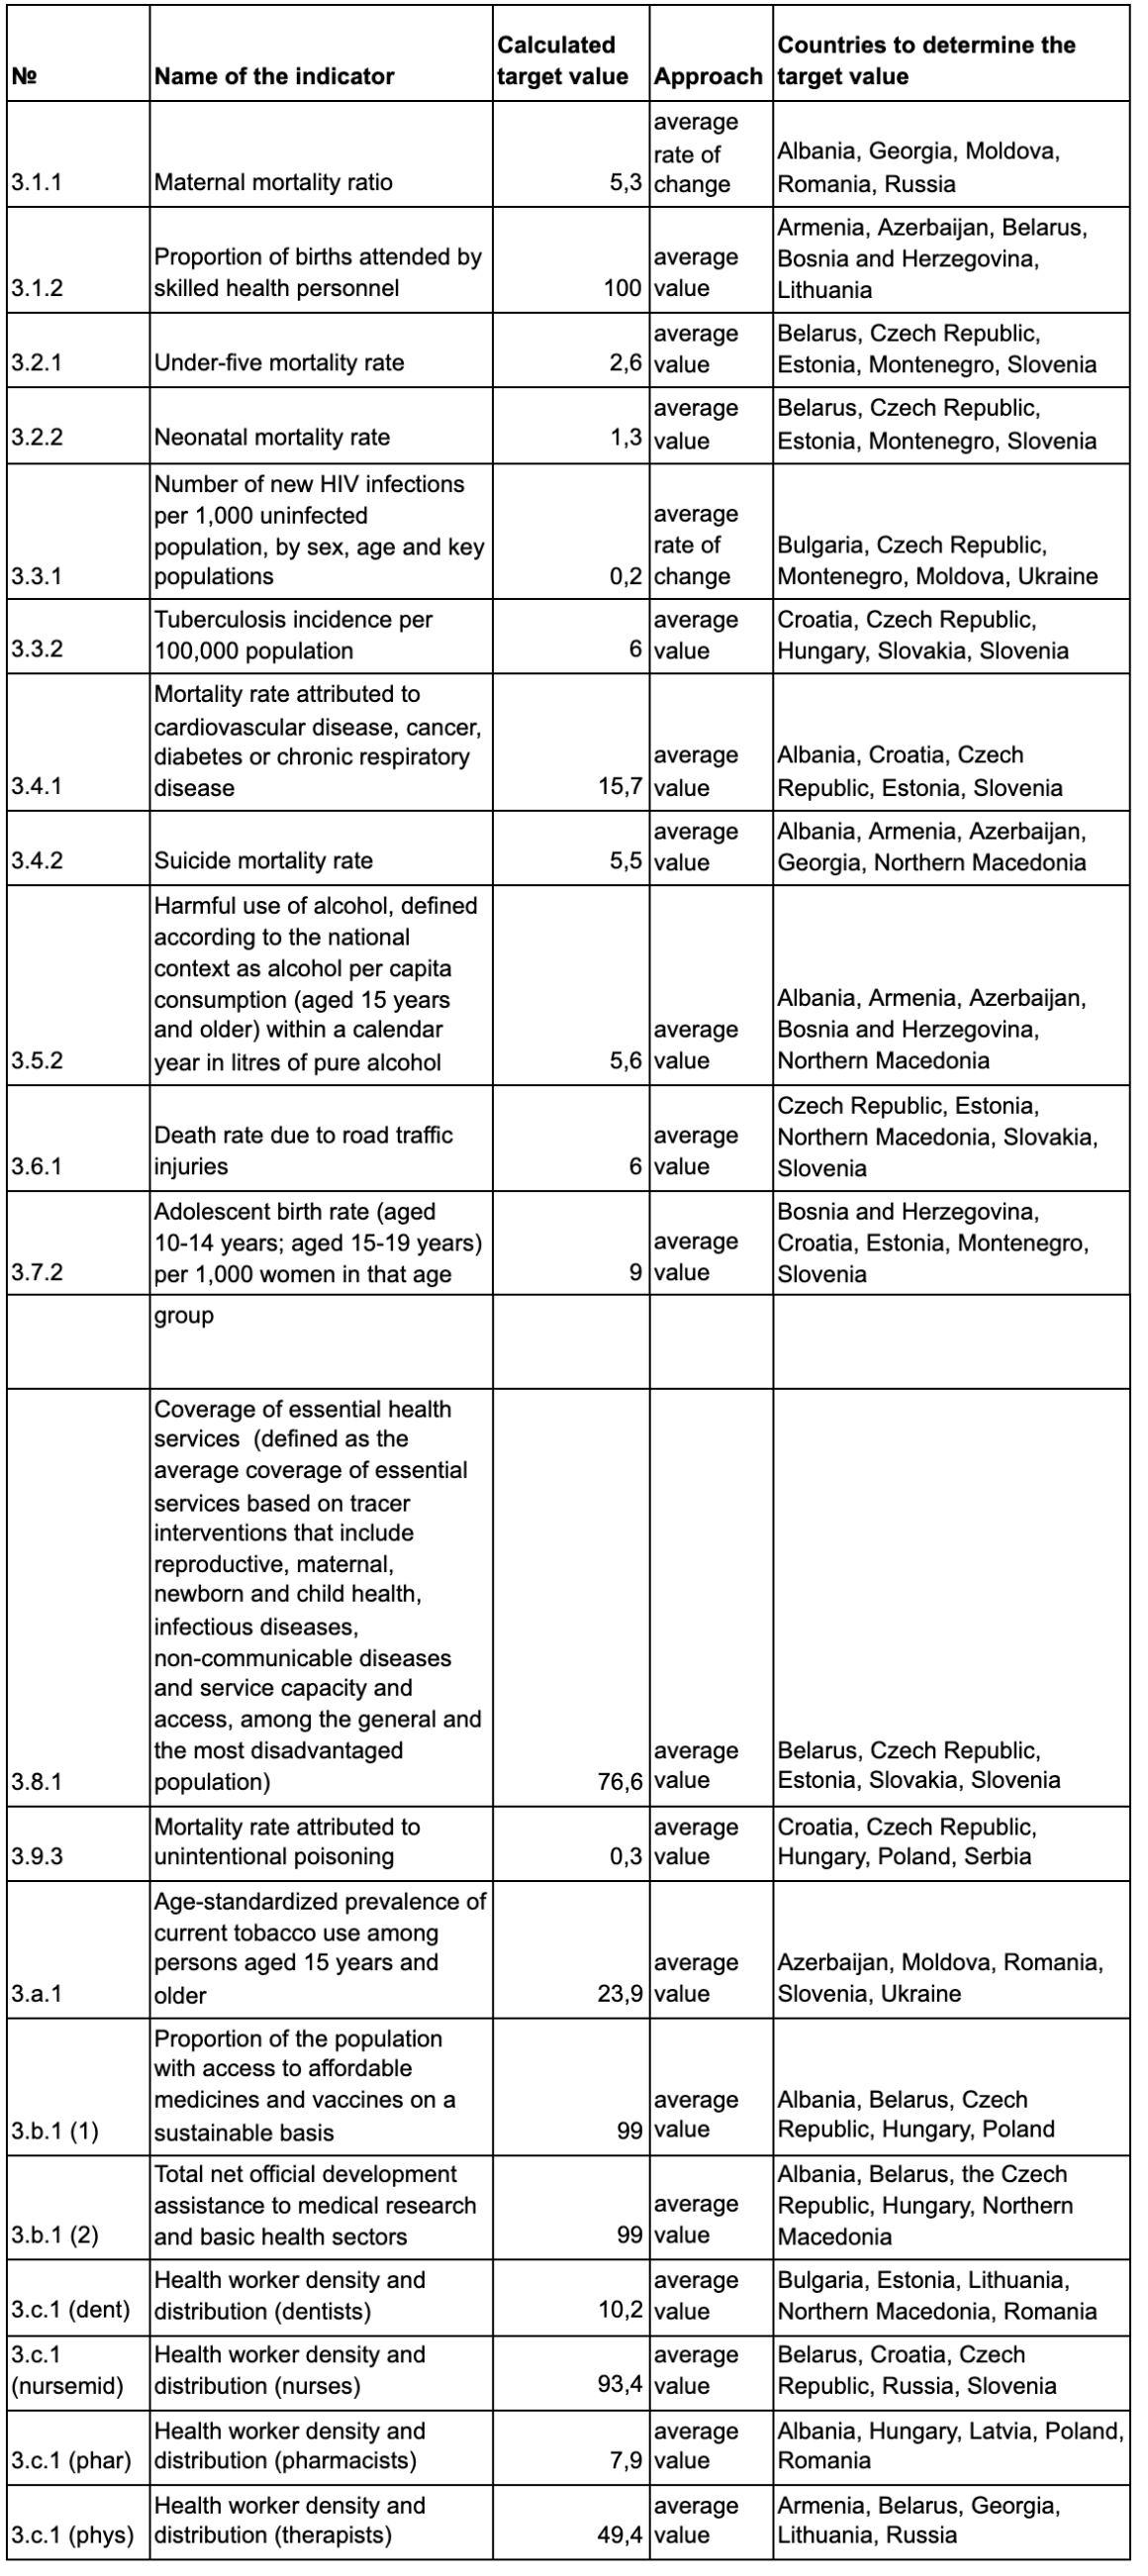
Table 3. List of indicators that were not included in the calculation
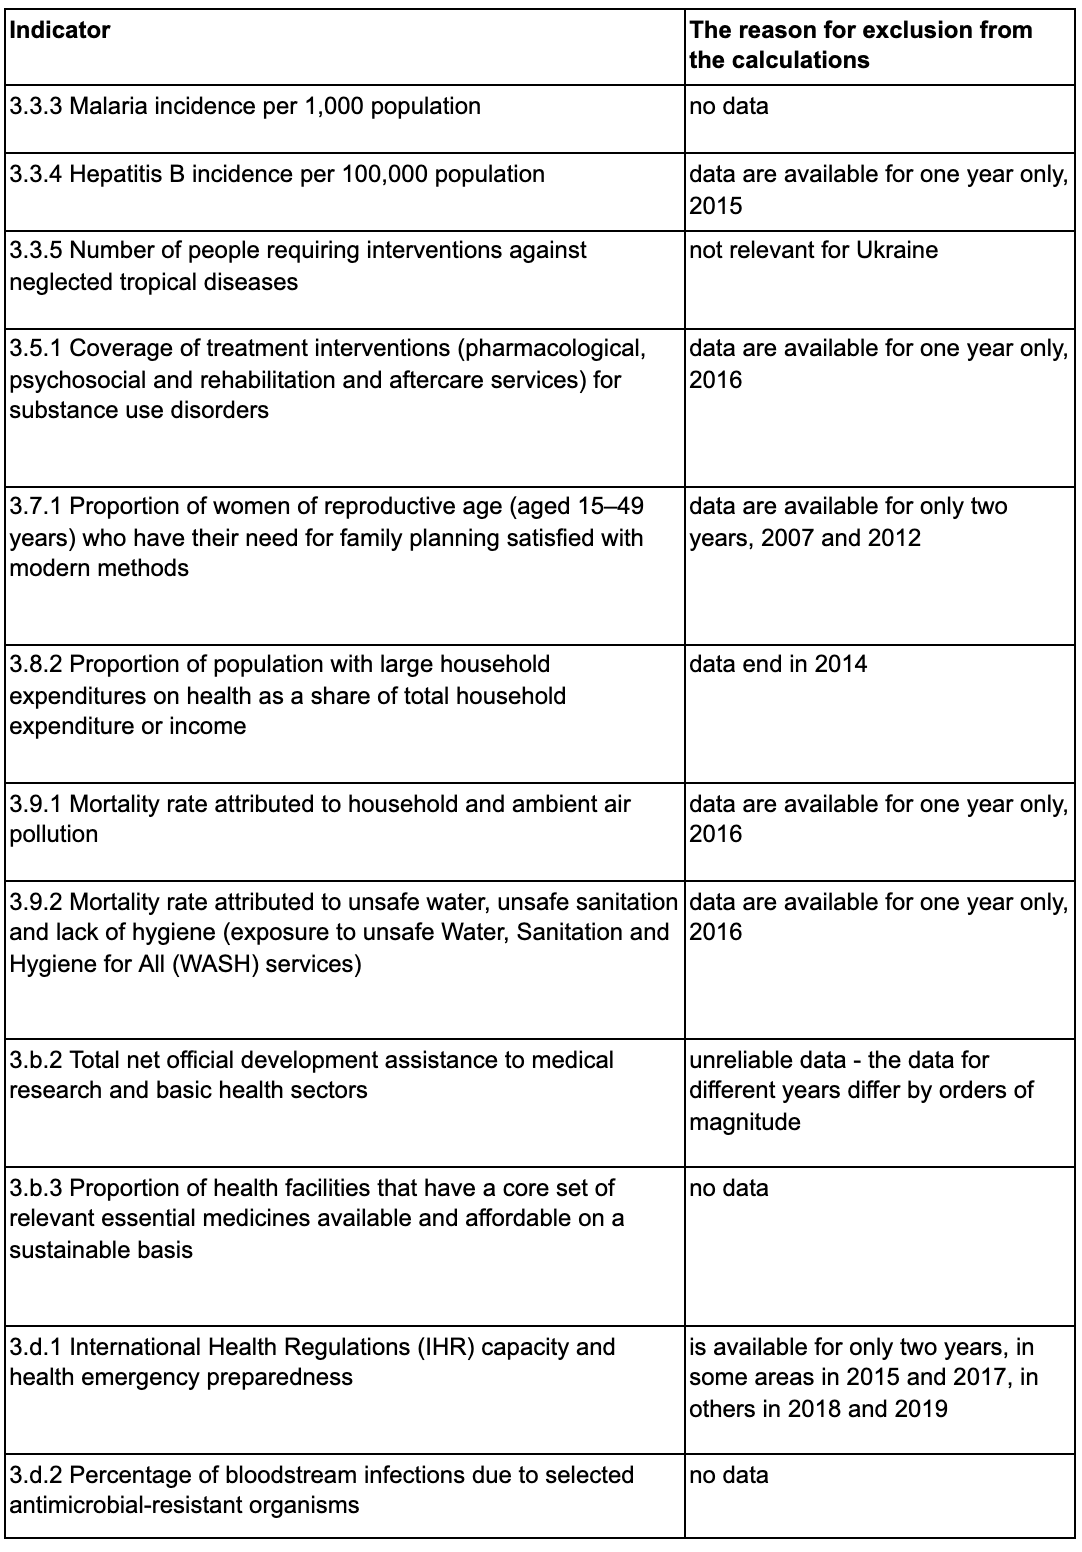
Table 4. Comparison of UN and MOH statistics on the number of health workers per 10,000 population


Attention
The authors do not work for, consult to, own shares in or receive funding from any company or organization that would benefit from this article, and have no relevant affiliations