There is weak integration of markets for grocery goods within the DNR boundaries. There is substantial cross-sectional price variation even between neighboring cities. This pattern is indicative of poor allocation of resources and weak economy. Thus our analysis corroborates other estimates reporting a major economic decline in the DNR.
There is a wide perception that the economic situation in the Donetsk People’s Republic (DNR) is dismal. The Luhansk People’s Republic (LNR), a sister republic, is in deep crisis too. Red Cross and other charities send in food and medicine to provide critical supplies.
In addition to destroyed infrastructure and no access to export markets, protection of property rights in the DNR/LNR is nearly non-existent. Extortion and requisition of private property appear common which further reduces incentives to do business in the DNR/LNR. Some estimates suggest that the DNR/LNR economy is only a 20%-50% of its pre-war level. Unfortunately, hard data on economic performance in the DNR/LNR is nearly non-existent and thus one has to rely on indirect methods to infer the state of the DNR/LNR economy. In this post, we try to use one of such indirect tools to get a sense of how the DNR’s economy is doing.
Method
One could compare prices of goods (sugar, potato, pork, etc.) in the parts of the Donetsk/Luhansk oblasts controlled by Ukraine to prices of the same goods in the DNR/LNR. If prices are higher in the DNR/LNR than in Ukraine, one may conclude that the cost of doing business in the DNR/LNR is higher. While this approach is simple and appealing, there are challenges. First, the DNR/LNR switched to using rubles and the effective UAH/RUB exchange rate in the DNR/LNR is not clear. Indeed, the DNR government’s official exchange rate is 1UAH = 2RUB, which is rather artificial. Second, in the best traditions of the Soviet Union, the DNR/LNR government tries to fight “speculators” and apparently reports the lowest prices in a given location to advertise how affordable life in DNR/LNR is. Hence, we employ a weaker check.
Specifically, we use the idea that a well-functioning economy should have integrated regional markets. That is, a price of sugar should be more or less the same in city A and city B. If there is a difference in prices, then there are arbitrage opportunities signalling a problem in the allocation of resources. In other words, somebody could have made profit by shipping goods from one location to another but if this did not happen it means there is a “barrier” (lack of infrastructure, tariffs, bribes, etc.) to doing this. Therefore, a large cross-city dispersion of prices is a symptom of a poor economic environment (lots of “barriers”). Using “official” data from the DNR’s statistical office, we can calculate such dispersion (standard deviation) of prices across cities for a set of relatively standard goods. To get a sense of how a “normal” dispersion should look like we use the standard deviation of prices across oblasts in “mainland” Ukraine as a benchmark. These latter data are provided by Ukraine’s State Statistics Service. If regional price dispersion is greater in the DNR/LNR than in “mainland” Ukraine, this pattern is consistent with significant disruptions and “barriers” in the DNR/LNR economy.
Data description
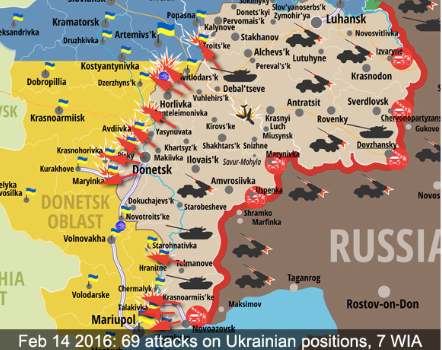
Every week we collected prices in 17 cities that are currently under control of the self-declared DNR. The list of cities includes Amvrossiivka, Debaltseve, Dokuchaevsk, Donetsk, Horlivka, Khartsyzk, Kirovske, Makiivka, Novoazovsk, Shakhtarsk, Snizhne, Starobesheve, Telmanove, Torez, Yasynuvata, Yenakijeve, and Zhdanivka. Some of the locations (e.g. Torez or Amvrosiivka) border Russia, while there are also regions (e.g. Donetsk or Yasynuvata) with active fighting.
Source: lugansk-news.com
Our weekly data span from 10.09.2015 to 23.03.2016. We started data collection immediately after the DNR’s switch from Ukrainian Hryvnia to Russian Ruble. In the end, we observe food prices for 19 weeks. The sample has 3,894 price observations covering 18 grocery products. The list of goods consists of meat (beef, pork, lard), milk and eggs (milk, butter, sour cream, cottage cheese, eggs), vegetables (beetroot, carrot, onion, potato, cabbage), cooking ingredients (sugar, oil, rice, flour), and bread (rye bread).
Results
Figure 1 shows a snapshot of data for prices of fatback (“salo”) for selected cities in the DNR. We observe a large number of sharp increases and decreases. For example, the price of fatback (сало) in Dokuchaevsk was the lowest across cities in the beginning of the sample period, then it nearly doubled in the end of 2015, and then fell to the lowest point again in early 2016. Given that demand for fatback and other non-durables is stable over time, this pattern is consistent with large supply shocks that could not be smoothed out by redirecting some portion of the good from other cities.
Figure 1. Prices for fatbackin Russian Rubles for selected cities
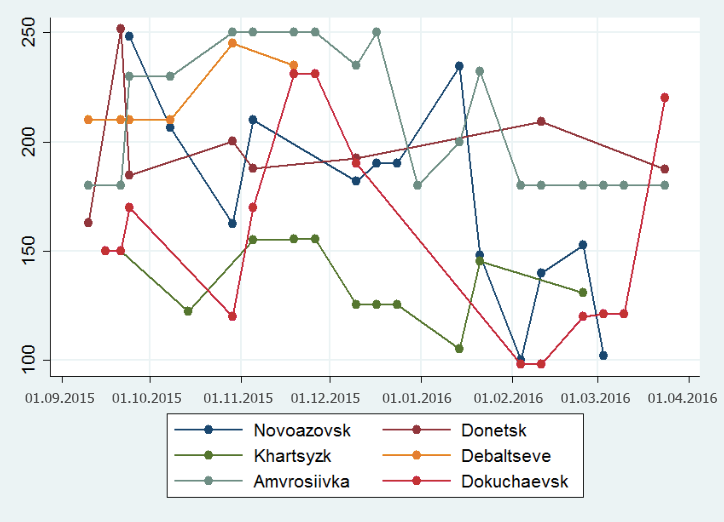
Table 1 reports the number of weeks-goods when prices in a region are at the maximum or minimum levels. We can observe interesting variation in prices. For example, prices for grocery goods are highest in Telmanove, a city close to the Russian border and mainland Ukraine and with a history of military tensions. The largest number of cheapest price quotes is observed in Dokuchaevsk, a city close to “mainland” Ukraine and with relatively infrequent incidence of fighting.
To complement this analysis, we run a regression with the natural logarithm of price in Russian rubles as the dependent variable and full sets of time, good and region dummies as explanatory variables. The last column of Table 1 reports estimates for coefficients on region dummy variables. We keep Donetsk as the benchmark so that all region dummy coefficients show differences relative to Donetsk. For instance, prices in Dokuchaevsk are on average 6.5% cheaper than prices in Donetsk, while prices in Telmanove are 4.5% higher compared to the benchmark.
Table 1. Minimum and maximum prices
| All | Meat | Vegetables | Dummy | ||||
| Region | min | max | min | max | min | max | coef |
| Amvrosiivka | 8 | 8 | 3 | 7 | 1 | 1 | 0.005 |
| Debaltseve | 8 | 10 | 3 | 4 | 5 | 3 | -0.023* |
| Dokuchaevsk | 12 | 5 | 7 | 4 | 0 | 0 | -0.065*** |
| Donetsk | 1 | 1 | 0 | 0 | 0 | 1 | base |
| Horlivka | 5 | 2 | 5 | 0 | 0 | 0 | -0.036*** |
| Khartsyzk | 1 | 2 | 0 | 0 | 1 | 0 | 0.012 |
| Kirovske | 6 | 13 | 1 | 9 | 3 | 0 | 0.032** |
| Makiivka | 6 | 3 | 1 | 0 | 2 | 0 | -0.032** |
| Novoazovsk | 10 | 11 | 5 | 6 | 2 | 2 | -0.017 |
| Shakhtarsk | 5 | 0 | 4 | 0 | 0 | 0 | -0.048*** |
| Snizhne | 4 | 5 | 2 | 1 | 1 | 1 | -0.007 |
| Starobesheve | 4 | 22 | 3 | 17 | 0 | 0 | 0.012 |
| Telmanove | 7 | 40 | 1 | 4 | 1 | 25 | 0.045*** |
| Torez | 4 | 3 | 2 | 3 | 0 | 0 | -0.070*** |
| Yasinuvata | 6 | 2 | 3 | 2 | 3 | 0 | -0.034** |
| Yenakijeve | 7 | 3 | 2 | 3 | 2 | 0 | -0.029** |
| Zhdanivka | 3 | 2 | 1 | 0 | 0 | 2 | -0.011 |
Note: ***, **, * denote statistical significance at 1, 5 and 10 percent levels. If two regions report highest or lowest prices, both regions are counted.
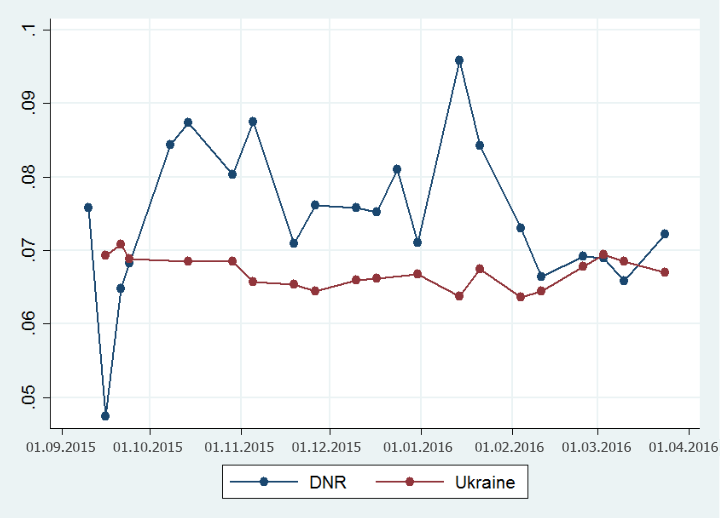
Next, for each good we calculate the standard deviation of log prices across cities in the DNR and across oblasts in “mainland” Ukraine. Then we take the median standard deviation across goods (the composition of goods is the same in Ukraine and in the DNR). Figure 2 shows time series for the median cross-sectional standard deviation for the occupied region (DNR) and for 25 regions of Ukraine. Two patterns are clear. First, dispersion of prices within the DNR controlled area is higher than that for “mainland” Ukraine. Second, cross-city price dispersion is very volatile in the DNR and smooth in “mainland” Ukraine. Such behavior of price differentials is consistent with poor allocation of resources in the DNR due to gaps in supply chains, price regulation, limits to mobility of goods across cities, poor infrastructure for storage and transportation, military fighting, etc.
Figure 2. Cross-sectional standard deviation of log(price)
Concluding remarks
Our simple empirical exercise suggests that there is weak integration of markets for grocery goods within the DNR boundaries. There is substantial cross-sectional price variation even between neighboring cities. This pattern is indicative of poor allocation of resources and weak economy. Thus our analysis corroborates other estimates reporting a major economic decline in the DNR.


Attention
The authors do not work for, consult to, own shares in or receive funding from any company or organization that would benefit from this article, and have no relevant affiliations