Russia’s full-scale invasion of Ukraine in 2022 led not only to the strengthening of Ukraine’s military, but also of Ukrainian identity. In new research using data from a large U.S. survey, Oleh Wolowyna and I find increases in the use of Ukrainian language among immigrants from 2021 to 2022. By 2023, for the first time, Ukrainian surpassed Russian as the most commonly spoken language among Ukrainian immigrants living in the U.S. In addition, among the U.S. born, there was a dramatic increase in the number of Americans claiming Ukrainian ethnicity (what the survey also terms “ancestry”).
We find increases in reported Ukrainian ethnicity are largest among respondents with at least a college degree, and who live in areas where Donald Trump received less support in the 2016 presidential election.
Our study also examined language use and ethnic identification among Russians. Contrary to Ukrainians, where these identity measures sharply increased, we observed a continued decline in both Russian language use among Russian immigrants, and Russian ethnic identification among U.S.-born Americans. Vladimir Putin hoped his invasion would further the narrative that Russians and Ukrainians are “one people” and, by restoring Russia as a colonial power, bring pride to ethnic Russians, however, our study reveals his invasion accomplished exactly the opposite.
Figure 1 shows the percent of immigrants from Ukraine speaking three languages, by year. The percent speaking Ukrainian rises from 35.6% in 2021 to 46.8% in 2023. The sample includes immigrants who arrived in any year, and is limited to individuals 18 or older.
Figure 1: Percent of immigrants from Ukraine speaking three languages, by year
Source: American Community Survey (ACS), 2012-2023, and authors’ calculations. Note: We exclude year 2020 data from our study due sampling irregularities during the pandemic
Figure 2: Number of U.S.-born Americans identifying as ethnic Ukrainian, by year
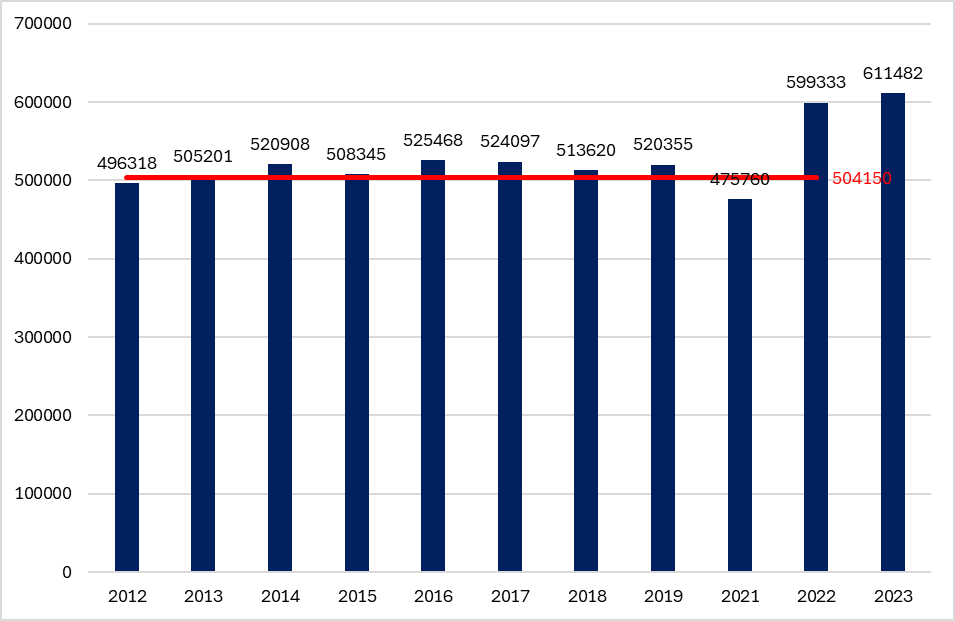
Source: ACS 2012-2022. Trendline prediction for 2022 is based on 2012-2021 data
Figure 2 shows the number (or count) of U.S.-born ethnic Ukrainians by year. In the American Community Survey, there is a question about the respondent’s “ancestry or ethnic origin.” A respondent may list multiple ethnicities, but only the first two listed are recorded. Figure 2 shows the number listing Ukrainian as their single or first or second ethnicity, and also a trendline covering the 2012-2021 period. We see the number of Americans listing Ukrainian as an ethnicity was mostly flat until 2022, when it jumped to 599,333. Without the full-scale war, the trend line predicts it would have been 504,150 in 2022. (These counts are weighted so they reflect the actual size of the Ukrainian-American population; for reference, the actual number surveyed was 5,982 in 2019). Thus we conclude the war caused an 18.9% increase in the number of U.S.-born Americans identifying as ethnic Ukrainians.
There are a few possible mechanisms behind the descriptive statistics shown in Figure 2. One is that the brave resistance of Ukrainians caused Americans with at least some Ukrainian ancestry to feel a surge of pride in it, and this led them to list it as their ethnicity in increasing numbers. Another is that seeing suffering in Ukraine reminded these Americans of the experiences of their immigrant ancestors.
We also found that individuals in counties that voted for Donald Trump at a lower rate in the 2016 presidential election were more likely to adopt Ukrainian ethnic identity in 2022. While this was a statistically significant finding, we are unable to determine which mechanisms caused it. It could be that the individuals surveyed in Republican areas are themselves more isolationist, or it could be that Democratic areas have a more pro-Ukraine social environment, which leads individuals who live in them to feel more pride when identifying as Ukrainian.
Interpreting Figure 1 is complicated by the fact that the population of Ukrainian immigrants in the U.S. changed from 2021 to 2023 with the arrival of war refugees. One of the reasons Ukrainian became the most commonly spoken language among Ukrainian immigrants is because the recent arrivals were more likely to speak Ukrainian than previous cohorts. To examine whether the changing percent speaking Ukrainian is due only to a changing population, or if there was also a change in language use, we limited the sample to those arriving before 2022, and also employed a statistical technique called multiple regression to control for year of entry. Both approaches led to the same conclusion — the full-scale invasion caused Ukrainian immigrants to switch from Russian to Ukrainian or to English.
Turning to Russians, Figure 3 shows the percent of immigrants from Russia speaking two languages, by year. The percentage of Russian immigrants speaking Russian falls almost every year. It fell by 3.7 percentage points from 2021 to 2022, but the largest fall, by 3.8 points, was from 2014 to 2015.
Figure 3: Percent of immigrants from Russia speaking two languages, by year
Source: American Community Survey (ACS), 2012-2023, and authors’ calculations. Note: We exclude year 2020 data from our study due sampling irregularities during the pandemic
Interpreting Figure 3 is again complicated by the fact that there was a large spike of immigrants from Russia in 2022. Unlike with our study of Ukrainian language among Ukrainian immigrants, we cannot rule out that the decline in Russian language use from 2021 to 2022 was due to pre-existing trends. These pre-existing trends themselves may be related to Russian aggression against Ukraine (Russia invaded Crimea and Donbas in 2014) but our methods are not able to test for this. But clearly, there is no surge of interest in speaking Russian, as could happen if Russian immigrants felt pride in their home country.
Finally, Figure 4 shows the number of U.S.-born Americans identifying as ethnic Russian, by year. This figure also shows a trendline prediction for 2022 based on 2012-2021 data. The 2022 counts are 6.8% below the trendline prediction, which is what we would expect them to be absence of the full-scale invasion. This 6.8% decline from 2021 to 2022 is not as large as the increase we found for U.S.-born Americans identifying as ethnic Ukrainians, but it is statistically significant, and consistent with ethnic Russians feeling shame for the actions of the Russian military.
Figure 4: Number of U.S.-born Americans identifying as ethnic Russian, by year
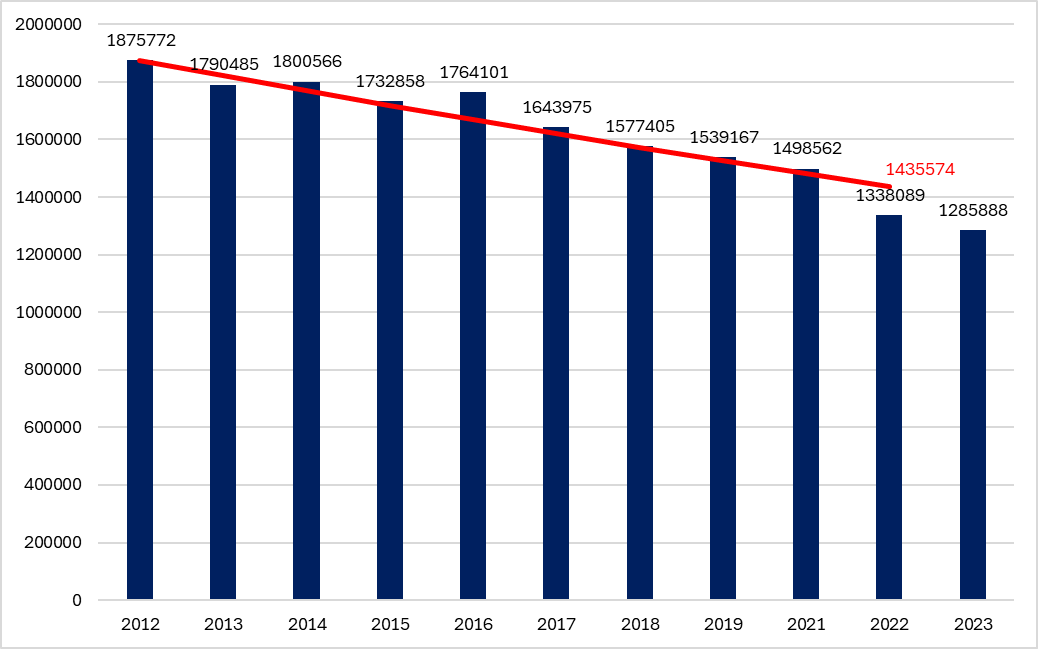
Source: ACS 2012-2022. Trendline prediction for 2022 is based on 2012-2021 data
Beyond the main results concerning ethnic identity and language use we have presented here, our full study also documented important facts about several other issues. We provide alternate estimates of the number of refugees fleeing invasion in Ukraine or persecution in Russia—immigration from both Russia and Ukraine spiked in 2022, but there are varying reports in the news media concerning the magnitudes. We also examined whether Russian and Ukrainian immigrants faced labor market discrimination, but we do not find Russian immigrants suffered economically relative to a comparison group of immigrants, nor did Ukrainian immigrants gain. Thus, we conclude the changes in language and ethnic identity we have documented are not driven by economic considerations.
The full article is forthcoming in the Journal of Economics, Race and Policy
Attention
The author doesn`t work for, consult to, own shares in or receive funding from any company or organization that would benefit from this article, and have no relevant affiliations