High-level corruption probably is more harmful than petty corruption because it is more costly in both monetary and political terms. At the same time, petty corruption can ‘normalize’ dishonesty, and make society more tolerant to corruption at all levels. This creates a bad equilibrium where citizens are more likely to be involved in corrupt practices because ‘no one is clean’. Where can young citizens be exposed to corruption and lack of integrity? Most obviously, at schools when they learn that there are other ways of getting a good grade than learning the material and doing homeworks. This habit of “bending the rules” (because ‘everybody else is doing this’) may be transferred to adult life. In this article, we look at the teenagers (15-18 years old), to see whether they are exposed to corruption and/or lack of integrity and how their experience at school impacts their perception of corruption and their involvement in dishonest practices.
Introduction & the main conclusions
Ukraine has been constantly perceived as a very corrupt country. Although its Transparency International corruption perception score improved somewhat since 2013, corruption is still one of the major concerns of foreign investors and donors, especially in light of the huge amounts needed for reconstruction of Ukraine. However, if we try to be more specific and, for example, quantify corruption, we run into a number of challenges that do not have simple solutions. First, how do we measure corruption? (see Annex 2 for a brief overview of the literature.) For example, measuring bribe incidence rather than perception of corruption is tricky because often people do not want to confess to their involvement in corruption (other instances, such as nepotism, are even harder to identify). Second, even if we get people’s answers from a representative survey, most likely we would be measuring petty corruption rather than grand corruption. How do we measure high-level corruption? It becomes visible only when it is investigated – either by law enforcement agencies or by the media – and is reported in the public domain. At the same time, publications about high-level corruption may have a higher impact on people’s perception of corruption than paying a small “gratitude” to a doctor.
In this work, we overview corruption surveys available for Ukraine and then estimate how the views of teenagers on corruption are related to their involvement in dishonest behaviour (cheating) at schools. The main results of our investigation are as follows:
- according to surveys, corruption is perceived as one of the most important problems of Ukrainian society. However, the perception of corruption is much higher than its incidence (presumably because the primary source of information about corruption is the media);
- tolerance to corruption has been quite high, and higher among younger people. In 2022, tolerance to corruption has sharply declined, and more people expressed willingness to actively counteract corruption;
- views of teenagers on corruption align with the views of general population expressed in surveys – teenagers believe that in Ukraine the level of corruption is rather high and that corruption is mainly associated with central level authorities;
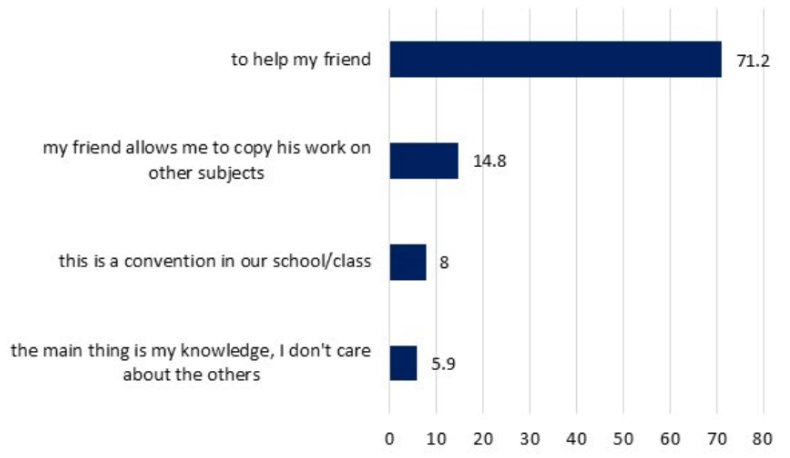
- cheating (copying other people’s work) is very common in Ukrainian schools. The primary reason is “getting a better grade”, whereas allowing other people to copy one’s work has primarily an altruistic motive “to help my friend”;
- expectedly, students who report that cheating is common in their school (class) are more likely to cheat themselves. Interestingly, those who can name more specialized anti-corruption agencies (and thus perhaps are more aware about integrity and corruption) are less likely to cheat (at least according to their answers).
Policy recommendations
Recommendations to the government and NGOs:
- prefer detailed surveys on corruption that allow development of specific policy solutions to general surveys that would once more reinstate corruption as a problem;
- explain to citizens which situations are considered corruption by the law and what to do when faced with these situations (e.g. to whom to report [potential] corruption);
- support the independence and operations of anti-corruption infrastructure, so that it does not need to seek protection via publicity.
Recommendations for educational institutions:
- to exit the “bad equilibrium” of “cheating as usual”, first of all the attitude of teachers/professors to cheating should change;
- explanation to students what integrity is, why it is important and how it would improve the quality of education should be provided;
- letting senior students to choose subjects would decrease their workload and allow them to concentrate on the subjects which they want to (rather than have to) study;
- switching from forms of control more vulnerable to cheating (e.g. memorizing and reproducing information) to less vulnerable (e.g. producing and discussing own original ideas) can both reduce cheating and improve learning outcomes.
Corruption perception in Ukraine
Ukraine is perceived as a very corrupt country (as represented by its low ranking according to the Corruption Perception Index). Indeed, the surveys show that Ukrainians are very much concerned with corruption. Can this be a self-fulfilled prophecy? We collected about 80 surveys (1998-2022) that included questions on corruption (this list is not exhaustive, however, we believe that it allows drawing certain conclusions). We summarize the most common questions of these surveys in Table 1.
Table 1. Questions included into surveys on corruption or governance
| Question | share* |
| importance of corruption (name the most important problems of Ukraine or evaluate importance of problems from the list) | 65% |
| incidence of corruption (were you or your relatives involved in corruption in the last 12 months?) | 40% |
| corruption perception (is corruption in Ukraine or certain spheres high or widespread?) | 38% |
| incidence of corruption by sphere, agency or process | 33% |
| measures against corruption (what should be done to decrease corruption?) | 29% |
| reaction to corruption (what would you do/ what did you do if asked for a bribe?) | 27% |
| tolerance to corruption (corruption can/ cannot be justified) | 27% |
| effectiveness of AC measures (are the following measures effective?) | 23% |
| reasons for corruption (why do officials/citizens get involved in it?) | 21% |
| perception of corruption by sphere or agency | 19% |
| “inevitable” corruption (is corruption a part of Ukrainian mentality?) | 13% |
| sources of information on corruption | 12% |
| definition of corruption (what is corruption, are certain situations cases of corruption?) | 9% |
Note: “share” means the share of surveys in our sample in which a certain question was asked. Questions on “who is responsible for fighting corruption” are quite common too, but there the majority of answers are usually about the president and his office, perhaps reflecting the centralized nature of Ukrainian politics.
Below we provide some stylized facts derived from the analysis of these surveys.
First, the general questions on corruption, such as “is corruption an important problem for Ukraine?” are asked much more often than specific questions, e.g. asking respondents to define whether a certain situation is an incidence of corruption or not (while generally respondents correctly identify “corruption” situations, the share of respondents wrongly defining situations as incidences of corruption is quite high too).
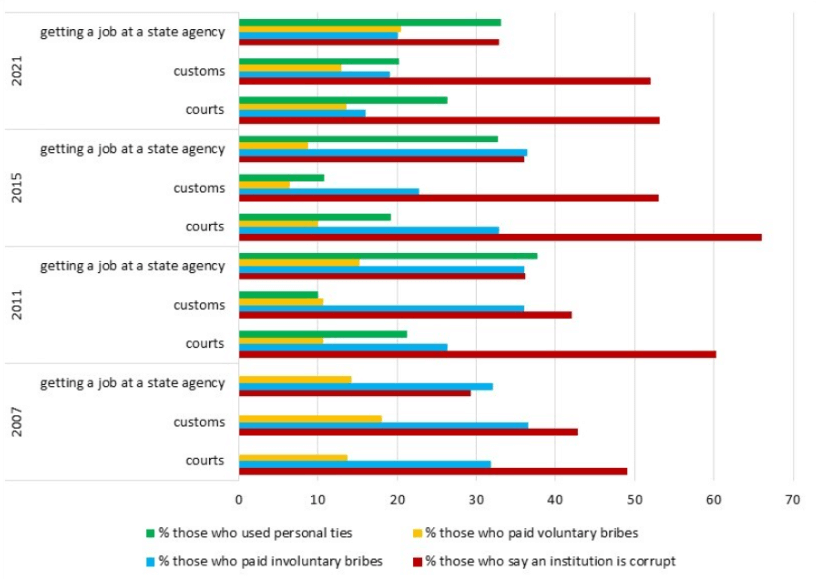
Second, incidence of corruption is much lower than corruption perception. While 70-80% of respondents or even more evaluate corruption in Ukraine as high or rather high, and corruption consistently is named 1st-3rd largest problem for Ukraine (and 5th-7th for an individual), incidence of corruption is between 10% and 40% (this depends on the question – lower percentages refer to questions “Have you paid bribes in the last 12 months?”, higher percentages are derived from questions “Were you or your family members involved in corruption in the last 12 months?”). Figure 1 illustrates this point – it shows perception and incidence of corruption for three processes/ institutions out of two dozen for which the question was asked. Note that the share of people who paid bribes voluntarily is quite high (although much lower than the share of those who were forced to pay bribes).
Figure 1. Incidence and perception of corruption for courts, customs and getting a government job
Source: USAID/KIIS surveys on corruption. Note: corruption perception is reported by all the respondents, incidence of corruption – by those who interacted with respective institutions in the last 12 months. Description of survey results for 2007-2015 is here, raw data for 2007-2021 is here, the table with perception and incidence of corruption by institution based on these surveys can be downloaded here.
Only a few surveys during 2007-2009 asked about not only the incidence of bribes but also of their size. Average reported bribe size in these surveys is about UAH 1000 (~$200), which is about three quarters of average salary at that time (in early 2009 average bribe size declined to $120 due to economic crisis and devaluation). Given a rather low incidence of corruption in those surveys (about 11-13%) we may suggest that respondents mostly did not consider small “gratitudes” to doctors as corruption.
Third, both incidence and perception of corruption varies much across government agencies. Healthcare and education are constantly perceived as rather corrupt, whereas the “golden medal” for corruption migrated from traffic police in early 2000s to judges in the last few years (we may suggest that the reasons are not only the police reform but also a lot of media discussions of corrupt judges and the need for judicial reform). Business usually reports higher incidence of corruption than the general population. Recent surveys show that business considers obtaining licenses for extraction of natural resources and privatization the most corrupt spheres.
Fourth, tolerance to corruption has always been quite high – only about 40% of people said that corruption could never be justified. Moreover, younger people have been more tolerant of corruption. A substantial share of respondents agreed that corruption was a part of Ukrainian mentality or something “usual” (this may explain the high level of voluntary bribes shown in Figure 1).
Fifth, when asked about what they would do if faced with corruption, only a minority of people were ready to report corruption, to complain about a corrupt official or take other active measures. The majority would either walk away or pay the bribe if asked.
The situation drastically changed in 2022 with the start of the full-scale war: tolerance to corruption has decreased by over 20 p.p. while readiness to take actions against corrupt officials increased by even more. Hopefully, these intentions will convert into actions. At the same time, recently we have seen quite a few corruption scandals suggesting that for some officials even the war has not become a game-changer.
Sixth, of the corruption reduction methods, punishment (e.g. firing and jailing corrupt officials) has always been much more popular than prevention (e.g. changing procedures, deregulation). In the early 2000s the most popular “anti-corruption” measure was elimination of MPs immunity – probably because it was widely discussed at the time. At the same time people have been rather skeptical about the effectiveness or sincerity of government efforts to fight corruption, and trust to the newly created anti-corruption institutions has been quite low (although higher than to the judiciary, for example). However, in the last 2-3 years Ukrainians started to assign more responsibility for fighting corruption to anti-corruption agencies and citizens.
Two obvious policy conclusions can be derived from this overview of corruption surveys. First, general corruption perception surveys are much more common and much less useful than detailed surveys about corruption in certain institutions or during certain processes (including the reasons for corruption). Surveys of the second type can provide valuable information for policy development and thus should be preferred. Second, informing citizens on what they should do when faced with corruption (or when learning about the facts of corruption) should be intensified.
This overview of surveys, our survey performed in October 2022, and the newest survey which we discuss below suggest that Ukrainians mostly associate corruption with high-level officials (central government). At the same time, surveys of the general population show quite a high level of petty corruption, at least until 2022. Although high-level corruption probably brings more harm to the state, for example, by lowering the quality of governance or creating monopolies, petty corruption creates the atmosphere of tolerance to corruption and thus supports the vicious circle of corruption, whereas a person may decide to become involved in corruption because it is a “social convention”. In this way high-level and petty corruption “normalize” each other.
The “normalization” of corruption starts at schools and universities. If corruption or dishonest behaviour is tolerated in educational institutions, students may continue these practices in their adult lives (higher tolerance to corruption by youth consistently shown by surveys is rather worrying). Therefore, we decided to survey teenagers (15-18 years) and see how they understand corruption and how often they are involved in corrupt practices. The presentation with the main survey results can be downloaded here, and the descriptive statistics for the survey is in the Annex 3.
What do Ukrainian teenagers think about corruption?
53% of respondents think that bribery is an integral part of Ukrainian society, and 77% believe that the Ukrainian government is “traditionally” corrupt. 29% think that corruption is very common in Ukraine, 58% – rather common (those who believe that corruption is very common are also more likely to think that corruption is a part of Ukrainian mentality or is imminent to the Ukrainian government). Tolerance to petty corruption (the acceptance of “small gifts” to teachers and doctors) is quite high — in line with the general tolerance to petty corruption usually displayed by surveys discussed above. The optimistic finding is that the overwhelming majority of respondents believe that both bribe-takers and bribe-givers should be responsible and that violation of laws by high-level officials does not justify violation of laws by citizens (figure 2).
Figure 2. Answers to the question: do you agree with the following statements?
Source: own survey
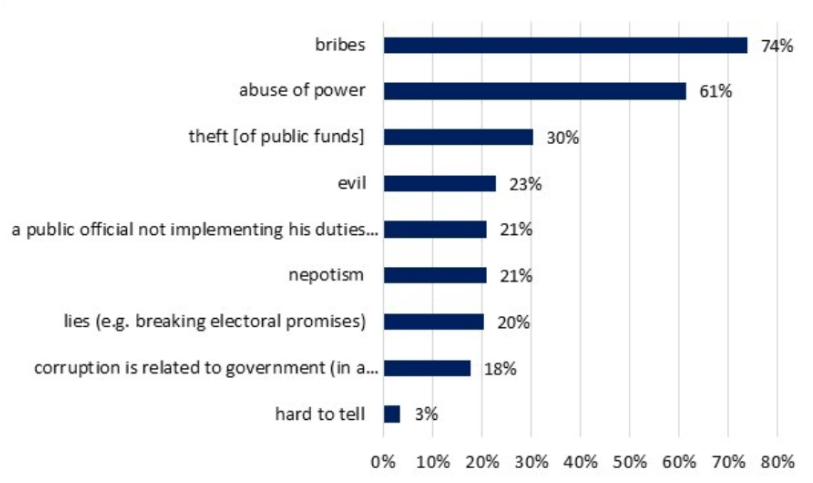
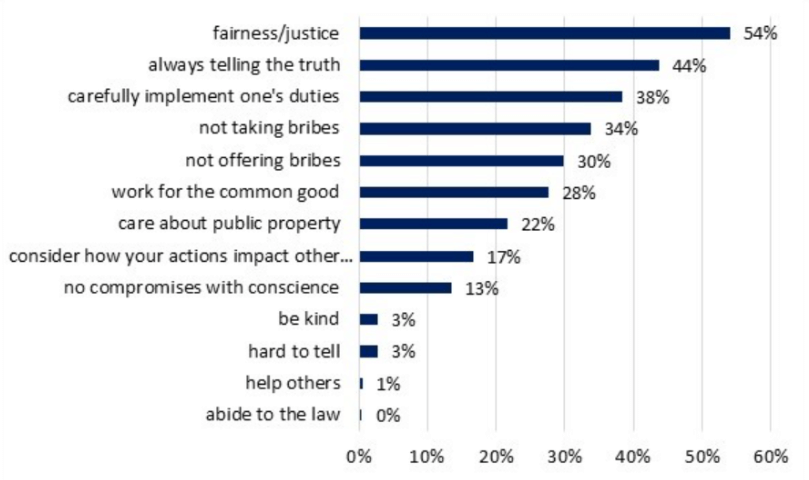
Again, similar to earlier surveys, the majority of our respondents believe that corruption is bribery, abuse of power by officials and diversion of public funds (figure 3A). Answers to the questions on integrity (figure 3B) reveal less understanding of what it is and probably reflect the understanding by teenagers of how a “good” person should behave. These answers may also suggest that fairness (justice) is important for Ukrainian children, as well as for the society as a whole.
Figure 3A. Answers to the question “What is corruption?”, % of respondents
Source: own survey. Note: this was an open question but if a respondent had difficulty answering, an interviewer could suggest a few options. Several answers were possible.
Figure 3B. Answers to the question “What is integrity?, % of respondents
Source: own survey. Note: this was an open question but if a respondent had difficulty answering, an interviewer could suggest a few options. Several answers were possible.
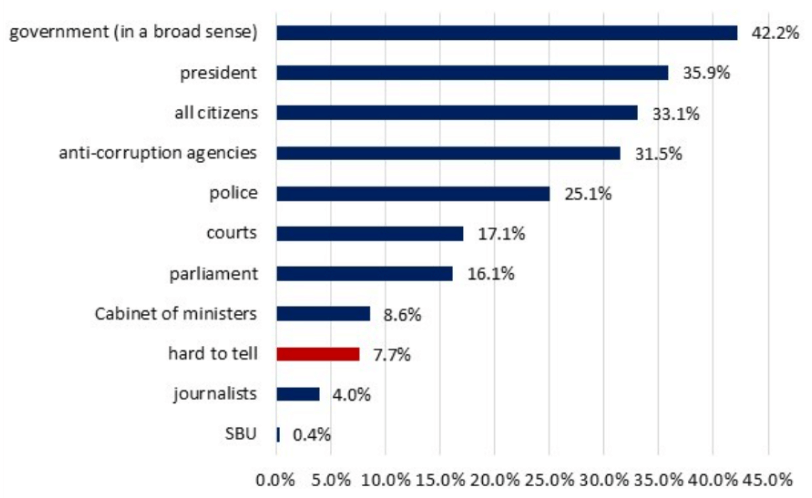
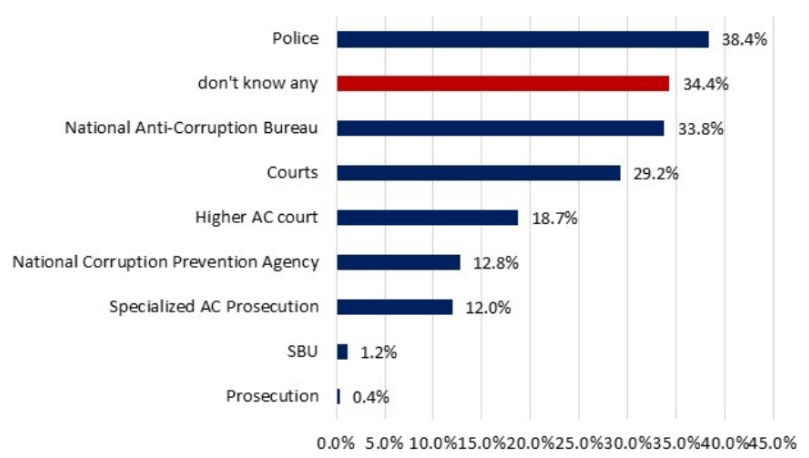
Levying the responsibility to fight corruption on high-level officials is also in line with earlier surveys of the general population, as well as rather high recognition of the role of citizens visible in the surveys in the last few years (figure 4A). At the same time, students had a hard time naming the anti-corruption agency: 38% named the police while the second most popular answer (34%) was “I don’t know” (figure 4B). 56% of respondents could not name any of the four specialized AC agencies (NABU, SAPO, NCPA, AC Court), 22% could name just one agency; three or four agencies were named by 4.5% each.
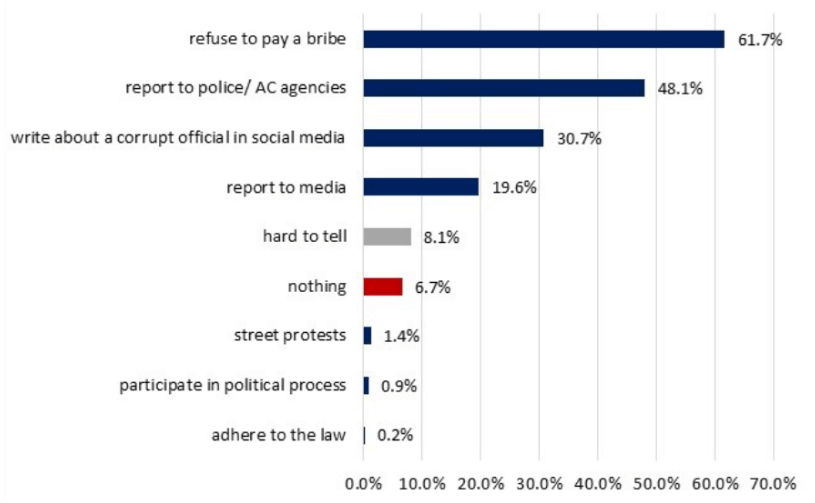
The most common way to fight corruption in view of our respondents was non-participation (figure 4C). Other methods, such as reporting to anti-corruption agencies or the police and publicity (shaming) were named quite frequently too.
Figure 4A. In your view, who is responsible for fighting corruption?
Source: own survey. Note: this was an open question but if a respondent had difficulty answering, an interviewer could suggest a few options. Several answers were possible.
Figure 4B. Which AC organs do you know?
Source: own survey. Note: this was an open question, a person could provide several answers
Figure 4C. What can citizens do to fight corruption?
Source: own survey. Note: this was an open question, a person could provide several answers
Integrity practices in Ukrainian schools
Many Ukrainian schools and classes used to collect money for needs ranging from interactive whiteboards to soap and light bulbs. With the decentralization reform, local governments obtained more powers to distribute the money, and many communities, especially cities, also received more resources. This allowed them to spend more on schools - both on school supplies and on salaries. However, the practice of collecting money for the needs of schools or classes largely remains. Some schools introduced charitable funds to [informally] charge tuition fees (similar funds were created by many hospitals as an informal way to charge for services). Another reason may be that schools need some flexibility, e.g. being able to replace or repair some broken equipment quickly, without lengthy procurement procedures.
On the positive side, only 37% of respondents reported that their school has a charity fund (however, almost 30% do not know whether their school has it or not), and only about 10% of them stated that contributions to this fund are in fact non-voluntary. Respondents from specialized schools and lyceums more often report having a charitable fund than students of regular schools or colleges (42-43% vs 33-34%).
44% of respondents said that they collected money for the class fund, and 62% collected money for presents for teachers/professors. This practice is the most common in lyceums (68% of respondents from lyceums confirmed it) and the least common although still quite widespread in regular schools (58%).
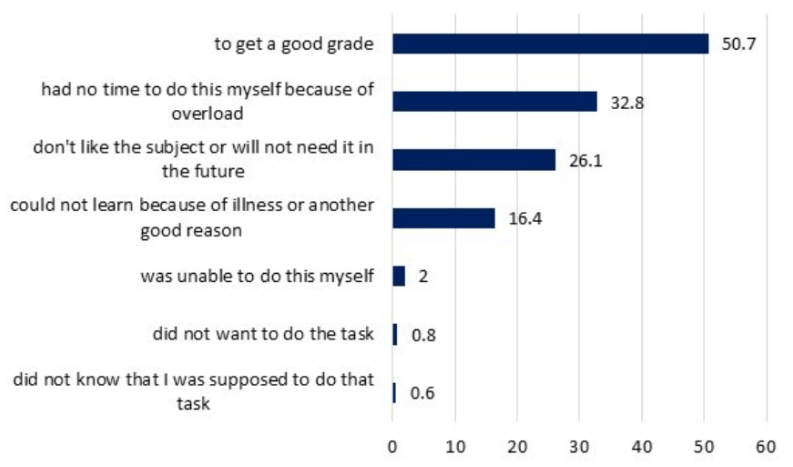
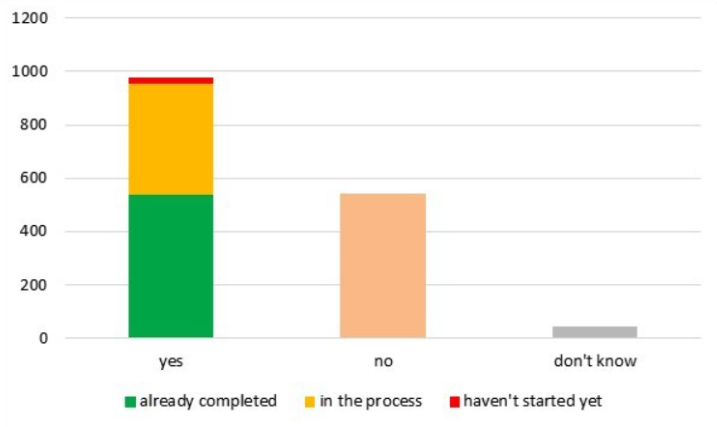
26% of respondents reported that cheating in their schools is very common and 58% - that rather common. About ¾ of respondents said that they or their classmates cheated (copied someone else’s homework or exam), and about the same share allowed their classmates to copy their homework or exam work. The distribution of reasons for this behaviour is presented in figure 5A (the distributions are similar across school types). This figure suggests that copying work of other students is perceived as a “normal” way to get a better grade. A third of students report overload and about a quarter the “uselessness” of a subject as reasons for cheating.
Figure 5A. Why have you copied other person’s work?, % of respondents who copied other people’s work (several answers were possible)
Figure 5B. Why have you allowed others to copy your work?, % of respondents who allowed to copy their work, one answer possible
Source: own survey
What defines whether a person cheats or not? We perform an estimation (see Annex 1 for details) to see whether some personal factors or a person’s beliefs impact the probability of cheating. Expectedly, the most robust predictors of whether a person copies other people’s work is whether this is a “tradition” at school - variables “cheating at our school is very common/rather common” have large positive and significant impact on the probability that a person cheats and negative impact on the probability that a person does not cheat. Collecting money for the class fund and teachers’ presents (another widespread ‘tradition’) also has a positive significant impact on the probability that a person cheats, although the magnitude of this impact is much lower. Interestingly, being able to name several anti-corruption institutions somewhat reduces this probability which may suggest that if a person knows more about anti-corruption and integrity, she is somewhat less likely to engage in dishonest behaviour.
We also looked at why a person believes that connections are important for obtaining the desired profession or reaching success in life (note that the share of students who think so is rather low - see figure A5 in Annex 3, so these results should be interpreted with caution). We did not find any relation of this outcome with variables such as having a class fund, collecting funds for teachers’ presents or cheating. Male students and students from large cities (over 500 thousand people) were more likely to make these statements (probably because students from large cities have more connections in general). Students who trust bloggers seem more likely to make this statement whereas those who trust media - less likely. At the same time, students who say that they trust bloggers are less likely to cheat. This requires further investigation into what kind of bloggers the students are following.
Conclusions and policy recommendations
When asked about corruption, teenagers provide the answers very similar to those provided by the general population. Many of them believe that corruption is ‘usual’ for the Ukrainian government, and a part of Ukrainian mentality. However, these beliefs do not impact a person’s lack of integrity (measured by copying other people’s work), while the “normality” of cheating in a person’s school or class does. This pattern suggests that Ukrainian teachers and school heads need to apply much effort to escape this bad equilibrium and to ensure that cheating is not perceived as something normal.
One of the suggestions can be explaining to students what integrity is, and how lack of integrity undermines the common good - the value of education. Another suggestion is to introduce more freedom of choice into the curriculum so that students who know which subjects they want to study could concentrate on those. Finally, encouraging students to produce and discuss their own ideas (especially in the humanities) rather than learning and reproducing textbook materials would both reduce cheating and increase the quality of learning.
The research was conducted by sociologists of the Info Sapiens company with the support of the EU Anti-corruption Initiative (EUACI) within the Youth Integrity Marathon project conducted by VoxUkraine.
Annex 1. Estimation method
As dependent variables we use the following:
- a dummy=1 if a person copies other peoples’ work
- a dummy=1 if a person does not copy other people’s work
- a dummy=1 if a person copies another person’s work in order to get a better grade (rather than for some “better” reasons, such as being sick or unable to implement a task)
- a dummy=1 if a person lets other people copy her work
- a dummy=1 if a person does not let other people copy her work
- dummy=1 if a person thinks that connections (and parents) are important to either get a desired profession or to get success in life
As possible explanatory variables we include the following:
- a person believes that most people can (or cannot) be trusted
- a number of other ‘trust’ variables - trust to parents, friends, teachers etc. (figure А7)
- beliefs of a person about a number of corruption-related statements (figure А5), to the statements shown in the figure we also add a person’s answers (dummy variables) whether she thinks that corruption is very common or rather common in Ukraine and that all citizens are responsible for fighting corruption (the first belief may increase the probability of cheating, the second may decrease it)
- whether a person studies or has already studied a civic education course (during this course a person may learn about integrity and thus be less likely to cheat); we also add the numbered variable of how many of the 4 specialized anti-corruption agencies a person could name (this variable also measures a person’s awareness about corruption);
- whether a person participates in a school self-government or an NGO (we test whether a person who shows more civic activity is less likely to cheat);
- whether there is a charitable fund in a person’s school, whether they collect money to the class fund and for presents (these practices may “normalize” corruption)
We also add a number of control variables - gender, age, type of school, type of settlement, and region.
We use probit regressions to estimate these relationships.
Annex 2. Literature on corruption measurement
Whereas corruption draws a lot of attention from both researchers and policy-makers, the conceptual questions such as “What is corruption?”, “How to measure corruption?” or “What exactly are we measuring with existing indicators?” are usually left to academics (probably under the assumption that businesses or policy-makers know very well what corruption is). For example, one of the most popular measures, TI Corruption perception Index provides the perception of corruption by businesses, and therefore is a measure primarily of administrative corruption (Knack, 2006). While perceptions and beliefs impact people’s behaviour, as shown by Kaufman et al (2007) or Armand et al (2021), Roca (2011) shows that the gap between perceived level of corruption and incidence of corruption can be quite substantial, and it is higher in countries with the freedom of press and low trust to government, which is the case of Ukraine.
There is quite a large literature on corruption measures and indicators (see, for example, Wysmulek (2019) for an extensive overview, and UNDP (2015) for a practical guide on selecting corruption measures for different purposes). This literature (Cao et al 2021, Perumal 2022) suggests that lately corruption measurement has been trying to become more objective, e.g. move from perception surveys to incidence surveys, and from governance indicators to big data analysis (e.g. mentions of corruption and its connotation in blocks of texts). In Ukraine, the data on corruption mostly come in two forms: surveys of citizens (or specific groups of citizens, such as students or lawyers) and case studies by investigative journalists. Some information on high-level corruption cases can be found in the reports of National Anti-Corruption Bureau and other AC agencies: among other, they report the number of cases investigated and considered by court and the amount of money returned to the state budget.
Annex 3. Survey of youth: descriptive statistics
The field work was performed in January 2023 by InfoSapiens polling company using face-to-face method with tablets (CAPI). In total 1,563 teenagers aged 15-18 who study at secondary or technical schools (colleges) were surveyed in all the regions of Ukraine except for occupied territories.The sample is representative across age, gender, settlement type, and region as of 01.01.2022. Macro regions are defined as follows: North (Zhytomyrska, Kyivska, Sumska and Chernihivska oblasts), West ( Volynska, Zakarpatska, Ivano-Frankivska, Lvivska, Rivnenska, Ternopilska, Chernivetska oblasts), Center ( Vinnytska, Kirovohradska, Poltavska, Khmelnytska, Cherkaska oblasts), South ( Mykolaivska, Odeska, Khersonska oblasts), East (Dnipropetrovska, Donetska, Zaporizka, Luhanska, Kharkivska oblasts), and Kyiv is a separate region.
51% of respondents are male, 41% are 15, 35% - 16, 20% - 17, and 4% - 18 years old (figure A1). 61% live in cities and 32% in villages (figure A2), 44% study in regular secondary schools, 32% in lyceums (gymnasiums) and 21% in colleges/ professional schools (some students enter colleges after the 9th grade). Regional distribution of respondents (figure A3) shows that relatively more people from East and South relocated since the start of the full-scale Russian invasion. 23% of students relocated since February 24th 2022.
Figure A1. Gender/age distribution of the sample
Source: own survey
Figure A2. Distribution of respondents by type of settlement and type of school
Source: own survey
Figure A3. Regional distribution of respondents as of February 24th, 2022
Source: own survey
3.7% of respondents already started working (68% of them as freelancers). Among 18-year-olds this share is the highest at 13%. It is 5.7% for 17-year-olds, 3.7% for 16-year-olds and just 1% for 15-year-olds.
Older students and those studying at the colleges (professional schools) are more likely to have already decided about the profession which they are going to master (figure A4). Note that about a fifth of those who study at colleges, i.e. are obtaining some profession, are not yet sure about their profession (the shares of people who are yet undefined is the highest among those in social sciences, education, engineering and blue collar specialties; this would be an interesting topic to investigate but beyond the scope of our paper).
Figure A4. Shares of students who already know their future profession, by school type (panel A) and age (panel B)
Panel A, Panel B
Source: own survey
Respondents who said that they have already chosen their desired profession were asked what is important to obtain that profession, whereas those undecided were asked what is important to achieve success in life. The answers to these questions were quite similar (figure A5).
Figure A5. What is important to get a desired profession or success in life?, % of respondents (several answers were possible)
Source: own survey
62% of respondents have a course in civic education in their schools, and 34% have already completed it at the time of the survey (figure A6).
Figure A6. The number of respondents who have civic education course at schools and study it
Source: own survey. Note: along the X axis are the answers to the question “Do you have a civic education course at your school?”
42% of respondents believe that most people can be trusted, while 38% do not agree with this (the rest supported both of these statements, therefore, we excluded their answers from the analysis). Our respondents have high trust in their parents and friends, and the president of Ukraine is in third place. Celebrities and bloggers have lower trust than the media, and MPs have the lowest trust among people and institutions which our respondents evaluated (figure A7).
Figure A7. How much do you trust the following people or institutions?
Attention
The author doesn`t work for, consult to, own shares in or receive funding from any company or organization that would benefit from this article, and have no relevant affiliations
