“If democracy is supposed to be based on the will of the people, someone should go find out what that will is,” said George Gallup, the founder of public opinion polling. Indeed, surveys are a tool for capturing public sentiment and needs, which politicians rely upon when developing programs, legislative initiatives, and election campaigns. When survey results are representative and methodologically sound, authorities receive objective feedback, while voters gain insight into the attitudes of their fellow citizens and a foundation for making informed decisions.
However, the effectiveness of this tool depends on how survey results are covered in the media. News outlets and online platforms decide which studies will be brought to the forefront and which will remain in the shadows. Such selectivity can hinder quality discussions on important issues and deprive society of the opportunity to form a comprehensive understanding of itself.
At a time when surveys are actively used in political, media, and analytical discourse, it is crucial to be able to quickly determine which studies are trustworthy and which are not. Without access to basic methodological information, experts and informed readers find it difficult to assess the validity of conclusions or account for the limitations of a given study.
We examined how sociological surveys are covered in Ukraine’s media landscape. In particular, we analyzed which research contractors and commissioning clients most frequently attract media attention, the thematic focus of the surveys, the most widely circulated publications featuring survey results, and the completeness of methodological details in media reporting.
What did we do?
To analyze how sociological research is covered in the media, we obtained a dataset of publications from the agency LOOQME for February 2025, based on keywords such as “survey,” “sociological research,” and related terms. Out of 17,434 news items, we retained 4,535 from online media, news agencies, and the press, excluding television, radio, and social media.
In the second stage, a GPT model identified whether a survey was the main topic of the text. The final sample included 3,650 publications. The texts were processed automatically via the GPT-4o/mini API with a temperature parameter of 0 to ensure consistent results. Separate prompts were used for each task (topic, presence of methodology, mentions of organizations).
The surveys were classified according to 17 thematic categories from the Comparative Agendas Project. Methodological transparency was assessed using 11 criteria, including the presence of a client, date, sample, margin of error, and so on, in line with the standards of AAPOR (American Association for Public Opinion Research—the leading professional organization of public opinion researchers).
Comparative Agendas Project (CAP) is a large international research initiative that systematically tracks and codes political activity—such as legislation, speeches, and media publications—in more than 20 countries. Its primary goal is to understand how the priorities of governments and societies evolve over time. Using a unified coding scheme (21 major topics and over 220 subtopics), the project’s data enables comparative analysis of political agendas across different countries. More information is available at: www.comparativeagendas.net.
The research code is available on GitHub, and the full prompts are provided in the report’s methodological appendix. For more details on the methodology, see Appendix 2 below.
Who sets the agenda?
An analysis of media mentions reveals which organizations carry the most weight in the public space—and, consequently, exert the greatest influence on the agenda.
In February 2025, the Kyiv International Institute of Sociology (KIIS) was the most frequently cited source of sociological data in the media, accounting for 15.2% of all mentions. In second place was the sociological group Rating (4.3%), followed by the international research company YouGov (2.5%). Next were SOCIS (2.3%), and the Ministry of Finance of Ukraine (2.1%) as a data client.
Thus, KIIS, Rating, and SOCIS form the core of the most visible Ukrainian sociological centers in the national information landscape. Other Ukrainian research organizations had more limited media presence: the Razumkov Center was mentioned in 0.8% of publications, Info Sapiens, the Ilko Kucheriv Democratic Initiatives Foundation, and Rating Lab—in 0.7% each, while the Institute of Mass Information appeared in 0.5% of publications.
Figure 1. Most mentioned research contractors and clients in February 2025
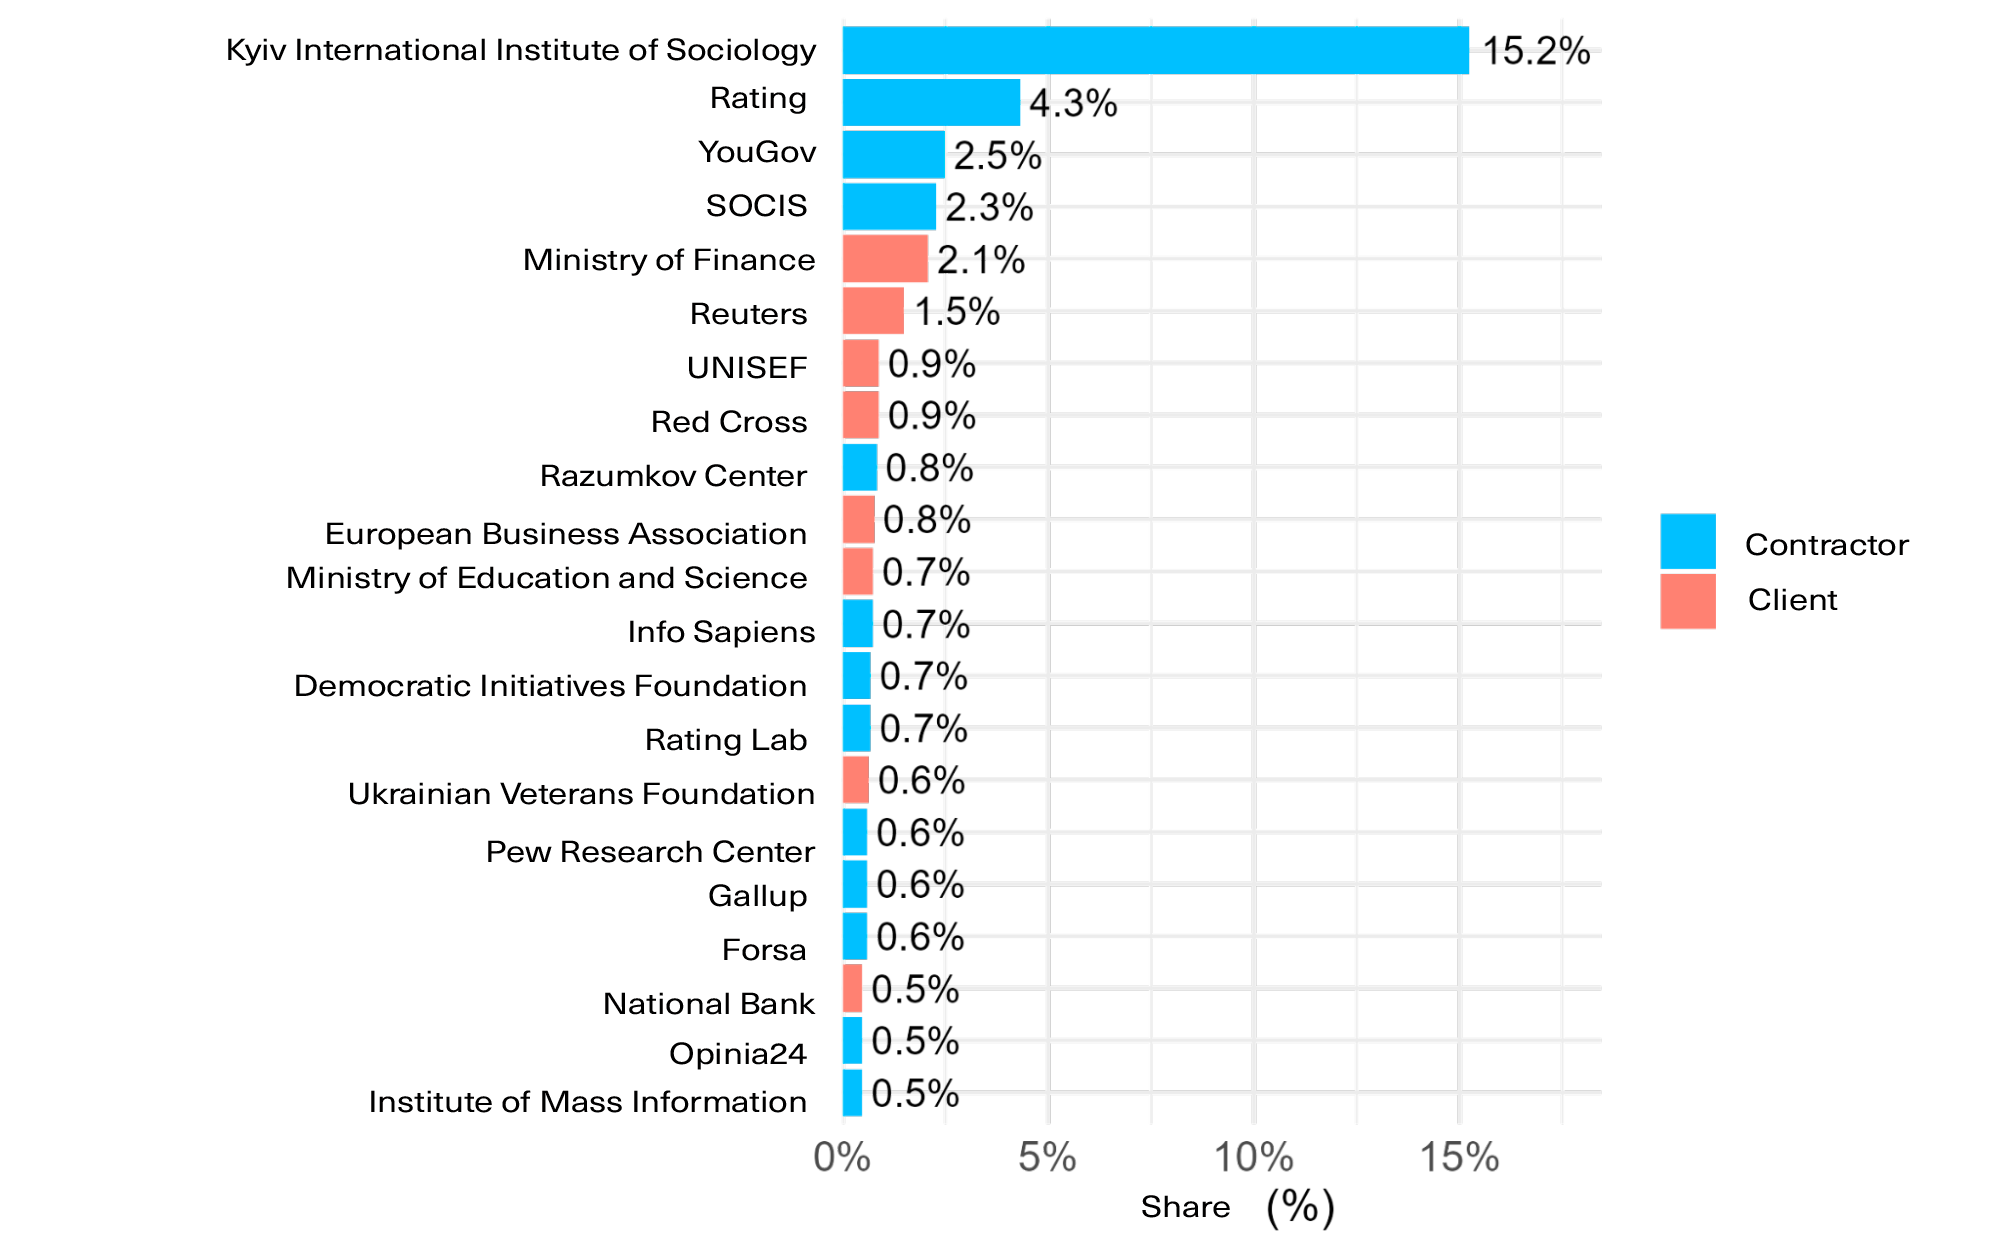
In addition to Ukrainian centers, international organizations also appeared in the media, including Gallup, the Pew Research Center, the Forsa Institute, and Opinia24. These were mentioned primarily in the context of studies on support for Ukraine and assessments of political leaders in various countries.
At the same time, the agenda is shaped not only by research institutions. Other types of organizations also play a significant role:
- Business associations, such as the European Business Association (EBA), which regularly commission studies on the business climate.
- Humanitarian agencies (UNICEF, Red Cross), which use surveys to assess population needs.
- Media agencies, such as Reuters, which act as distributors of data produced by sociological centers.
The involvement of government bodies is also notable: the Ministry of Finance, the Ministry of Education and Science, the National Bank of Ukraine (NBU), and the Ukrainian Veterans Foundation were mentioned primarily as clients of research. However, some—such as the NBU—also conduct their own surveys.
What surveys do the media cover?
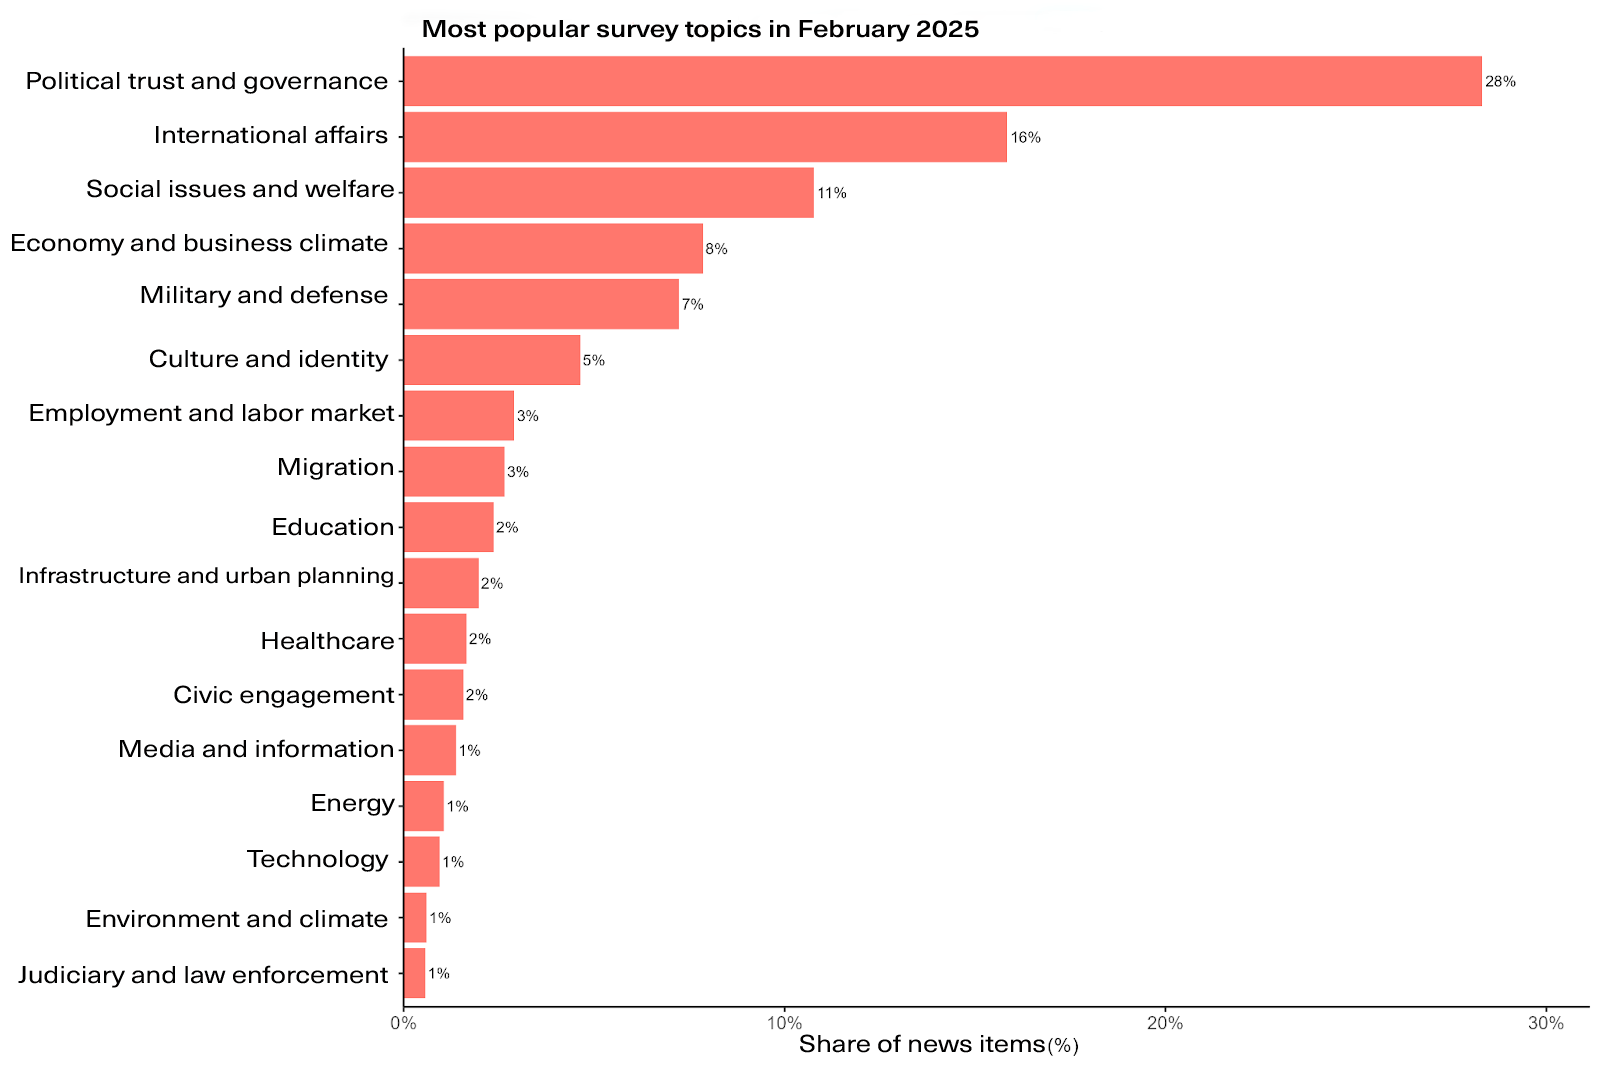
In February 2025, over half (55%) of media mentions of sociological research concerned three topics: political trust, international relations, and social welfare.
The most frequent focus was politics and trust in government (28%). Coverage centered on levels of trust in key state figures, including President Volodymyr Zelensky, Chief of the Defense Intelligence of Ukraine Kyrylo Budanov, and former Commander-in-Chief Valerii Zaluzhnyi. Media often cited KIIS data on trust in the President, Rating’s findings of 65% support for Zelensky, and SOCIS results on perceptions of government legitimacy during martial law. Surveys by the International Republican Institute (IRI) appeared in the context of support for democracy and public attitudes toward negotiations with Russia.
The second most common topic was international affairs (16%). Media coverage highlighted Ukrainians’ views of allied countries, expectations regarding military and financial aid, and public sentiment abroad. For instance, Gallup reported on American attitudes toward Ukraine; Poland’s Opinia24 published data on Polish expectations for a swift peace; and the Friedrich-Ebert-Stiftung presented a comparative survey in 14 countries on geopolitical orientations and fears of Russia.
Social issues and well-being accounted for 11% of mentions. These included topics such as stress levels, anxiety, workload among social workers, and the well-being of vulnerable groups. In this context, media referenced a Cedos study on social services in Mykolaiv, a KIIS and Ruban Litvinova survey on happiness and anxiety among Ukrainians, and a Betobee well-being screening among corporate sector employees.
The economy and business climate were mentioned in 8% of publications. This category included issues such as mobilization-related challenges for businesses (data from the EBA), entrepreneurs’ expectations, and citizens’ economic anxieties (a survey by Rating).
Military and defense-related topics appeared in 7% of mentions. This category covered surveys on support for the Armed Forces of Ukraine, trust in military leadership, attitudes toward mobilization, and readiness for prolonged resistance.
Against the backdrop of the dominance of politics and international relations, other areas of public concern—such as culture, employment, migration, education, healthcare, infrastructure, the environment, and justice—were mentioned only rarely, in most cases in fewer than 3% of reports.
Thus, the data analysis for February reveals a significant thematic imbalance in favor of political and international topics. Whether this reflects a sustained trend or is merely a response to the events of the month is a question that only regular monitoring can answer.
Figure 2. Most popular survey topics in February 2025.
Most popular publications on surveys
Not all mentions of surveys receive equal visibility. We identified the ten most widely viewed media stories of February 2025 based on audience reach. This list does not reflect the social significance of the topics but rather indicates their visibility and impact in the media at the time of analysis.
- Bullying among children: alarming figures from Viber
Results of a Rakuten Viber survey, which found that 59% of children had experienced bullying, became the basis for public criticism of the insufficient effectiveness of child protection against harassment.
- Adolescents’ mental health during wartime
A nationwide survey of adolescents aged 11–17 highlights issues of mental health, bullying, risky behavior, and the impact of war. The findings present a timely portrait of Ukrainian youth in the aftermath of the COVID-19 pandemic and under conditions of full-scale war.
- Support for Ukraine in the U.S.: a response to Trump
Amid statements by Donald Trump, survey data showing that a majority of Americans continue to support Ukraine were actively circulated in the media.
- Nuclear energy: public support for government decisions
A survey by the Rating group found that 80% of Ukrainians support the completion of the Khmelnytskyi Nuclear Power Plant, and 69% view the government’s energy policy as effective. These results have been used as an argument in favor of the government’s decisions in the energy sector.
- Trust in the President and wartime elections
Survey results from SOCIS and KIIS showing high levels of trust in President Zelensky refute Donald Trump’s claim of 4% support. The data also indicate that Ukrainians are largely opposed to holding elections before the end of the war.
- Elections during wartime
A SOCIS survey shows that over 63% of Ukrainians oppose holding elections before the war ends. These findings are frequently cited in response to Trump’s statements and in the broader context of debates about external pressure regarding elections in Ukraine.
- Schoolchildren’s educational needs: “Education for Life” reform
The Ministry of Education and Science, in partnership with U-Report, is conducting a survey of students in grades 5–11 to identify their educational needs. The results are intended to inform the implementation of the “Education for Life” policy.
- Ukrainians’ views on political leaders and formats of peace negotiations
A survey by the Rating group shows positive attitudes among Ukrainians toward several European leaders and a high level of trust in President Zelensky (65%). Most respondents support Ukraine’s negotiations with Russia but oppose U.S.–Russia talks that exclude Ukraine.
- Attitudes of Polish citizens toward Ukraine’s possible strategy in the war with Russia
A survey by Opinia24 shows that 57% of Poles support Ukraine reaching a quick peace agreement, while 30% favor continued military action. Respondents’ views vary by gender and political affiliation. The results were cited in the media to illustrate shifts in public opinion in Poland.
- Attitudes of German citizens toward the Federal Government’s future support for Ukraine
According to a survey by Insa, 46% of Germans do not support the continued provision of weapons or financial aid to Ukraine, while 28% favor maintaining support. Opinions vary significantly by age, gender, region, and party affiliation. The data were presented as an example of shifting public attitudes in Germany ahead of the formation of a new government.
Quality of survey result reporting in the media
Ukrainian media generally limit themselves to reporting the results of sociological surveys without explaining how those surveys were conducted. One might argue that the average reader is unlikely to grasp methodological nuances, but basic details—who conducted the survey, who commissioned it, and who was surveyed—are accessible to everyone and serve as important markers of credibility. The absence of such information deprives the expert community of the ability to verify the results.
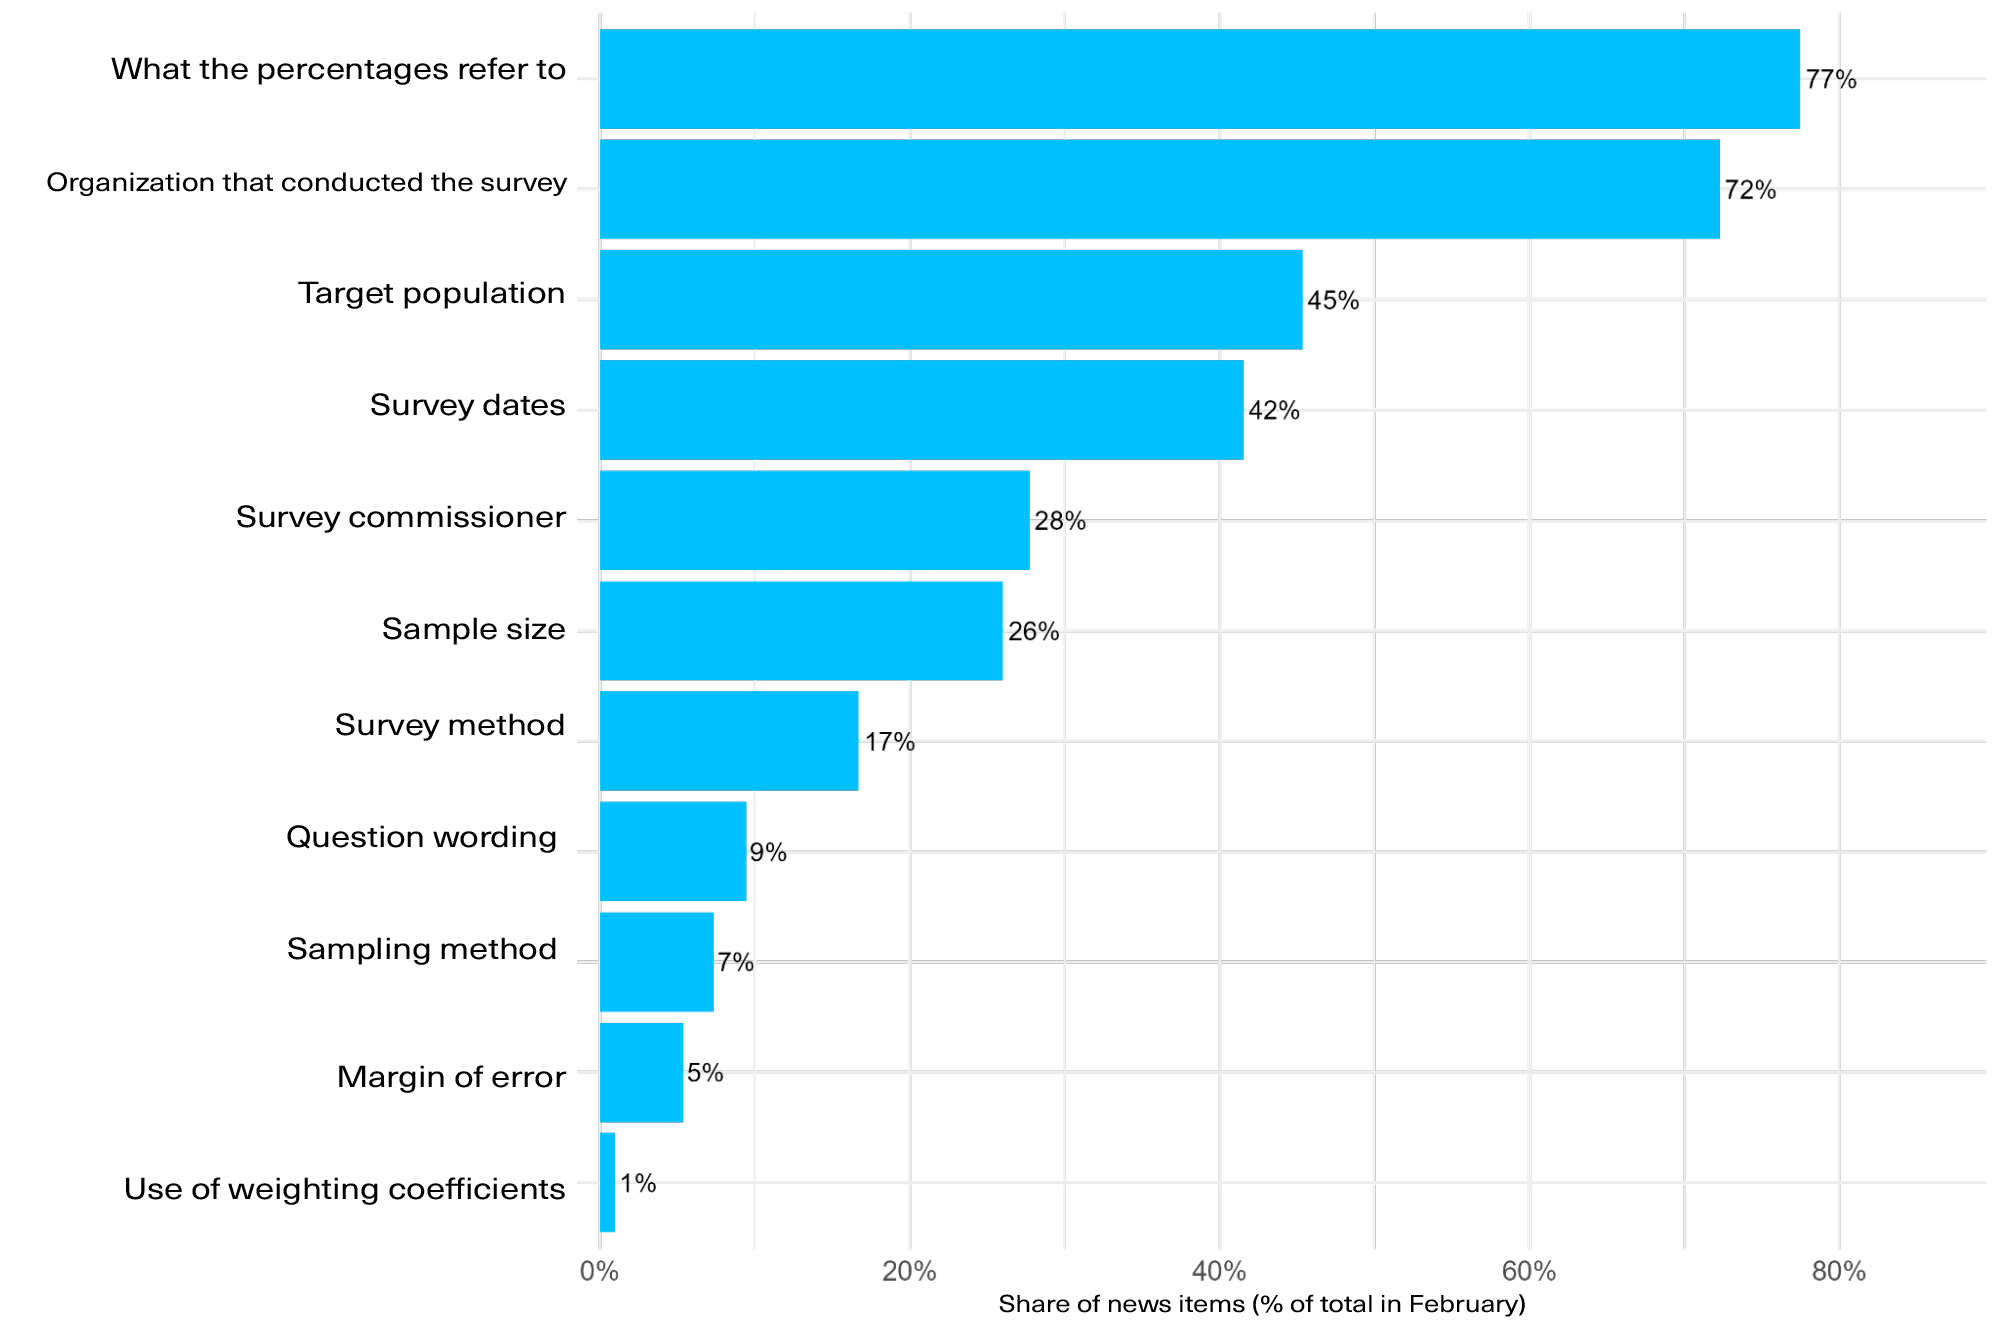
The analysis shows that only certain methodological elements are consistently present in publications. Most commonly, the media indicate:
- The percentages on which the conclusions are based—in 78% of reports.
- The organization that conducted the survey—in 72% of cases.
It is important to note that although the prompt was explicitly formulated to request the name of the organization that conducted the survey, in practice, the model does not always clearly distinguish between the contractor and the client—both may be included in the count.
In contrast, other important characteristics are mentioned much less frequently:
- Dates when the survey was conducted (42%)
- Target population (46%)
- Sample size (27%)
- Commissioning party (28%)
Yet it is precisely these parameters that make it possible to assess whether the data can be considered representative and reliable.
The least accessible technical details for readers remain:
- Mode of survey administration, such as telephone, online, etc. (17%)
- Wording of questions (9%)
- Sampling method (8%)
- Margin of error (6%)
- Use of weighting coefficients (only 1%)
Such a low figure reflects not only editorial practices in the media but also the practices of the research centers themselves, as weighting is not applied in every study—or information about it may be absent from press releases.
Figure 3. Presence of methodological information in media publications on surveys
Conclusions
So, how were sociological surveys presented in the media in February 2025? Our pilot study allows us to make two key observations.
First, the media agenda was concentrated around two topics. More than half of all survey mentions focused on politics and international relations. Other socially significant areas—such as education and healthcare—were far less represented.
Second, the way results were presented was marked by limited disclosure of methodological details. The media almost always reported percentage figures and the name of the research organization. However, parameters that allow for an assessment of data reliability—such as who commissioned the study, when and how it was conducted, and the margin of error—were mentioned far less frequently.
The combination of these two factors—strong concentration on political topics and incomplete disclosure of methodology—creates a situation in which survey results become vulnerable to speculation and use in political discourse. This, in turn, complicates their balanced interpretation by both experts and the broader public.
A telling example is the case of a headline in Ukrainska Pravda accompanying a news story about a KIIS survey on the Ukraine–United States Mineral Resources Agreement. The original headline, “Less than Half of Ukrainians Expect Positives from the Agreement,” was formally accurate (47% expressed positive expectations). However, it created the misleading impression that most respondents held negative views. In fact, only 22% had a negative assessment; among those with an opinion, nearly 68% were positive. This was pointed out by KIIS President Volodymyr Paniotto in a public Facebook post, after which the newsroom team revised the headline. This case illustrates that even high-quality media can misrepresent public opinion—not by manipulating the data, but through an unfortunate headline or excessive simplification.
However, the question remains: How stable are these trends? Is the observed thematic concentration and the practice of selective methodological disclosure a permanent feature of Ukrainian media, or merely a characteristic of the period under study? Only regular monitoring over an extended timeframe—which we plan to conduct—can provide an answer to this question.
Limitations of the study
Like any research, this study has its limitations, which should be taken into account when interpreting the results.
- Limited period of analysis. Our analysis covers only one month—February 2025. This means the findings represent a “snapshot” of the media landscape at a specific point in time and may have been shaped by unique events during that period.
- Exclusion of television and radio broadcasting. The analysis includes only textual materials from online media, news agencies, and the print press. It is worth noting that the vast majority of publications in our final sample came from online outlets. As such, our conclusions are most relevant to Ukrainian online media and cannot be generalized to the entire media environment.
- Challenges in identifying organizations. The automated analysis encountered two issues. First, the model did not always clearly distinguish between the roles of the client and the contractor, which led us to combine both into a single category: “organization associated with the survey.” Second, there were difficulties in standardizing organization names (e.g., “KIIS” vs. “Kyiv International Institute of Sociology”). Despite our efforts at normalization, some mentions may have been missed, potentially leading to undercounting for certain organizations.
- Assignment of a single topic. Each survey was assigned to one, most appropriate thematic category. While this approach simplifies the analysis, some studies could reasonably fall into multiple categories simultaneously (for example, “economic consequences of the war” relates to both the economy and defense). This decision was made to ensure the stability and reliability of the automated classification, as attempts to assign multiple topics sometimes led the model to generate less relevant categories.
Appendix 1. Why should readers care about the “boring” methodology of sociological surveys?
Media often present survey results as “hard” numbers, creating the illusion of absolute precision. In reality, any sociological study is not a precise mirror of the actual state of affairs but rather an approximate portrait constructed according to specific rules.
Methodology is the description of those rules. It is a set of tools that allows readers to look behind the numbers and answer key questions for themselves: How reliable is this “portrait”? Whose views does it actually represent? How should it be interpreted?
Here’s what each element of survey methodology tells us:
1. Who conducted the research and when?
- Contractor (sociological center): This serves as a marker of credibility. A survey conducted by a well-known center with years of experience (e.g., KIIS, Rating, Razumkov Center) is generally more trustworthy than one from an unknown NGO or a marketing agency without sociological expertise.
- Commissioning client: This information reveals potential conflicts of interest. A survey on political party support commissioned by the party itself should be treated with more caution than an independent study.
- Dates of fieldwork: Public opinion is fluid. Results from a survey conducted before a major scandal or significant event can differ dramatically from those collected afterward.
2. Who was surveyed and how? (The question of representativeness)
- Target population: This answers the question, “Whom do these results represent?” “All adults in Ukraine,” “residents of Kyiv,” or “followers of a specific Telegram channel” are entirely different groups. Survey results from Kyiv residents cannot be generalized to the entire country.
- Sample size: How many people were surveyed? The larger the sample (all other factors being equal), the smaller the potential margin of error. A survey of 400 people and one of 2,000 will have different levels of statistical precision.
- Sampling method: Arguably, it is the most important element. How were respondents selected? Was it a random sample, where each person had a chance of being included (the gold standard)? Or was it an online poll on a website where anyone could participate (a non-representative method)? The answer is key to understanding the survey’s quality.
3. How accurate are the results?
- Margin of error: This is a measure of confidence in the results. It indicates the range within which the true value likely falls. If a candidate’s rating is 45% with a margin of error of ±3%, this means their actual support is between 42% and 48%. This helps determine whether the difference between two close figures is statistically significant.
- Weighting: No sample is perfect. Often, there are too many young people, women, or residents from a particular region. Weighting is a statistical adjustment that “balances” the sample to reflect the actual structure of the population (by age, gender, region, etc.). Mentioning weighting is a sign of a professional approach.
4. What exactly was asked?
- Mode of administration: Whether the survey was conducted by phone, online, or in person (face-to-face)—each method has its own strengths and limitations, and it affects who is likely to participate.
- Exact wording of the question: This is critically important. “Do you support the fight against corruption?” and “Are you willing to accept higher taxes to fund anti-corruption agencies?” are two very different questions that will yield different answers. Without the exact wording, we do not know what people were really responding to.
Appendix 2. Detailed methodology of our study
In this study, we partnered with the media monitoring agency LOOQME to obtain a dataset of media publications that referenced sociological surveys. To do this, we created a search query using keywords such as “survey,” “sociological research,” and “public opinion research.”
This study represents the pilot phase of a broader project aimed at establishing a regular monitoring system for how sociology is covered in the media. To test our approach, we analyzed data from February 2025. The initial dataset included 17,434 news items. In the first stage, we filtered the data to retain only materials from online media outlets, news agencies, and the print press (including scanned copies of print publications). We excluded television, radio, and social media content, as automated analysis of spoken formats is less reliable compared to structured text. After this filtering process, 4,535 publications remained.
In the second stage, we selected only those publications in which a sociological survey or its results were the central topic. This full-text analysis of each publication was conducted using the GPT-4o/mini model. The model was instructed to determine whether the survey was the main subject of the article, rather than a passing mention.
After this filtering step, the core sample used for further analysis included 3,650 publications.
For automated text processing, we used the GPT-4o/mini model via the OpenAI application programming interface (API). The “temperature” parameter was set to 0, ensuring deterministic output—that is, the most probable and consistently reproducible results. The analysis was conducted at the full-text level for each publication. Separate structured prompts were used for each task (identifying the topic, detecting methodological elements, recognizing organizations). The full prompt formulations are provided in the methodological appendix of the full report, and the code used for the analysis is openly available on GitHub.
To identify organizations mentioned in relation to surveys, the model was instructed to extract the name of the contractor organization. Since the model does not always clearly distinguish between the contractor and the client, we combined both roles into a single category in the subsequent analysis: “organization associated with the survey.” Thus, the mention count reflects the overall visibility of organizations involved in either conducting or commissioning research.
Each survey was assigned to one of 17 thematic categories based on a classification scheme adapted from the coding framework of the international Comparative Agendas Project (CAP). We used only the first-level topics (major topics) from the CAP system. To do this, the model was first instructed to generate a brief description of the survey topic. This generated summary was then used to automatically assign the publication to the appropriate category. The model received instructions with clear definitions for each topic to ensure accurate classification. The complete list of topics and their definitions is provided in Table 1 of the Appendix.
To assess the level of methodological transparency, each selected publication was analyzed for the presence of 11 key elements: client, contractor, dates of fieldwork, target population, sample size, sampling method, margin of error, use of weighting, mode of administration, question wording, and inclusion of percentage-based response data.
Our list of criteria is based on international standards for the publication of survey results, particularly the Standards for Minimal Disclosure developed by the American Association for Public Opinion Research (AAPOR). These standards serve as a benchmark for leading global media outlets and research institutions.
Table 1. Survey topics and their definitions
| Category | What it covers |
| Trust in Politicians and Institutions, and Governance | Trust in government bodies, political leaders, state institutions, political attitudes, and governance. |
| Foreign Relations / International Affairs | International diplomacy, foreign policy, inter-country relations, geopolitics, and international organizations. |
| Military and Defense | Armed forces, national security, military operations, defense policy, and attitudes toward the military. |
| Economic and Business Climate | Economic trends, business environment, investment, entrepreneurship, and the market. |
| Employment and Labor Market | Employment levels, labor market, unemployment, working conditions, and labor rights. |
| Social Issues and Welfare | Poverty, inequality, social protection, demographics, vulnerable groups, and quality of life. |
| Healthcare | Medical services, public health, infrastructure, insurance, and diseases. |
| Education | Schools, universities, quality of education, literacy, education policy, and infrastructure. |
| Infrastructure and Urban Planning | Transport, roads, housing, urban development, public utilities, and spatial planning. |
| Civic Engagement | Participation in elections, civic activity, volunteering, and engagement with authorities. |
| Culture and Identity | National identity, traditions, language, historical memory, and cultural practices. |
| Law and Judiciary | Crime, law enforcement, courts, citizen safety, police, and prisons. |
| Environment and Climate | Ecology, climate change, pollution, environmental protection, and sustainable resource use. |
| Media and Information | Media, trust in information, news consumption, disinformation, and media literacy. |
| Technology | Technology, digitalization, internet, cybersecurity, innovation, and digital infrastructure. |
| Energy | Energy policy, energy sources, fuel markets, and renewable energy. |
| Migration | Migration, refugees, integration, immigration policy, and public opinion on migrants. |
[1]The LOOQME metric “Total Number of Views Including Duplicates” was used.
Photo: depositphotos.com/ua

Attention
The author doesn`t work for, consult to, own shares in or receive funding from any company or organization that would benefit from this article, and have no relevant affiliations