With an extremely low institutional capacity of the state, Ukraine ranks among top 10 countries in the world in terms of public expenditure as a percentage of GDP. Even if the calculations are adjusted based on the volume of the shadow economy, it won’t significantly alter the final result. The country is in a situation where the inefficient and corrupt state takes huge resources out from the economy, compared to world standards. What losses the country suffers and how can we change this situation?
Analysts of the Centre for Economic Strategy, basing on a hypothesis of existence of a nonlinear correlation between size of the public sector and economic growth, as well as on the results of existing empirical studies, have calculated the possible optimum share of public expenditure as a percentage of GDP for Ukraine and offered possible options of development of the situation.
Ukraine’s public sector is huge ― as of 2014, the country ranked ninth in the world by public expenditure as a percentage of GDP. At the same time, institutional capacity of the state in Ukraine ― the ability to effectively govern, regulate the economy, curb corruption, etc. ― is very low, and equals to that of the third world countries (Figures 1-4).
Figure 1. Level of public expenditure in Ukraine and the countries of the world (Download tables and figures: Charts)
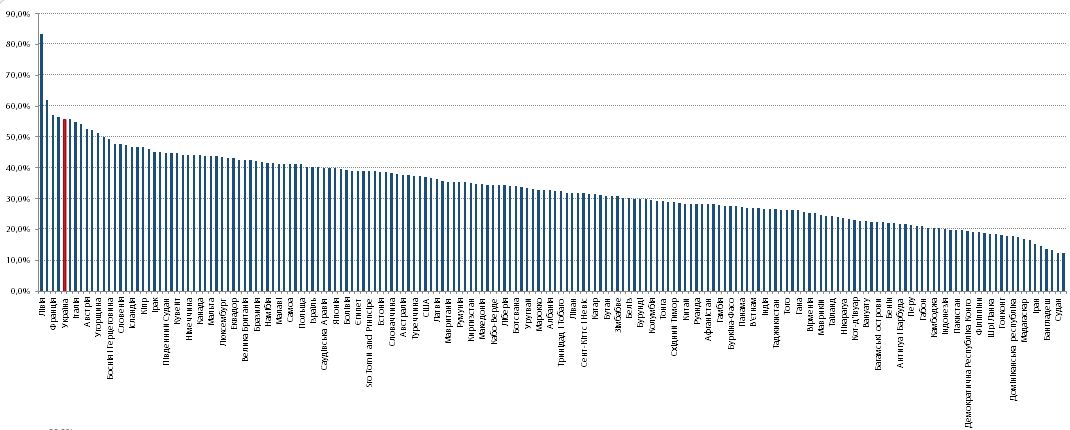
Figure 2. Worldwide Governance Indicators of the World Bank. Government effectiveness
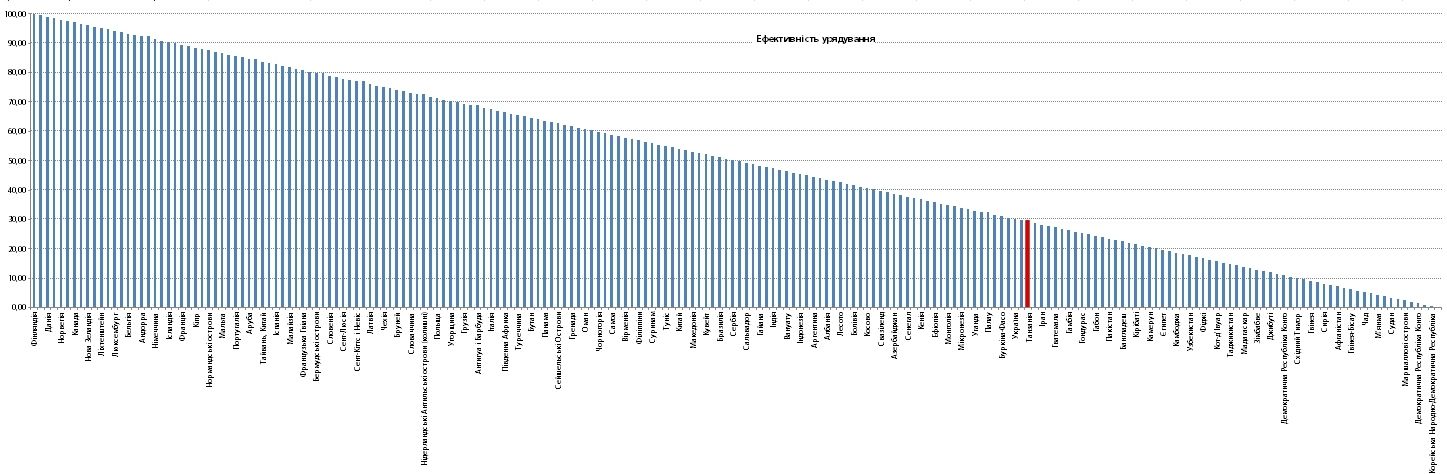
Figure 3. Worldwide Governance Indicators of the World Bank (Ukraine is highlighted in yellow). Regulatory quality
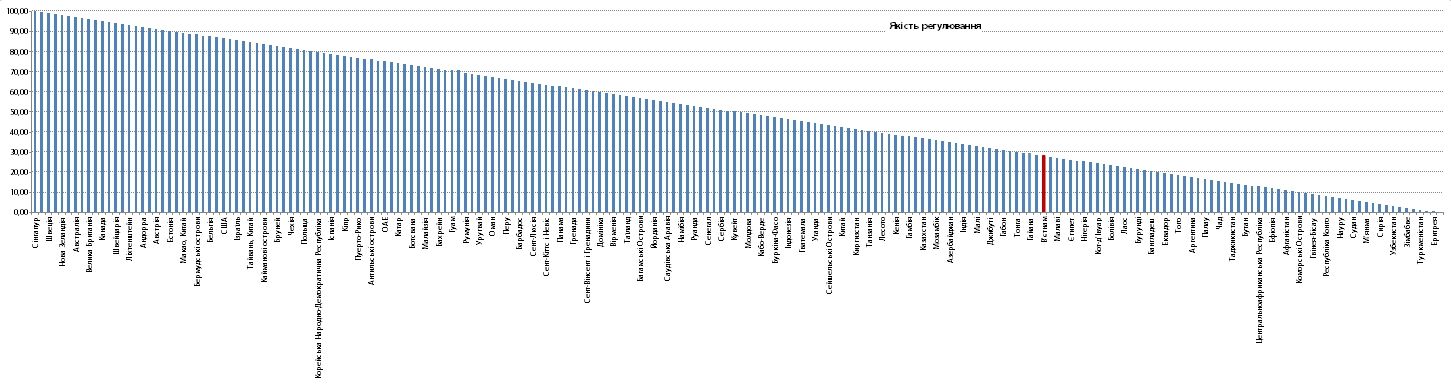
Figure 4. Worldwide Governance Indicators of the World Bank (Ukraine is highlighted in yellow). Control of corruption
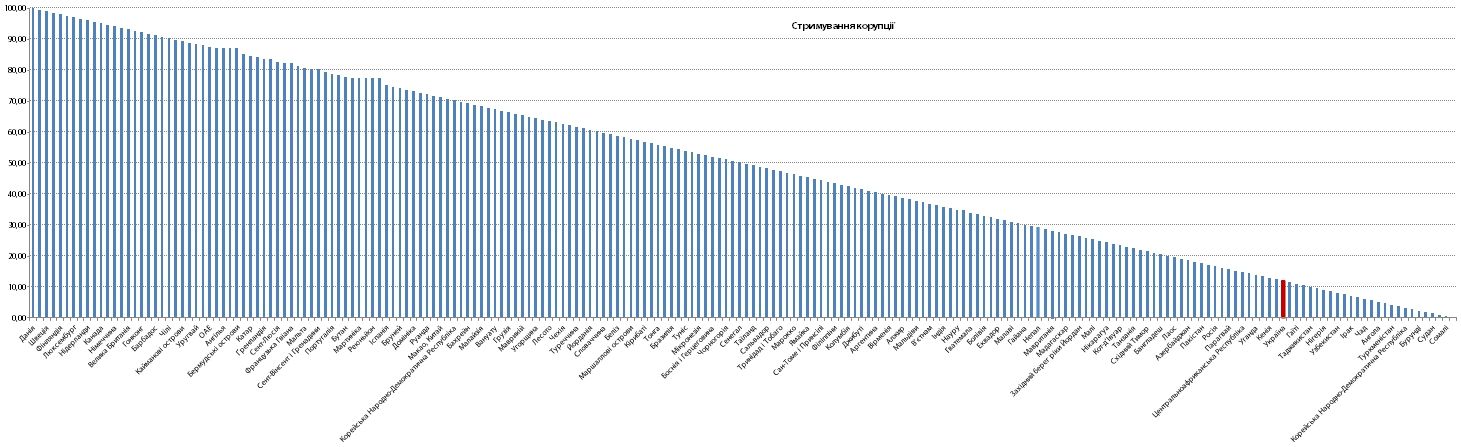
Table 1. Top 10 countries in the world by level of public spending share in GDP and indicators of their institutional capacity according to Worldwide Governance Indicators of the World Bank
| Country | Share of the aggregate expenditure of public sector, % | Government effectiveness | Regulatory quality | Control of corruption |
| Libya | 84,44 | 4,78 | 1,91 | 0,96 |
| Lesotho | 64,11 | 42,58 | 39,71 | 63,64 |
| Finland | 58,26 | 100,00 | 98,56 | 98,09 |
| France | 57,50 | 89,47 | 85,17 | 88,04 |
| Denmark | 54,60 | 99,04 | 97,61 | 100,00 |
| Belgium | 54,54 | 93,30 | 87,56 | 91,87 |
| Austria | 53,31 | 92,82 | 91,39 | 89,95 |
| Italy | 51,69 | 67,46 | 74,64 | 57,42 |
| Ukraine | 50,95 | 30,14 | 28,71 | 11,96 |
| Sweden | 50,62 | 98,56 | 99,04 | 99,04 |
Source: IMF, World Bank
Except Ukraine, Libya and Lesotho are the only developing countries ― both atypical and very specific ― among the ten largest countries by the share of public expenditure as a percentage of GDP. There’s a civil war in Libya, and most of the country’s income is generated by oil exports by the public sector ― which makes the state’s share in GDP very high. Lesotho is a small country, an enclave surrounded by South Africa, with the majority of the population working in South Africa, which is reflected in the GDP figures (ill-suited for measuring economic development of a country).
The rest of the countries with high level of public spending are developed countries with highly developed state institutions. Ukraine, with its pitiful level of institutional development, sticks out like a sore thumb.
Theory
If the public sector is too small, its physical abilities are simply not enough to provide basic security and protection of property rights. It negatively affects the investment climate and, consequently, the economic growth. Budget expenditures rise with expansion of the state functions, and it benefits the economy as long as every dollar spend by the government continues to bring more than a dollar of economic product. This concept is closely related to the concept of “marginal product” [1]. Public spending may grow until this marginal product will reach one unit ― that is, until each dollar of public spending will generate one dollar of GDP. With further increase in redistribution of the capital, the state becomes “too much”, and every dollar withdrawn from the economy to the budget in taxes, brings less advantage in public spending than if it was invested or spent on the level of economic agents [2].
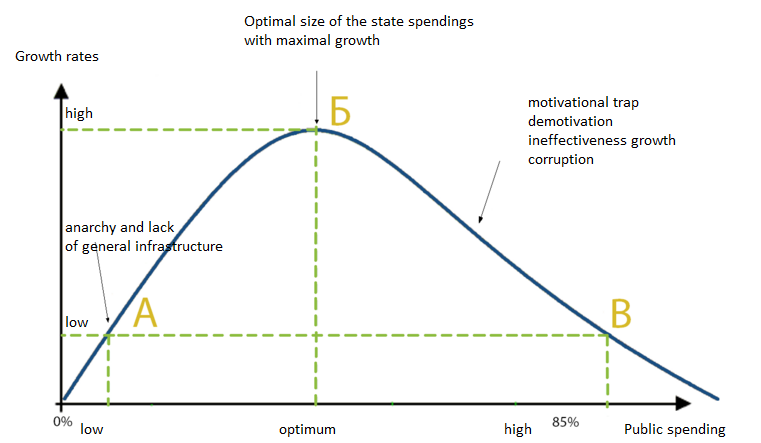
Richard Armey, American economist and politician, popularized the concept of the “optimum size of the public sector”, graphically depicting it as an inverted Latin letter “U” (later it was called Armey Curve ― see Fig. 5). In particular, Armey argued that the lack or too small size of the public sector is associated with a low level of welfare and slow economic development due to the lack of protection of property rights, law enforcement, and basic infrastructure. Such a situation doesn’t create sufficient incentives for investment and savings, as there’s a high risk of property expropriation. If the public sector is too large, or if, for example in extreme situations, all economic decisions are made by the state, the economic growth is also slow, because the high tax burden stifles entrepreneurial spirit and work motivation, which ultimately leads to low investment productivity and inefficient use of resources.
Figure 5. Armey Curve — the relationship between level of redistribution of GDP through budget and economic growth
Over the last twenty years there have been many empirical studies on the impact of public spending on economic growth, but they didn’t provide a clear answer on the optimum size of the public sector, because there are many factors determining the level of public spending and economic growth in a particular country or region.
There’s a considerable geographical distinction in the optimum size of the public sector. For the US, which has large amounts of data for the study, the optimum level of public spending is about 20% of GDP, while for the European countries, the average optimum size of the public sector has been empirically determined to range from 36% to 42% of GDP [4]. For the group of EU countries it was estimated that a deviation of 10 percentage points from the optimum level of public spending (calculated empirically) will lead to a reduction in GDP growth by 2.1 percentage points [5].
The fact that in some countries the public sector is relatively large in comparison with other countries is due to a number of sociopolitical and economic reasons. In particular, factors determining the size of the public sector are the following: democratic structure, population ageing, and public demand for social protection, welfare, globalization, and economic openness [6]. In democratic societies with an ever increasing population ageing, the demand for social protection is high, so the average voter is inclined to support political forces that promise to increase social spending. With growth of welfare the public sector becomes richer and has an increased ability to expand social programs, and directly increases the overall level of public spending. Globalization processes and increasing economic openness require a strong public sector in order to be able to reduce external shocks. In the countries where the political system is represented by parliament and coalition government, the public sector is normally larger than in the countries with a more centralized power (strong presidential power or parliament with the majority represented by one party).
The high share of GDP redistribution through the public sector doesn’t have a negative impact on the economic development of the country, provided the existence of high-quality institutions, reallocation of resources, and a high percentage of public trust in state institutions. The case of Sweden and other Scandinavian countries shows that the considerable size of the public sector, typical to this region (over 50% of GDP), isn’t a big obstacle to economic growth in these countries, though in general the local growth rate is lower than, for instance, in the EU and the US. This is due to the high quality of public administration and high level of public trust in state institutions [7].
For example, Sweden boasts one of the world’s best state institutions: Sweden ranks third in the world by the aggregate indicator of the state institutional capacity, estimated using the Worldwide Governance Indicators. (Aggregate indicators of government effectiveness, regulatory quality, and control of corruption according to the Worldwide Governance Indicators of the World Bank [8]), and the level of public trust in the government is 63% [9]. It should be noted that size of the public sector isn’t the only determining factor that drives economic growth ― in the countries at a relatively advanced stages of economic development (i.e., with GDP close to the potential), the growth rates might be lower, regardless of the public sector size.
Although there’s no universal approach to the concept of what should be considered the optimum size and configuration of the public spending in a particular economy, economists tend to think that the size of the public sector should not exceed 40% of the GDP [10], because higher public spending is associated with slower economic growth. Countries, where the share of GDP redistribution through the public sector exceeded 45%, showed lower rates of GDP growth (1.6% per year) than those with a smaller public sector (Figure 6). For example, in the countries with public spending less than 35% of GDP growth rates were at 4.2% per year. It indicates a certain correlation between the volumes of public expenditure.
Figure 6. Economic growth slows down in countries with high share of public spending in GDP
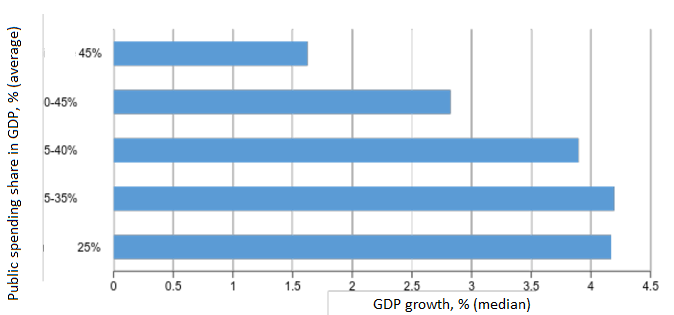
Source: CES estimations on the basis of IMF data (WEO database), the sample covers 165 countries of the world over the period of 2000 to 2013
Table 2. Regression analysis results*
| Model specification | 1 | 2 | 3 | 4 | 5 | 6 | 7 |
| Invariable | -63,02** (24,30) | -59,16** (21,08) | -59,56*** (10,64) | -41,26* (19,78) | -48,20*** (15,16) | -84,92*** (21,02) | -62,57*** (13,04) |
| Public expenditure/GDP | 383,72** (142,07) | 347,02** (122,35) | 319,03*** (60,99) | 264,56** (109,74) | 271,55*** (83,31) | 474,79*** (111,69) | 326,99*** (75,98) |
| (Public expenditure/GDP)^2 | -534,80** (195,36) | -461,29** (163,69) | -415,18*** (80,67) | -373,83** (142,29) | -374,47*** (111,66) | -627,09*** (143,40) | -426,42*** (103,61) |
| Crisis (dummy) | -13,71*** (2,69) | -7,32*** (1,19) | -9,11** (3,04) | -7,05*** (2,00) | |||
| Russian GDP | 0,81*** (0,12) | 0,83*** (0,22) | 0,58** (0,20) | 1,19*** (0,20) | |||
| Crops price index (change %) | 13,89** (5,89) | 9,69* (4,49) | |||||
| Global steel demand (change %) | -0,14 (0,20) | ||||||
| Number of observations | 18 | 18 | 18 | 18 | 18 | 18 | 18 |
| R-squared | 0.244197 | 0.65728 | 0.858415 | 0.773694 | 0.824397 | 0,885933 | 0.78258 |
| F-statistic | 3.795896 | 10.01503 | 326.5504 | 22.686 | 28.2367 | 25,24193 | 26.75188 |
| DW-statistic | 1.572878 | 1.066332 | 2.09104 | 1.24234 | 1.979718 | 1,932264 | 2.185962 |
| Curve maximum | 35.9% | 37.6% | 38.4% | 35.4% | 36.3% | 37.9% | 38.3% |
Note: dependable variable in all model specifications — real change of Ukrainian GDP
*** (** and *) ― statistically significant coefficients at the level of 1% (5% and 10%). Standard deviations are given in brackets.
As a result of regression analysis, it was determined that the optimum share of the public sector in GDP is about 37% of GDP (simple average from the 35,4-38,3% range, determined using different specifications of the regression model ― see Table 2). Basing on the hypothesis that a too high a level of redistribution of GDP through the budget entails slower rates of economic growth, a deviation from the average optimum level of expenditure to the level of expenditure as of 2014 (45.4% of GDP), according to theoretical calculations, can slow down the average annual real GDP growth by 2.9 percentage points (with a confidence interval of 2.3-3.9 percentage points), and a deviation from the average level of expenditures for the period of 2010-2014 (47% of GDP) ― by 4.2 percentage points (with a confidence interval of 3.9-5.6 percentage points).
However, the empirical analysis isn’t sufficient for assertion that the high level of public spending in GDP is a major cause of GDP dynamics; it can be rather argued that there’s a nonlinear correlation between these indicators. For the period available for analysis, GDP dynamics was quite volatile, which also affected the ratio between public spending and GDP; with rapid GDP growth and slower growth of public expenditure the ratio between public spending and GDP decreased, and in some cases, public spending grew faster than GDP, which caused an increase of level of redistribution through the budget (i.e. the ratio between public spending and GDP isn’t completely independent from GDP growth). Thus, the numerical results should be interpreted with caution because of the existence of statistical uncertainty and the inability to prove a causal link between size of the public sector and GDP growth.
Moreover, the small sample size, the instability of the economic environment, and the large number of structural reforms in the economy of Ukraine from 1997 to 2014 also allow casting some doubt upon the regression analysis results.
However, changing model specification and introducing different independent variables slightly influences the level of the optimum size of the public sector, and correlates well with the results of a similar analysis for European countries [11], obtained using a more qualitative panel data, and with the expected negative impact of low institutional capacity combined with high public spending on economic growth [12].
Institutional capacity of the state to allocate economic resources is an important factor of the economic growth of the country. It can be assumed that the lower the institutional capacity of the state, the more the economy will lose in economic growth if redistribution through the budget is too large. In addition to the empirical studies [13], this is confirmed by simple logic ― if an institutionally capable state spends every dollar effectively, it brings much more benefit than when the government scores low in the ratings of government effectiveness, regulatory quality, and control of corruption. For Ukraine, the combination of high public spending and low institutional capacity, according to the estimations of the theoretical model, can mean the gap in GDP growth by 2-4 percentage points per year.
Figure 7. Economic growth rates, public sector size, and government effectiveness*
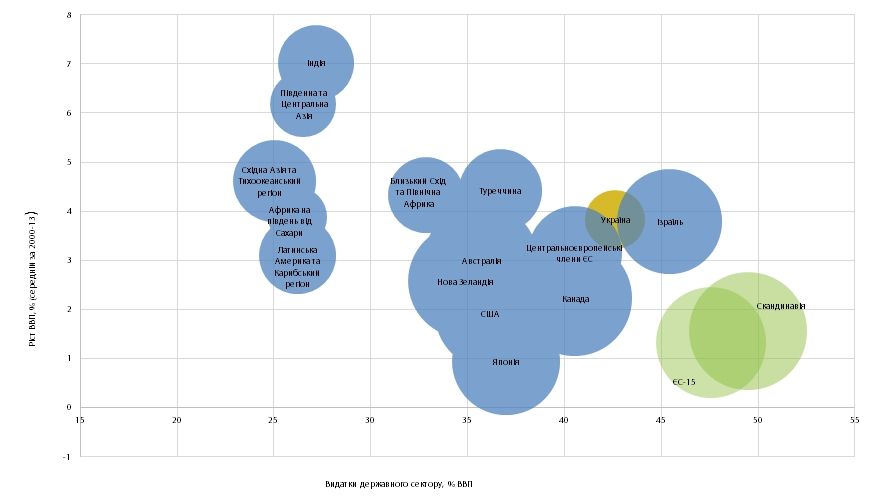
* Circles size reflects the government effectiveness index value, normalized to the 0-100 range; the bigger the size of the circle, the higher the government effectiveness. Source: IMF (WEO), World Bank (WGI ― Government Efficiency), CES estimations
Obvious options in this case are either increasing the institutional capacity of the state, or reducing the share of public expenditure in GDP, or (most preferably) combining both. Possible alternative approaches to economic policy in such a situation:
- Rapid reduction of public expenditure to the optimum level of 37% of GDP in one to two years. Given the large size of the necessary fiscal consolidation, such an approach requires a partial or total withdrawal of the state from certain fields of activity (deetatization): for example, removal of subsidies to enterprises, limitation of rights to free higher education and medicine for the wealthy and affluent groups of citizens, reduction of social and pension expenditure for such categories of citizens, among others.
- Gradual reduction of the costs to the optimum level of 37% of GDP due to reduction of their increase rate, which must be lower than the nominal GDP growth rate.
- Maintaining of a consistently high level of public spending and focusing on improving the institutional capacity.
All other things being equal, according to theoretical estimations, the best results can be achieved in case of a rapid reduction in public spending in 2016 to its optimum level of 37% of GDP. This would accelerate average annual GDP growth in 2016-2020 by 1.2-1.8 percentage points compared with the current IMF forecast. A more gradual approach, which provides for a uniform reduction of public spending to 37% of GDP by 2020, can accelerate average annual economic growth by 0.9-1.3 percentage points; in other words, failure to radically and rapidly cut public spending will lead to a loss of additional 0.3-0.5 percentage points of real GDP growth per year.
To minimize the negative impact of such cuts on the economy in the short term, it is necessary to ensure its implemented not just by flat cuts of a certain percentage of all costs, but through well-considered structural reforms and at the expense of the least efficient, in terms of influence on aggregate demand, expenditure items, and combine it with cuts of the taxes that most affect aggregate demand.
For instance, a distinctly negative impact on aggregate demand and economic growth would lead to a reduction in public sector employment, which adversely would negatively affect households demand, combined with a reduction in corporate income tax of those companies that would not be interested in investing the released funds, taking into account the reduction of demand. And vice versa ― a reduction in excessive spending on government procurement, associated with corruption and inefficiency, combined with a reduction in salary taxes, would have a positive impact on the state of aggregate demand.
Notes
[1] Граничний продукт (Wikipedia)
[2] Robert J. Barro. 1990. Government Spending in a Simple Model of Endogenous Growth. The Journal of Political Economy, Vol. 98. No. 5 Part 2: The Problem of Development. – Access mode: https://dash.harvard.edu/bitstream/handle/1/3451296/Barro_GovernmentSpending.pdf?sequence=4
[3] http://soc.kuleuven.be/io/egpa/fin/paper/slov2004/pevcin.pdf
[4] Pevcin P. 2004. Does Optimal Size of Government Spending Exists? ― Access mode: http://soc.kuleuven.be/io/egpa/fin/paper/slov2004/pevcin.pdf
[5] Magazzino C. and Forte F. 2010. Optimal Size of Government and Economic Growth in EU-27 ― Access mode: https://mpra.ub.uni-muenchen.de/26669/
[6] Gill I. and Raiser M. 2012. Golden Growth: Restoring the Lustre of the European Economic Model. 2012. The World Bank
[7] Andreas B. and Magnus H. 2011. Government Size and Growth: A Survey and Interpretation of the Evidence. – Access mode: http://journalistsresource.org/wp-content/uploads/2011/08/Govt-Size-and-Growth.pdf
[8] http://info.worldbank.org/governance/wgi/wgidataset.xlsx
[9] ОЕСР (2013). Government at a Glance. ― http://www.oecd-ilibrary.org/governance/government-at-a-glance-2013/trust-in-government_gov_glance-2013-7-en
[10] Gill I. and Raiser M. 2012. Golden Growth: Restoring the Lustre of the European Economic Model. 2012. The World Bank ― Access mode
[11] (Magazzino C. and Forte F. 2010. Optimal Size of Government and Economic Growth in EU-27. ― https://mpra.ub.uni-muenchen.de/26669/
[12] Afonso. A., Joao T.J.. 2011. Economic Performance and Government Size. 2011. European Central Bank www.ecb.europa.eu/pub/pdf/scpwps/ecbwp1399.pdf
[13] See previous link.


Attention
The authors do not work for, consult to, own shares in or receive funding from any company or organization that would benefit from this article, and have no relevant affiliations