During the election season, politicians are prone to populism: they promise to lower gas tariffs, reduce retirement age and ensure state-guaranteed employment for all citizens. The survey by Kantar TNS and Centre for Economic Strategy (CES) shows that ordinary Ukrainians are also susceptible to populism: about 84% of citizens support populist policies. Here, however, we use three examples to show that people can be persuaded to change their mind and support a more reasonable policy instead.
In this article, we use examples of three populist promises to show how to reduce the support of populist policies. Unfortunately, we did not see as drastic change of opinion regarding other populist policies as we did for these three. For instance, 83% of citizens support price controls regardless of the arguments used. Here, we look just into the most successful examples where most respondents refused to support populist policies after receiving more information.
We acknowledge that not all respondents radically change their mind under the influence of our methods, but our data convincingly shows that the answer given by respondents to policy questions depends on the context. Therefore, we believe that by communicating such context effectively, people’s opinions can be changed. Our goal is to show what context and arguments should be presented to respondent.The objective of our survey is to move from the acknowledgement of the fact that populism is a problem to discussion of the ways how it can be solved with the right communication.
Survey design
The survey was conducted in February-March 2019. The sample is representative for the adult population (18+) of Ukraine by age, region, gender, and settlement size.
In Donetsk and Luhansk regions, the survey was conducted only on the territory controlled by the Ukrainian government.
A total of 2000 respondents were interviewed, those who live in all regions of Ukraine and in Kyiv (except for AR of Crimea). The survey was conducted with a CATI method (Computer-assisted Telephone Interviewing)*.
Methodology
The results, which show that a particular group is more or less inclined to be advocates or opponents of a certain populist reform, or more or less inclined to change their mind after obtaining additional information, are based on a logistic regression analysis of the survey data. The control variables in the regression were gender, age, age squared, settlement size, region, education, employment status, household income, attitude to risks, belief in fortune tellers and psychics, and tolerance to the LGBT community**.
State-guaranteed employment or independent job search?
87% of citizens believe that state-guaranteed employment will have a positive impact on the welfare of their households. Such policy is unrealistic and, as shown by the experience of the Soviet Union, it can lead to ineffective use of the labour force and have a negative impact on economic growth.
However, when we offer respondents to choose between two alternatives – (1) state-guaranteed employment and (2) it is the responsibility of each individual to look for a job, while the role of the state is only to provide conditions for business development, only 23% continue to support state-guaranteed employment.
In our view, the presence of alternatives in the second question gives the respondent a context in which to consider this policy, which encourages a person to think and choose a more realistic and effective alternative.
Figure 1. How does the attitude of the Ukrainians towards guaranteed employment change depending on the context?
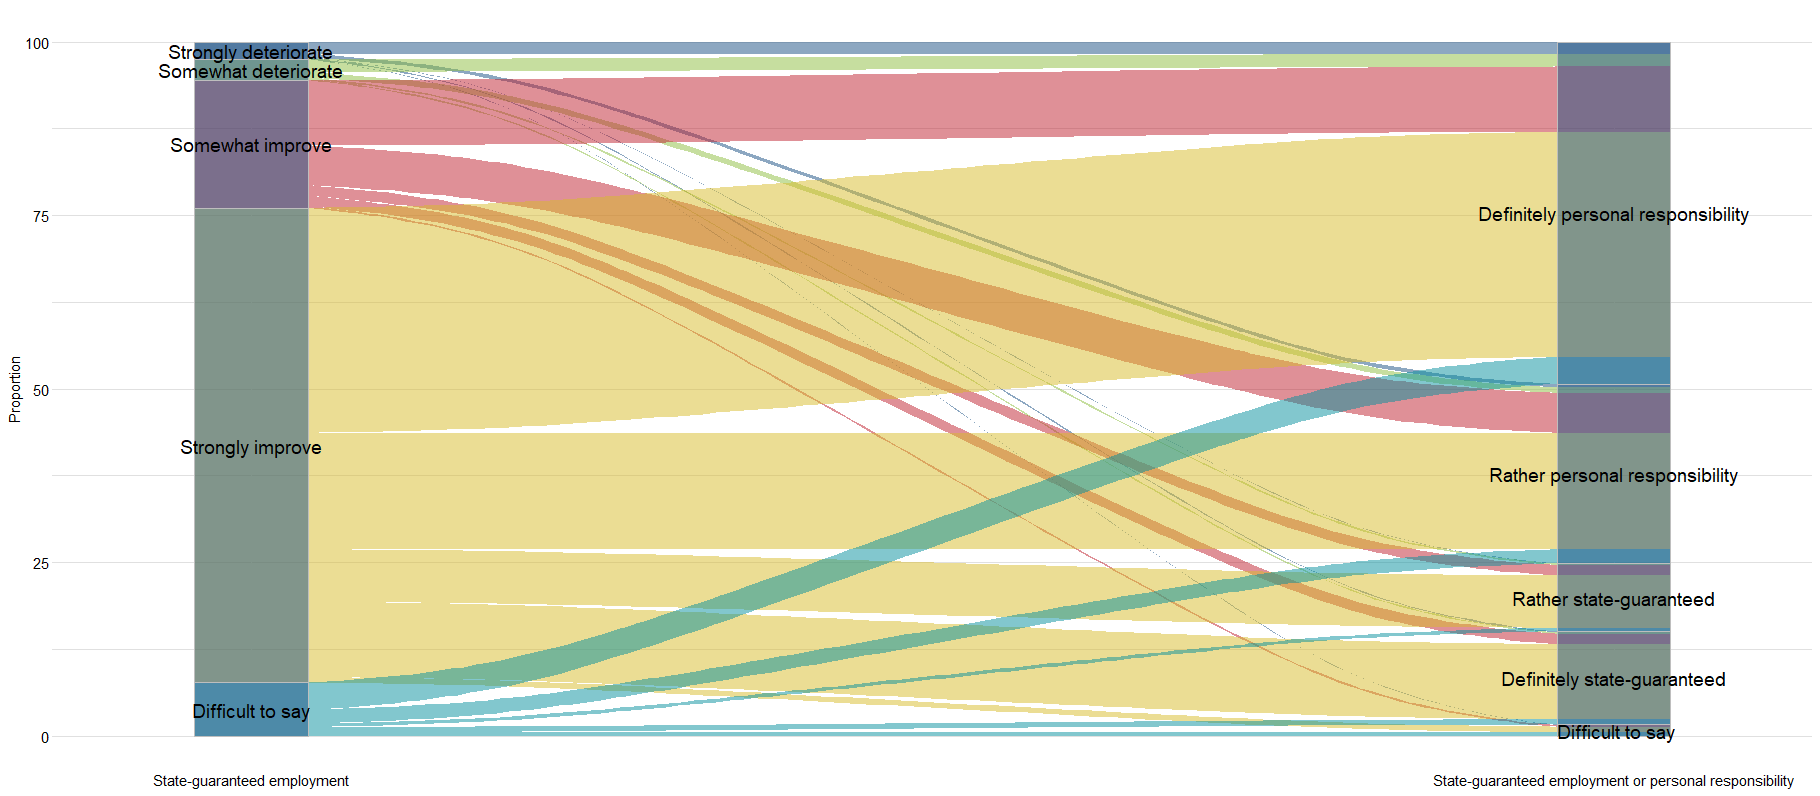
Note: The scale on the left shows the answer to the question: “State-guaranteed employment to all citizens – how will this affect the welfare of your household?”*** The scale on the right shows the answer to the question: “Which of these statements do you agree with the most – 1: State-guaranteed employment / 2: It is the responsibility of each individual to look for a job.”
Table 1. Distribution of the answers to the question “State-guaranteed employment to all citizens – how will this affect the welfare of your household?” (Down) and “Which of these statements do you agree with the most – 1: Employment guaranteed by the state to all citizens / 2: it is the responsibility of each individual to look for a job” (Across)
| Definitely state-guaranteed | Rather state-guaranteed | Rather personal responsiblity | Definitely personal responsibility | Difficult to answer | Total | |
| It will strongly deteriorate | 3
(0,2%) |
1
(0,0%) |
10
(0,5%) |
35
(1,8%) |
1
(0,0%) |
50 |
| It would somewhat deteriorate | 4
(0,2%) |
4
(0,2%) |
16
(0,8%) |
37
(1,8%) |
0
(0,1%) |
61 |
| It would somewhat improve | 30
(1,5%) |
30
(1,5%) |
115
(5,8%) |
188
(9,4%) |
5
(0,2%) |
368 |
| It will strongly improve | 217
(10,8%) |
151
(7,5%) |
336
(16,8%) |
648
(32,4%) |
16
(0,8%) |
1368 |
| Difficult to answer | 15
(0,8%) |
10
(0,5%) |
40
(2,0%) |
78
(3,9%) |
10
(0,5%) |
153 |
| Total | 269 | 196 | 517 | 986 | 32 | 2000 |
Note: The groups that changed their mind when answering the second question and began to support state-guaranteed employment are highlighted in orange. The groups that changed their mind when answering the second question and began to support personal responsibility for looking for a job are highlighted in green.
Figure 1 and Table 1 show that most people who believe that state-guaranteed employment will have a positive impact on their well-being start supporting a personal responsibility for finding a job when answering the question with two alternatives.
We have singled out three groups from the sample for further analysis:
- Those who were and still are the supporters of state-guaranteed employment. They constitute 21% of the sample (hereinafter – the staunch supporters)
- Those who were and still are the opponents of government-guaranteed employment. They make up 5% of the sample (hereinafter – the staunch opponents)
- Those who believed that guaranteed employment would have a positive impact on their well-being, but changed their mind and started supporting personal responsibility for job search. They account for 68% of the sample.
Our analysis shows that socio-demographic group can be persuaded with a right context and additional information. People who live in small towns or villages where it is harder to find a job are more likely to support state-guaranteed employment.
A staunch opponent of the state-guaranteed employment is most likely to be a man with a higher education, a resident of a big city, living in Kyiv or in the Northern region, with higher material well-being, is willing to take on a financial risk and is less inclined to believe in the things that are not scientifically proven (fortune tellers, psychics and the belief that vaccination has more harm than good).
A staunch supporter of state -guaranteed employment is most likely to be a woman with a secondary education, living in the Eastern Ukraine, either in a village or in a small town. Such person is more likely to have low household income, believe in fortune tellers and psychics, and is intolerant of the LGBT community. Generally, it is more diffucult for women to find a job since they often make a long break in their career due to parental leave. Furthermore, it is more difficult to find a job without professional or higher education. In villages and small towns, there are also fewer opportunities for employment. Therefore, it is reasonable that residents of these settlements are more likely to support state-guaranteed employment. At the same time, the level of critical thinking in everyday life is still important: people who believe in fortune tellers or psychics (which have no scientific proof) and are intolerant to LGBT community tend less to exhibit critical thinking in economic policy.
At the same time, the respondents who believed that guaranteed employment would have a positive impact on their welfare, but later supported personal responsibility for job search do not differ from the average resident of Ukraine. Thus, the use of persuasive arguments and the emphasis on the fact that there is a choice between two policies work well for all social groups.
Reduce gas tariffs –for everyone or only for the poor?
Reduction of gas tariffs is a popular election promise that resonates with the voters. 87% of Ukrainians say that it would improve their well-being. However, such proposal is populist: lowering tariffs below the market price would significantly increase budget deficit. Moreover, it contradicts Ukraine’s obligations to the IMF. Such reduction could have a temporary positive impact on the household budget, but the long-run negative effects would outweigh any benefits. In addition, people on low income already receive subsidies and do not pay a market price for gas.
Firstly, we asked the respondents how the reduction of gas price would affect their well-being. Then, we asked them a question – Is it better to have cheap gas for the poor only, and the rich should pay the market price, or should the gas price be low for everyone? As we can see, when people are provided with more truthful information, only 36% support the reduction of price on gas for everyone.
Figure 2. How do the attitudes of the Ukrainians to gas tariffs reduction change depending on the context?
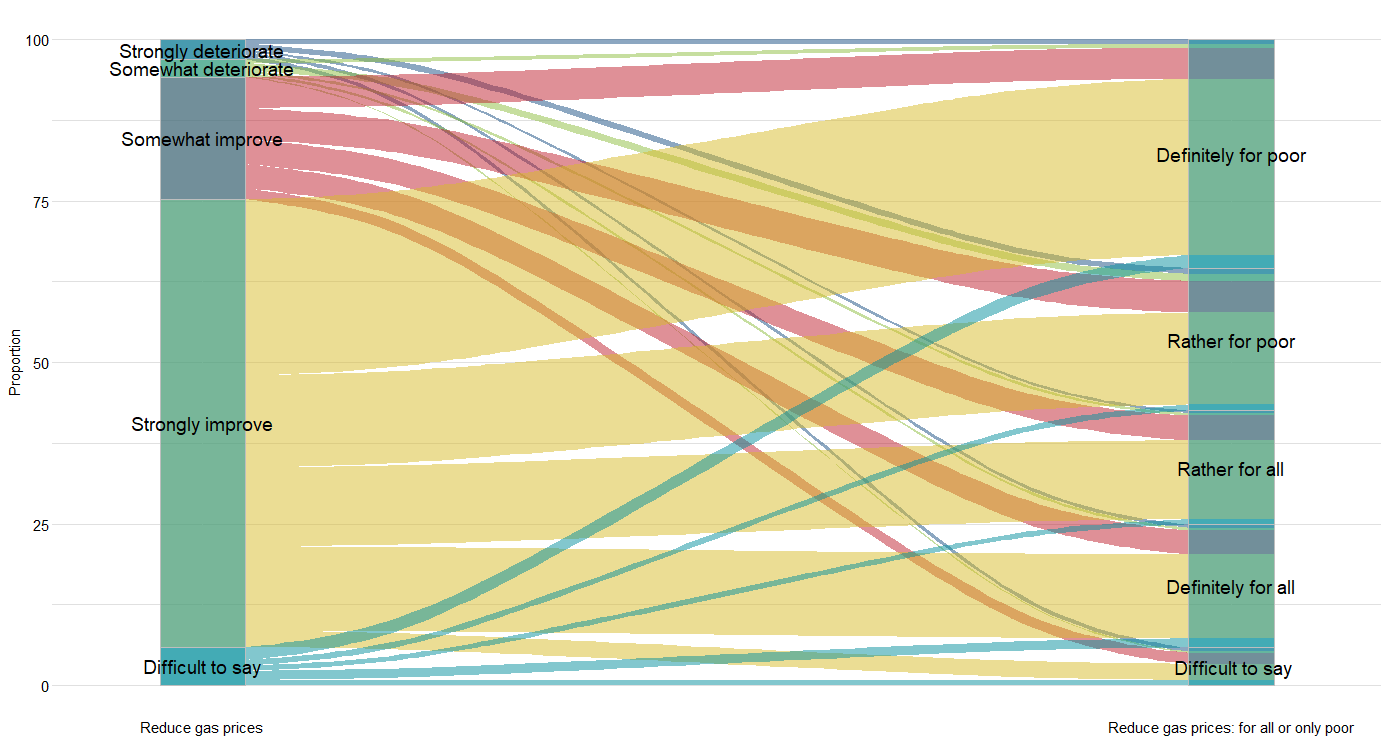
Note: The scale on the left shows the answer to the question: “Halving the gas prices – how will it affect the welfare of your household?”. The scale on the right shows the answer to the question: “Which of these statements do you agree with the most – 1: Cheap gas for everyone at state expense/ 2: Cheap gas for the poor”
Table 2. Distribution of the answers to the question: “Halving the gas prices – how will it affect the welfare of your household?” and “Which of these statements do you agree with the most – 1: Cheap gas for everyone at state expense/ 2: Cheap gas for the poor”
| Definitely for everyone | Rather for everyone | Rather for the poor | Definitely for the poor | Difficult to answer | Total | |
| It will strongly deteriorate | 5
(0,5%) |
4
(0,4%) |
9
(0,9%) |
7
(0,7%) |
6
(0,6%) |
31 |
| It would somewhat deteriorate | 4
(0,4%) |
4
(0,4%) |
11
(1,1%) |
6
(0,6%) |
2
(0,2%) |
27 |
| It would somewhat improve | 37
(3,7%) |
38
(3,8%) |
49
(4,9%) |
48
(4,8%) |
17
(1,7%) |
189 |
| It will strongly improve | 130
(13,0%) |
122
(12,2%) |
142
(14,2%) |
272
(27,3%) |
25
(2,5%) |
691 |
| Difficult to answer | 14
(1,4%) |
8
(0,8%) |
9
(0,9%) |
20
(2,0%) |
8
(0,8%) |
59 |
| Total | 190 | 176 | 220 | 353 | 58 | 997 |
Note: The groups that changed their mind when answering the second question and began to support gas price reduction for everyone are highlighted in orange. The groups that changed their mind when answering the second question and began to support cheap gas only for the poor are highlighted in green.
Again, we decided to look at the profiles of those who are the staunch supporters of gas tariffs cuts (they supported the reduction of tariffs when answering both the first and second question: they accounted for 33% of the sample), the staunch opponents (they were against the reduction of tariffs when answering the first and the second question – they made up only 3% of the sample), and those who believed that a gas price reduction would positively affect their welfare but did not agree that gas should be cheap for everyone (47%).
Our analysis shows that a typical representative of the staunch opponents and a person who changes their opinion on the tariffs does not differ significantly from the average Ukrainian. At the same time, the absence of statistically significant influence can be explained by the smaller sample size for this question.
A staunch supporter of tariff cuts is most likely a woman aged under 40 years, living in the North of Ukraine; she can afford to buy food and essential clothing – nothing more. Unlike pensioners, most of whom receive subsidies, employed people on low wages suffer the most from tariff increases.
Reduction in retirement age or a higher pension?
The pension reform was also often mentioned by the politicians in their election programs. Some of them state that an increase in the work experience required for the retirement is unsubstantiated and harmful, and demand to reduce the retirement age. However, this rhetoric is populist. When pushing for the reduced retirement age, these politicians forget to mention the sources to cover the Pension Fund deficit. By lowering the retirement age, a larger proportion of people will be pensioners, while the revenues to the Pension Fund will decrease, because the size of the working age population will decrease. Increasing the work experience needed to retire would make the share of pensioners be smaller and the budget of the Pension Fund bigger. Thus, pensioners will receive a higher pension.
Will the Ukrainians support the idea of lowering the retirement age if they are provided with a wider context? At first, we asked the respondents how the reduced retirement age will affect the welfare of their household, mentioning a popular myth that “many people die before they reach the retirement age.” 74% of the Ukrainians supported the reduction of the retirement age. However, when we add extra information and ask whether it is better to work longer and receive a higher pension, or retire earlier and receive a lower pension, only 38% spoke in favour of early retirement.
Figure 3. How do the attitudes of the Ukrainians to the reduction of the retirement age change depending on the context?
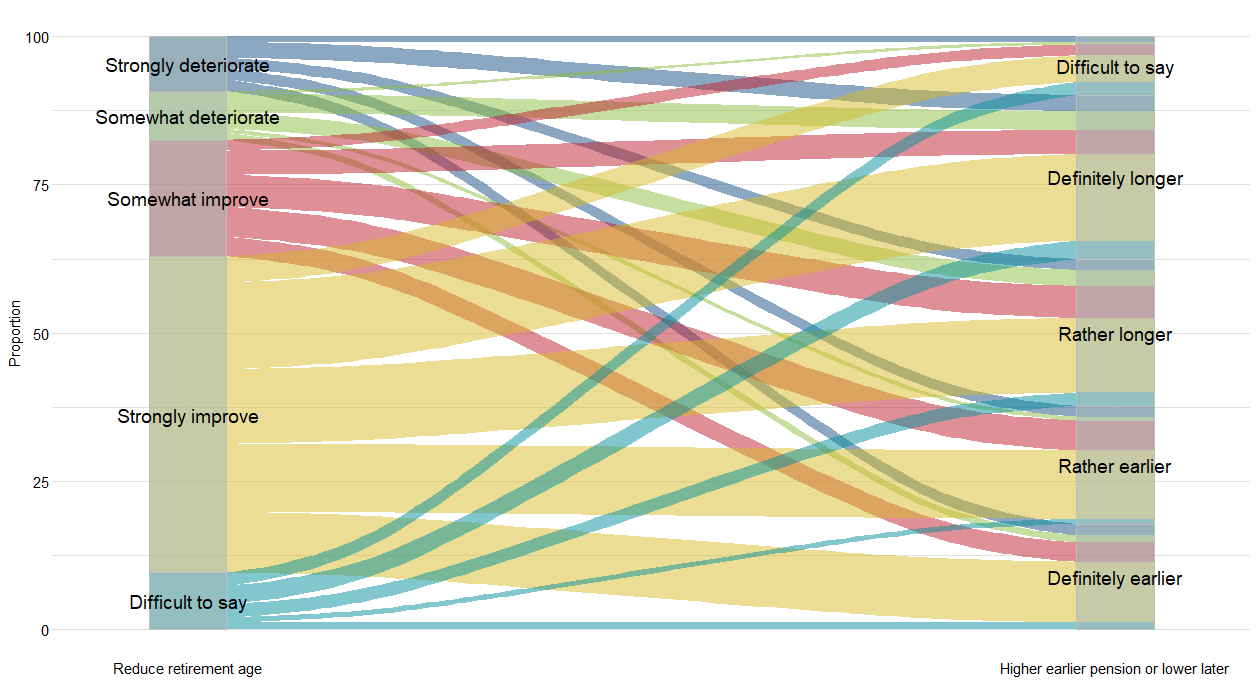
Note: The scale on the left shows the answer to the question: “Reducing the retirement age because many fail to live up to the retirement – how will it affect the welfare of your household?”. The scale on the right shows the answer to the question: “Which of these statements do you agree with the most – 1: It is better to work longer and to receive a higher pension / 2: It is better to retire earlier, even if the pension is low”.
Table 3. Distribution of the answers to the question: “Reducing the retirement age because many people die before they reach the retirement age – how will it affect the welfare of your household?” and “Which of these statements do you agree with the most – 1: It is better to work longer and to receive a higher pension / 2: It is better to retire earlier, even if the pension is low”.
| Definitely longer | Rather longer | Rather earlier | Definitely earlier | Difficult to answer | Total | |
| It will strongly deteriorate | 28
(2,7%) |
19
(1,8%) |
19
(1,8%) |
20
(1,9%) |
9
(0,6%) |
95 |
| It would somewhat deteriorate | 33
(3,2%) |
28
(2,7%) |
7
(0,7%) |
12
(1,2%) |
5
(0,5%) |
85 |
| It would somewhat improve | 42
(4,1%) |
56
(5,4%) |
52
(5,0%) |
34
(3,3%) |
19
(1,8%) |
203 |
| It will strongly improve | 151
(14,6%) |
130
(12,6%) |
119
(11,5%) |
106
(10,3%) |
46
(4,5%) |
552 |
| Difficult to answer | 32
(3,1%) |
23
(2,2%) |
9
(0,9%) |
11
(1,1%) |
23
(2,8%) |
98 |
| Total | 286 | 256 | 206 | 183 | 102 | 1033 |
Note: The groups that changed their mind when answering the second question and began to support later retirement are highlighted in green. The groups that changed their mind when answering the second question and began to support earlier retirement are highlighted in orange.
Again, we analysed those who changed their mind (they make up 37% of the sample), those who were the staunch opponents of the reduction of the retirement age (10%), and the staunch supporters of such a reduction (30%) separately
A typical representative of the staunch opponents of the reduction of retirement age is a man from a household with a high household income. People with higher incomes may be less inclined to support a reduction in retirement age, because pensions in Ukraine are relatively low, and people with higher incomes are more likely to have savings. Due to this fact, people with higher incomes regard the retirement as relatively less attractive.
A typical supporter of the retirement age reduction is more likely a middle-aged person. A higher support for reducing the retirement age among middle-aged people may be due to the fact that when the retirement age is reduced, this group will win the most: they will approach the retirement first. Although the younger groups will also be closer to retirement, they can value it less, because it is a more distant future for them.
A person who is inclined to change their point of view after hearing the arguments in favour of raising the retirement age is more likely a younger person. It may be easier to convince young people of the need to raise retirement age because they have the longest time until retirement. The economic theory and empirical studies show that people tend to value the present more than the future. Therefore, early retirement for young people may be less valuable, and they are more flexible in their attitudes to raising the retirement age.
Conclusions
Survey results give grounds for optimism: although most people believe in populist slogans, one can help them think more critically if using the right arguments.
The research findings also show that any group can be reached: the profile of a person who is persuaded is different for all three examples.
However, the population groups who are more vulnerable to the certain problem are more inclined to support easy solutions to complex problems. For these groups, it is important not only to try to find the right arguments against populism, but also to propose alternative solutions.
It is also important that critical thinking is a vaccination against populism: those who apply critical thinking in their everyday life are less inclined to support populist ideas.
The survey was conducted with the support of the Analytical Centers Development Initiative implemented by the International Renaissance Foundation in partnership with the Foundation for the Development of Analytical Centers with the financial support of the Swedish Embassy in Ukraine.
* It is worth noting that CATI as a survey methodology has its advantages and disadvantages. On one hand, this methodology reduces the level of socially desirable responses, but, on the other hand, some of the wordings may not be clear while listening to them. For our part, we tried to minimize the negative effects by conducting additional trainings with interviewers and simplifying the questions and answersby listening to audio records of the interviews.
** The attitudes towards risks is measured as the answer to the question on the attitudes to financial risks and investments, where the response alternatives could range from “Not ready to take a financial risk” to “Ready to significant financial risks to reap significant profits”. Belief in the fortune tellers and psychics is measured as the answer to the question “Certain people have extraordinary capabilities, for example, psychics or fortune tellers. How much do you agree with this statement?” Tolerance to the LGBT community is measured with the question: “Which of these groups would you not like to be your neighbour?”, where a person who said that they would not like to be a neighbour of a person from certain group is considered to be intolerant towards that group.
*** Our results also indicate that the less well-off are more likely to believe that the gas price reduction will positively affect their welfare. It is not rational, as they would benefit less from reducing gas prices than the better-off: less well-off people already have a right to receive subsidies, so they de facto pay less than the market price.


Attention
The authors do not work for, consult to, own shares in or receive funding from any company or organization that would benefit from this article, and have no relevant affiliations