In the article, we analyze the response of households’ energy expenditures to energy prices increase and make inference about its relation to energy consumption. The household-level data suggest that population indeed reduces gas consumption because of price increase. In addition, households using gas for heating partially substitute it with electricity while those using gas for cooking – reduce their electricity expenditures to mitigate gas price shock. These findings are consistent with macroeconomic data, since the share of electricity in residential energy consumption has increased over 2008-2014.
In the article “A Drop In Gas Consumption in Ukraine: “Peremoha” or Statistics?” Oleksii Khabatiuk concludes that aggregate reduction of gas consumption in 2014-2015 was predominantly a response to increase of natural gas price and other factors. Since one of “other factors” is elimination of corruption schemes in energy sector, which is extremely difficult to measure, it is important to understand if households indeed reduced the consumption of gas when its price increased. For this purpose, we analyze the data on households’ energy expenditures from Ukrainian Households’ Budget Survey (HBS) for years 2008-2014 conducted annually by Ukrainian State Statistics Service (UKRSTAT).
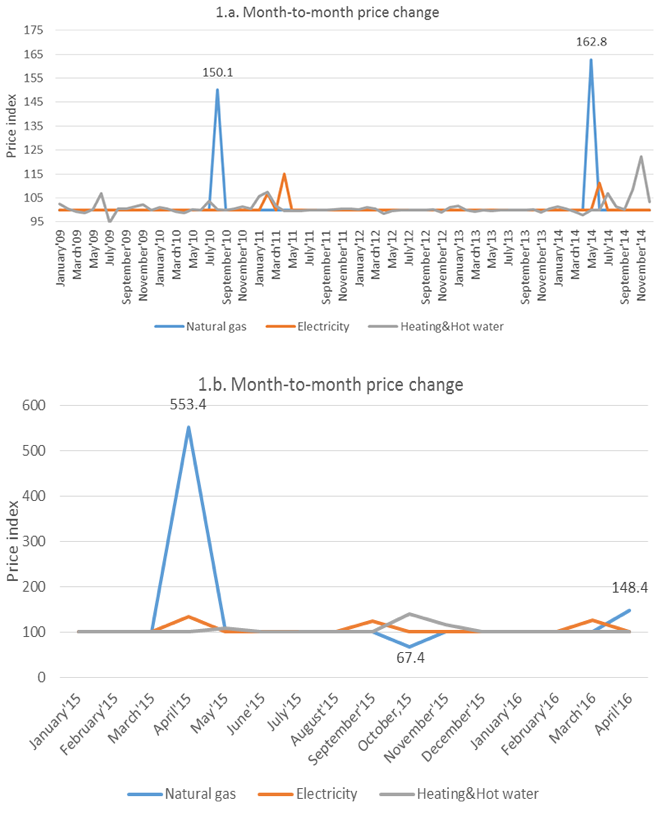
The changes in gas price occurred in 2015 (figure 1.b) are truly dramatic. Unfortunately, the data for this period is not yet available. However, during 2009-2014 there were several price jumps and, as a result, the average gas price has more than doubled (figure 1.a). We assume that households’ behavior in 2015 should align in terms of the response to gas price changes in previous years, even though its magnitude can differ.
Figure 1. Dynamics of price indexes for natural gas, electricity, heating and hot water in January 2009- April 2016
Source: ukrstat.gov.ua
Do household’s expenditures appear to respond to change of energy prices?
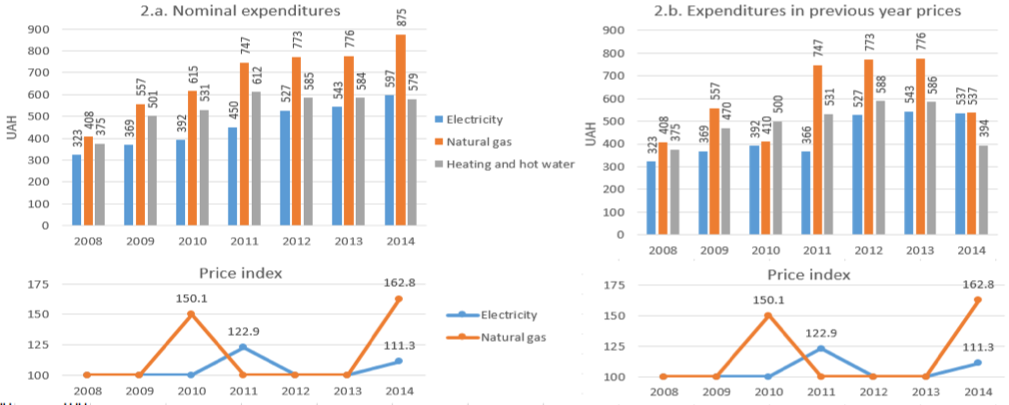
Let’s consider the average energy expenditures of a Ukrainian household (note: according to UKRSTAT in 2014 there were 16.96 million households in Ukraine, which is 0.14 million less than in 2009). At figure 2.a, one can observe the changes of nominal expenditures on electricity, natural gas and heating over 2008-2014. More importantly, however, is to consider real (in prices of previous year) expenditures, presented at figure 2.b.
Indeed, when sharp increase of natural gas tariffs occurred (August 2010 and May 2014) the real annual expenditures on gas of average household decreased, which suggests that there took place some improvement in energy efficiency. However, the response to increase in electricity price was not as significant. In 2011 and 2014 when real expenditures on natural gas have decreased, the real expenditures on electricity barely changed.
Figure 2. Annual expenditures on electricity, natural gas, heating and hot water of an average Ukrainian household in 2008-2014
Source: HBS; ukrstat.gov.ua
Have the households reduced the consumption of gas to keep the nominal expenditures at the level of the previous year? Partially yes; nominal expenditures on gas in 2010 and 2014 increased but not as much as prices. This conclusion is supported by the corresponding reduction in real expenditures (figure 2b). Accordingly, households should have somehow rearranged their budgets in order to spend extra on gas. Did they?
Did the reduction of natural gas consumption affect demand for other energy sources?
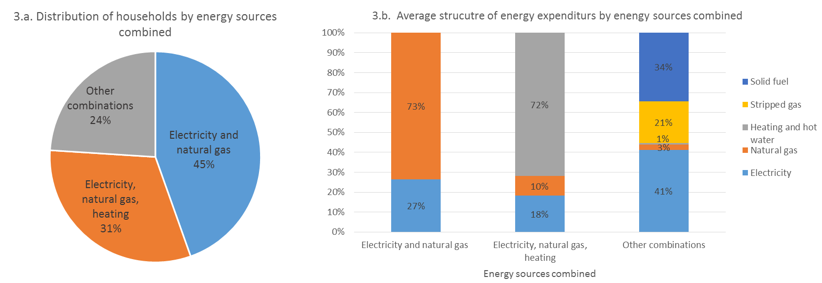
Theoretically, it is possible that in periods of gas price increase households substituted more expensive natural gas for cheaper energy sources. However, short run energy substitution is limited to energy sources the household already has access to; accessing other energy sources requires extra investment, which is unlikely in the short run (Sweeney, 1984). Therefore, to analyze the possibilities of energy substitution we separate the households in three groups by energy sources they combined (figure 3.a) and study how their energy expenditures structure (figure 3.b.) changed in response to price increase.
Figure 3. Energy consumption of Ukrainian households by energy sources they used in 2008-2014, entire sample and by groups
Source: HBS
The first group (figure 3b, left column) includes 45% of households; they consumed only electricity and natural gas with average share of the latter in energy expenditures equal to 73%. Most likely, the majority of those households used the gas for heating purposes. The central column on figure 3.b describes energy consumption of the second group that includes about one-third of Ukrainian households. They consumed natural gas together with electricity, heating and hot water. For these households natural gas was less important, since it made only 10% of their energy expenditures, most likely used for cooking and, possibly, occasional water heating. The rest 24% of households (third column on figure 3.b), consumed other combinations of one or more energy sources, however the share of natural gas in their energy expenditures was less than 3%.
Thus, most of the population’s natural gas consumption in 2008-2014 came from the first two groups of households providing about 98% of populations’ total expenditures on natural gas.
Figure 4. Dynamics of structure of households’ energy expenditures by energy sources combined in 2008-2014
Source: HBS, ukrstat.gov.ua
Interestingly, from Figure 4 we can conclude that on average the share of expenditures spent on different energy sources did not change over time, even though the prices have actually changed.
Certainly, it is important to note that amount of total expenditures is not established exogenously, but is a result of the household’s decision. In the model that evaluates households’ energy expenditures based on households’ characteristics (household’s size, composition, characteristics of household’s head, total annual income), dwelling characteristics (location, access to energy-related amenities, living area) and energy price indexes, we find that the most important factor affecting total energy expenditures is not the price change, but rather total income. While increase of household’s income by 10% is associated with increase of energy expenditures by 2.2-3.3%, the doubling of natural gas price, keeping all other factors fixed, drives up gas expenditures by less than 0.1%.
Such a sharp reduction of consumption, that almost completely compensates the effect of energy price increase on energy expenditures, is hard to believe. However, energy utilities pricing in Ukraine has discriminatory nature based on consumption level (e.g. since August 2010 different tariffs were established for households consuming below 2500 m3, from 2500 to 6000 m3 and above 6000 m3 of natural gas per annum). Therefore, to mitigate the impact of gas price increase in 2010 for households consuming above 2500 m3 of natural gas annually it was sufficient to reduce the consumption just below the threshold in order to qualify for a lower tariff. Another explanation that justifies small increase of expenditures in response to price increase is subsidies, which mitigate the burden of higher prices for a particular household at the expense of others.
Substitution between energy expenditures in response to natural gas price increase: results of econometric analysis
Did households rearrange their expenditures to mitigate the burden of gas price increase? To answer this question we use econometric analysis. To provide cause-effect interpretation of impact of gas price change on households’ energy choices we analyzed the structure of households’ energy expenditures following modified LA/AIDS model and the following assumption: facing an increase of energy prices a household first decides by how much it can afford to increase total expenditures on energy and then decides how to optimize the structure of energy consumed in order to fit the target amount of total energy expenditures. The results are summarized in table 1.
Table 1. The estimated response of share of natural gas expenditures in household’s energy budget to gas price increase
| % of gas price increase | Change of gas share in energy expenditures | |
| HHs consuming electricity and natural gas (base case: 72%) | HHs consuming electricity, natural gas, heating and hot water (base case: 11%) | |
| 100% | -1.7% | +0.7% |
| 200% | -3.4% | +1.5% |
| 500% | -8.4% | +3.7% |
| Summary | reallocation of expenditures from gas to electricity | reallocation of expenditures from electricity to gas, heating and hot water |
Overall, the model suggests that the reallocation between gas and other energy sources after control for households’ and dwelling characteristics and amount of subsidies received and gas price increase are related. But the energy substitution in this case appears to be quite moderate compared to conservation and observed only among selected households. Although correlation does not mandatory implies causation and households’ switching between electricity and natural gas can be not caused by natural gas price change (e.g. households in first column of figure 3.b use less energy efficient electric equipment as households in second column), the explanation based on energy substitution due to price change appears to be plausible.
In this case households which consume only electricity and natural gas respond to price increase of natural gas, ceteris paribus, by partial reallocation of their expenditures from gas to electricity. Therefore, for these households reduction of gas consumption is not only a result of energy conservation, but also of energy substitution between gas and electricity. Households which consume electricity, natural gas, heating and hot water, respond to gas price increase oppositely: they raise the share of expenditures spent on natural gas and heating at the cost of electricity expenditures. This appears to be reasonable given the assumption that these households use the gas for cooking and occasional water heating when price increases. They are unlikely to invest into electric stoves.
Do we observe other evidence of substitution between gas and electricity in Ukraine?
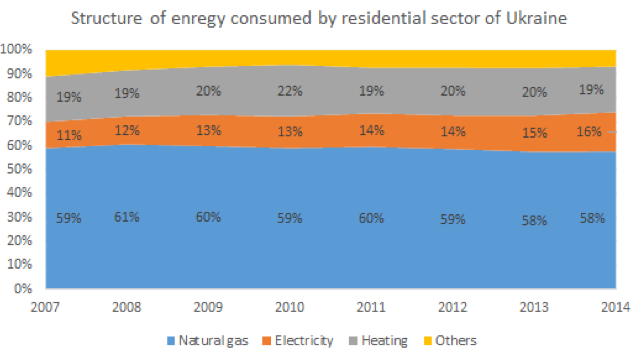
If 45% of Ukrainian households, providing 87% of populations’ expenditures on natural gas, respond to natural gas price increase by increase of demand for electricity, this should be reflected in national trends. It actually is indeed so. According to the energy balance of Ukraine the share of electricity in total residential energy consumption has slightly increased from 11% to 16% in 2007-2014; the share of natural gas has decreased from 61% to 58% in 2008-2014 after increase by 2% in 2007-2008 (figure 5).
Figure 5. The structure of energy consumption by residential sector in Ukraine (in ktones of energy equivalent)
Source: Energy balance of Ukraine (ukstat.gov.ua)
Importantly, the invariance of energy expenditures structure across time (figure 4.a and 4.b) does not contradict energy substitution. This can be illustrated by a simple example.
Suppose in 2013 a household consumes only 2000 m3 of gas annually at price 1 UAH per m3 and 2000 kWh of electricity at price 0.4 UAH per kWh with total expenditures on electricity and gas respectively 800 UAH and 2000 UAH. In this case 28.5% of energy expenditures is spent on electricity. In 2014 the price of gas increased by 60% and price of electricity – by 11%, but the household can decide to increase of expenditures on gas only by 20% (which is 2400 UAH) and maintain the same structure of expenditures. This implies reduction of amount of gas consumed to 1500 m3 by increasing electricity consumption to 2155 kWh, given its new price 0.44 UAH.
Conclusions
- The household-level data suggest that the reduction of gas consumption by population indeed takes places as gas price increases. Partially natural gas conservation is accompanied by a moderate substitution of gas with electricity which is relatively less expensive and more accessible.
- Households’ ability to respond to increase of energy prices (even though with considering option of subsidies receipt) by optimization of their energy budgets and energy conservation is advantageous in the sense that it mitigates the burden on their welfare.
Attention
The authors do not work for, consult to, own shares in or receive funding from any company or organization that would benefit from this article, and have no relevant affiliations
